The Knot reports US$4,600 average engagement-ring spending for its 2025 wedding cohort. BriteCo’s current appraisal-based index gives a US$6,939 median estimated sales price for 2025. A survey mean and a modeled platform median answer different questions, so neither should be read as a required personal budget. The Knot / The Knot Worldwide [S01]; BriteCo [S04].
This resource contains 71 published numerical observations in 26 grouped findings, with four charts and ten reproducible comparisons. Eight numerical records represent six publisher labels. Multiple records, response categories and annual cohorts do not mean 71 independent studies. The collection covers ring spending, stone origin, shopping, recipient involvement, styles, and affordability attitudes.
US$4,600
61%
Mean engagement-ring spending in The Knot’s wedding cohort.2025 weddings; ring purchases can be earlier; exact item n unavailable. The Knot / The Knot Worldwide [S01]
Lab-grown center stones in the reported ring purchases.The Knot’s survey; a couple/ring measure, not share of sales dollars. The Knot / The Knot Worldwide [S01]
22%
69%
Purchasers reporting a shared final ring decision.Jewelers Mutual May 2026; exact purchaser n unavailable. Jewelers Mutual [S02]
Think a ring should cost less than three months of salary.Finder August 2026 Australian wave; an opinion, not actual spending. Finder [S08]
What do engagement-ring buying statistics measure?
| Measure | Meaning | Limit |
|---|---|---|
| Reported mean spend | Average in the source’s surveyed group. | Can be affected by large purchases and sample selection. |
| Median estimated sales price | Middle modeled sale-price value under the source’s method. | Not a directly observed receipt for every appraised ring. |
| Replacement appraisal | Retail cost assigned for insurance replacement. | Different from purchase price, resale proceeds or an investment return. |
| Origin adoption | Share of eligible rings/people choosing or reporting a stone origin. | Not a share of dollars and not the same as willingness to consider. |
| Any selection input | Recipient took part in choosing the ring. | Broader than making the final decision jointly. |
| Wedding cohort | Couples whose weddings occurred in a given year. | Their ring purchases may have happened earlier. |
| Carat figure | A weight measure with a source-specific scope. | Center-only and total weight, or means and medians, cannot be interchanged. |
| Stated budget or preference | What respondents say matters or should be spent. | Not observed expenditure, debt or conversion into a purchase. |
How much do couples spend on engagement rings?
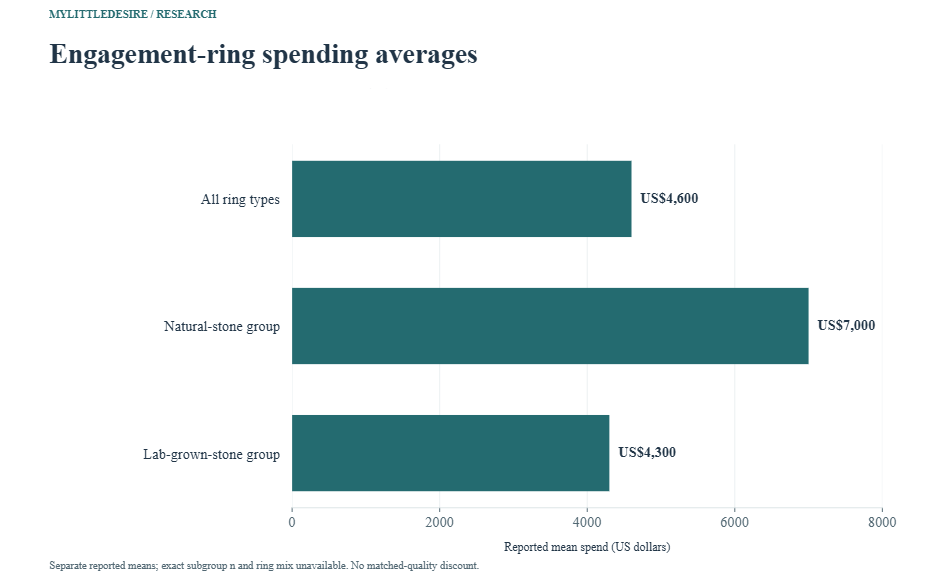
F01 Overall mean and source-labelled natural-stone/lab-grown-stone summaries. Nominal US dollars; exact item/subgroup n unknown. Ring purchases may predate 2025 weddings. Group means do not hold quality, size or design constant.
| Measure / group | Published result | Actual cohort or report period | Source |
|---|---|---|---|
| All ring types | US$4,600 | 2025 US wedding cohort; ring purchases can precede the wedding; exact ring-item dates unpublished | Original source [S01] PDF printed p.6 (physical p.8), The Ring, Jewelry at a Glance and origin panel |
| Natural-stone group | US$7,000 | 2025 US wedding cohort; ring purchases can precede the wedding; exact ring-item dates unpublished | Original source [S01] PDF printed p.6 (physical p.8), The Ring, Jewelry at a Glance and origin panel |
| Lab-grown-stone group | US$4,300 | 2025 US wedding cohort; ring purchases can precede the wedding; exact ring-item dates unpublished | Original source [S01] PDF printed p.6 (physical p.8), The Ring, Jewelry at a Glance and origin panel |
The Knot’s main survey includes 10,474 US couples married in 2025, recruited from its and WeddingWire’s members; the report also uses ad hoc research. The exact ring-question and stone-group bases are unpublished. The natural-stone and lab-grown-stone labels below follow the original panel. The Knot / The Knot Worldwide [S01].
Also Read:-
Wedding Guest Count Statistics 2027
Premarital Counseling Statistics 2027
Relationship Arguments And Conflict Statistics 2027
First Date Safety Statistics 2027
How Couples Meet Statistics 2027
How do sales estimates differ from appraisals?
F17 Selected year medians under the current restated index methodology. Nominal US dollars, selected platform records and unknown year bases. 2026 is January–June only. Sale figures are model-based estimates; appraisals measure retail replacement, not resale or a cash return.
| Measure / group | Published result | Actual cohort or report period | Source |
|---|---|---|---|
| 2024 full year | US$7,805 | Appraisal records: 2024 full year | Original source [S04] Engagement Ring Sales Price Vs. Appraised Value, numbers by year |
| 2025 full year | US$6,939 | Appraisal records: 2025 full year | Original source [S04] Engagement Ring Sales Price Vs. Appraised Value, numbers by year |
| 2026 January–June | US$6,736 | Appraisal records: 2026 January–June only | Original source [S04] Engagement Ring Sales Price Vs. Appraised Value, numbers by year |
F18 Selected year medians under the current restated index methodology. Nominal US dollars, selected platform records and unknown year bases. 2026 is January–June only. Sale figures are model-based estimates; appraisals measure retail replacement, not resale or a cash return.
| Measure / group | Published result | Actual cohort or report period | Source |
|---|---|---|---|
| 2024 full year | US$9,875 | Appraisal records: 2024 full year | Original source [S04] Engagement Ring Sales Price Vs. Appraised Value, numbers by year |
| 2025 full year | US$9,676 | Appraisal records: 2025 full year | Original source [S04] Engagement Ring Sales Price Vs. Appraised Value, numbers by year |
| 2026 January–June | US$9,551 | Appraisal records: 2026 January–June only | Original source [S04] Engagement Ring Sales Price Vs. Appraised Value, numbers by year |
F19 Natural-diamond and lab-grown-diamond ring medians, by reporting period. Unknown exact origin/year n. Differences reflect mix as well as price; no matched-quality discount inferred. January–June 2026 is not an annual result.
| Measure / group | Published result | Actual cohort or report period | Source |
|---|---|---|---|
| 2025: natural-diamond ring | US$12,961 | 2025 appraisal records, full year | Original source [S04] Engagement Ring Sales Price: Natural Vs. Lab-Grown, yearly table |
| 2025: lab-grown-diamond ring | US$4,557 | 2025 appraisal records, full year | Original source [S04] Engagement Ring Sales Price: Natural Vs. Lab-Grown, yearly table |
| January–June 2026: natural-diamond ring | US$13,660 | January–June 2026 appraisal records only | Original source [S04] Engagement Ring Sales Price: Natural Vs. Lab-Grown, yearly table |
| January–June 2026: lab-grown-diamond ring | US$4,578 | January–June 2026 appraisal records only | Original source [S04] Engagement Ring Sales Price: Natural Vs. Lab-Grown, yearly table |
BriteCo estimates typical sales prices using recorded sales matched by year, jewelry category and diamond origin. Appraisals instead describe retail insurance replacement value. Its current index restates earlier reports, so this resource uses the current methodology consistently. The 2026 entries stop in June. BriteCo [S04].
The gap between an appraisal median and a sales-price median is not a guaranteed markup on an individual ring. These summaries cannot establish what a specific ring would resell for, and the origin-group medians do not hold all ring characteristics constant.
How common are lab-grown engagement rings?
F07 Reported lab-grown center-stone adoption and importance preference. Adoption and preference are different questions. The 61% is not a share of sales dollars, and it is not a time-series comparison with BriteCo’s appraisal audience.
| Measure / group | Published result | Actual cohort or report period | Source |
|---|---|---|---|
| Lab-grown center stones in engagement-ring purchases | 61% | 2025 US wedding cohort; ring purchases can precede the wedding; exact ring-item dates unpublished | Original source [S01] PDF printed p.6 (physical p.8), The Ring, All the Shiny Details first bullet |
| Specifically important that stone be lab-grown | 40% | 2025 US wedding cohort; ring purchases can precede the wedding; exact ring-item dates unpublished | Original source [S01] PDF printed p.6 (physical p.8), The Ring, All the Shiny Details first bullet |
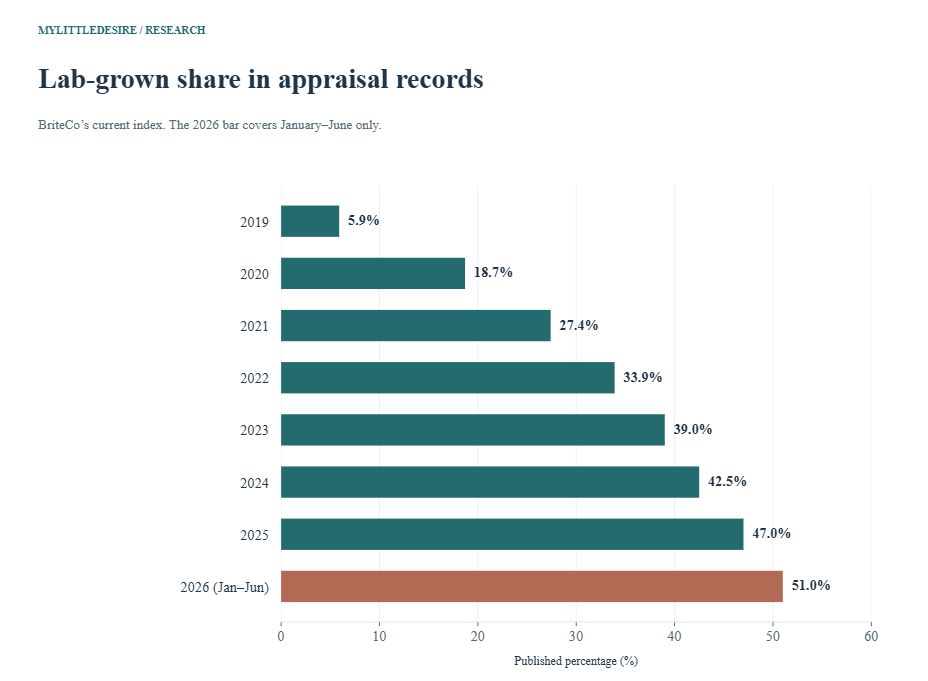
F20 Newly appraised engagement rings with a lab-grown diamond under the index definition. Platform-specific annual composition, not all US buyers or sales dollars. Exact annual n unknown. 2026 covers January–June only; no forecast adopted.
| Measure / group | Published result | Actual cohort or report period | Source |
|---|---|---|---|
| 2019 | 5.9% | 2019 appraisal records, full year | Original source [S04] Lab-Grown Share of Engagement Rings, numbers by year |
| 2020 | 18.7% | 2020 appraisal records, full year | Original source [S04] Lab-Grown Share of Engagement Rings, numbers by year |
| 2021 | 27.4% | 2021 appraisal records, full year | Original source [S04] Lab-Grown Share of Engagement Rings, numbers by year |
| 2022 | 33.9% | 2022 appraisal records, full year | Original source [S04] Lab-Grown Share of Engagement Rings, numbers by year |
| 2023 | 39.0% | 2023 appraisal records, full year | Original source [S04] Lab-Grown Share of Engagement Rings, numbers by year |
| 2024 | 42.5% | 2024 appraisal records, full year | Original source [S04] Lab-Grown Share of Engagement Rings, numbers by year |
| 2025 | 47.0% | 2025 appraisal records, full year | Original source [S04] Lab-Grown Share of Engagement Rings, numbers by year |
| 2026 January–June | 51.0% | 2026 appraisal records January–June only | Original source [S04] Lab-Grown Share of Engagement Rings, numbers by year |
The Knot’s 61% wedding-cohort survey result and BriteCo’s 51.0% first-half-2026 appraisal result use different audiences, periods and methods. They do not show a ten-point decline. The later section on Chime measures hypothetical consideration, which is a third kind of evidence.
When do people research and buy the ring?
F03 Three separately worded timing measures tied to the proposal. Different stages and eligible groups; not a duration distribution or three mutually exclusive shopper groups. Exact item n unavailable.
| Measure / group | Published result | Actual cohort or report period | Source |
|---|---|---|---|
| Proposers starting ring search more than six months ahead | 57% | 2025 US wedding cohort; ring purchases can precede the wedding; exact ring-item dates unpublished | Original source [S01] PDF printed p.6 (physical p.8), The Ring, Ring Shopping bullets 1–2 |
| Selection/purchase process taking four months or less | 77% | 2025 US wedding cohort; ring purchases can precede the wedding; exact ring-item dates unpublished | Original source [S01] PDF printed p.6 (physical p.8), The Ring, Ring Shopping bullets 1–2 |
| Ring purchased within two months of proposing | 63% | 2025 US wedding cohort; ring purchases can precede the wedding; exact ring-item dates unpublished | Original source [S01] PDF printed p.6 (physical p.8), The Ring, Ring Shopping bullets 1–2 |
Starting a search, selecting a ring and making a purchase are different stages. Their timing percentages should not be added or treated as one duration distribution. For the wider proposal context, see our engagement proposal statistics.
How involved is the recipient in choosing the ring?
F04 Any recipient participation versus selection with no recipient input. Any input is broader than a shared final decision. Exact recipient/ring base unknown; not directly comparable with Jewelers Mutual’s purchaser question.
| Measure / group | Published result | Actual cohort or report period | Source |
|---|---|---|---|
| Recipient participated in selection | 79% | 2025 US wedding cohort; ring purchases can precede the wedding; exact ring-item dates unpublished | Original source [S01] PDF printed p.6 (physical p.8), The Ring, Ring Shopping bullet 3 |
| No recipient input | 21% | 2025 US wedding cohort; ring purchases can precede the wedding; exact ring-item dates unpublished | Original source [S01] PDF printed p.6 (physical p.8), The Ring, Ring Shopping bullet 3 |
F16 Purchasers reporting the final decision was made jointly. Exact purchaser subgroup n unavailable. Narrower than any recipient participation in The Knot’s question.
| Measure / group | Published result | Actual cohort or report period | Source |
|---|---|---|---|
| Purchasers: shared final ring decision | 22% | May 2026 survey; rings purchased/received in prior five years; selected 2024 comparator separately labelled | Original source [S02] The ring quest, shared ring-shopping paragraph |
Any input can include discussing a style or giving a preference. A shared final decision is a narrower action. That difference helps explain why the two publishers’ percentages should not be used as interchangeable measures of joint shopping.
Which ring shapes and designs are reported?
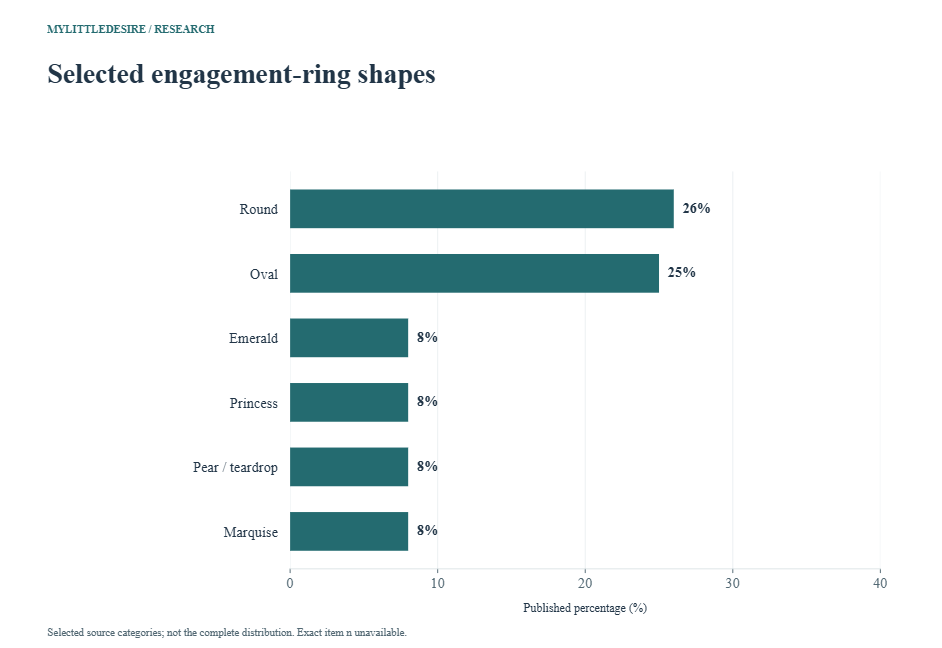
F08 Six named shape percentages from the ring page. Selected categories do not cover every possible shape. No other-shape observation reconstructed. Exact answering n unknown.
| Measure / group | Published result | Actual cohort or report period | Source |
|---|---|---|---|
| Round | 26% | 2025 US wedding cohort; ring purchases can precede the wedding; exact ring-item dates unpublished | Original source [S01] PDF printed p.6 (physical p.8), The Ring, shape paragraph |
| Oval | 25% | 2025 US wedding cohort; ring purchases can precede the wedding; exact ring-item dates unpublished | Original source [S01] PDF printed p.6 (physical p.8), The Ring, shape paragraph |
| Emerald | 8% | 2025 US wedding cohort; ring purchases can precede the wedding; exact ring-item dates unpublished | Original source [S01] PDF printed p.6 (physical p.8), The Ring, shape paragraph |
| Princess | 8% | 2025 US wedding cohort; ring purchases can precede the wedding; exact ring-item dates unpublished | Original source [S01] PDF printed p.6 (physical p.8), The Ring, shape paragraph |
| Pear / teardrop | 8% | 2025 US wedding cohort; ring purchases can precede the wedding; exact ring-item dates unpublished | Original source [S01] PDF printed p.6 (physical p.8), The Ring, shape paragraph |
| Marquise | 8% | 2025 US wedding cohort; ring purchases can precede the wedding; exact ring-item dates unpublished | Original source [S01] PDF printed p.6 (physical p.8), The Ring, shape paragraph |
F06 Separate published customization, center-stone, setting and metal measures. These categories describe different dimensions and can overlap. Exact bases unavailable; not a complete market-share partition.
| Measure / group | Published result | Actual cohort or report period | Source |
|---|---|---|---|
| Custom edits or fully custom design | 88% | 2025 US wedding cohort; ring purchases can precede the wedding; exact ring-item dates unpublished | Original source [S01] PDF printed p.6 (physical p.8), The Ring, Jewelry at a Glance / metal paragraph |
| Clear diamond | 83% | 2025 US wedding cohort; ring purchases can precede the wedding; exact ring-item dates unpublished | Original source [S01] PDF printed p.6 (physical p.8), The Ring, Jewelry at a Glance / metal paragraph |
| Solitaire setting, overall | 38% | 2025 US wedding cohort; ring purchases can precede the wedding; exact ring-item dates unpublished | Original source [S01] PDF printed p.6 (physical p.8), The Ring, Jewelry at a Glance / metal paragraph |
| Yellow gold | 39% | 2025 US wedding cohort; ring purchases can precede the wedding; exact ring-item dates unpublished | Original source [S01] PDF printed p.6 (physical p.8), The Ring, Jewelry at a Glance / metal paragraph |
F09 Source-labelled origin-panel solitaire percentages. Different subgroups from the overall 38% figure; exact bases and alignment unavailable. No weighted reconstruction of the overall result.
| Measure / group | Published result | Actual cohort or report period | Source |
|---|---|---|---|
| Natural-stone group: solitaire | 41% | 2025 US wedding cohort; ring purchases can precede the wedding; exact ring-item dates unpublished | Original source [S01] PDF printed p.6 (physical p.8), The Ring, natural versus lab-grown panel |
| Lab-grown-stone group: solitaire | 40% | 2025 US wedding cohort; ring purchases can precede the wedding; exact ring-item dates unpublished | Original source [S01] PDF printed p.6 (physical p.8), The Ring, natural versus lab-grown panel |
F12 Current survey figure with source’s historical 2024 comparator. May 2026 sample covers prior-five-year rings, not only 2026 purchases. Exact 2024 cohort/question base unpublished.
| Measure / group | Published result | Actual cohort or report period | Source |
|---|---|---|---|
| 2026 survey: white gold | 43% | May 2026 survey; eligible rings purchased/received in prior five years | Original source [S02] Popular engagement ring styles section |
| Published 2024 comparator: white gold | 35% | 2024 historical comparator; original item dates/n unavailable | Original source [S02] Popular engagement ring styles section |
F13 Current setting figure and historical 2024 comparator. Different annual survey audiences; exact eligible bases unavailable. Not directly comparable with The Knot’s overall 38%.
| Measure / group | Published result | Actual cohort or report period | Source |
|---|---|---|---|
| 2026 survey: solitaire | 37% | May 2026 survey; prior-five-year ring eligibility | Original source [S03] Design still wins over price paragraph |
| Published 2024 comparator: solitaire | 22% | 2024 historical comparator; exact original dates/n unavailable | Original source [S03] Design still wins over price paragraph |
Customization, stone choice, setting and metal are separate design dimensions. A ring can satisfy several descriptions at once. The Knot’s overall solitaire percentage and its two origin-group summaries are preserved separately because their exact bases and alignment are not supplied. No weighted overall figure is reconstructed.
What do the published carat figures mean?
F02 Overall average and carat values in the stone-origin panel. Exact bases and center-only versus total weight not specified on the panel. Retain reported scope; do not compare directly with center-stone medians or call carat a dimension.
| Measure / group | Published result | Actual cohort or report period | Source |
|---|---|---|---|
| Overall average carat weight | 1.9 ct | 2025 US wedding cohort; ring purchases can precede the wedding; exact ring-item dates unpublished | Original source [S01] PDF printed p.6 (physical p.8), The Ring, carat labels |
| Natural-stone group carat figure | 1.6 ct | 2025 US wedding cohort; ring purchases can precede the wedding; exact ring-item dates unpublished | Original source [S01] PDF printed p.6 (physical p.8), The Ring, carat labels |
| Lab-grown-stone group carat figure | 2.0 ct | 2025 US wedding cohort; ring purchases can precede the wedding; exact ring-item dates unpublished | Original source [S01] PDF printed p.6 (physical p.8), The Ring, carat labels |
The selected panel labels an average carat weight and gives carat values for two stone groups, but does not explicitly resolve center-only versus total weight. Those figures remain source-labelled weights. They are not turned into physical dimensions or directly compared with center-stone medians from another dataset.
What influences ring style?
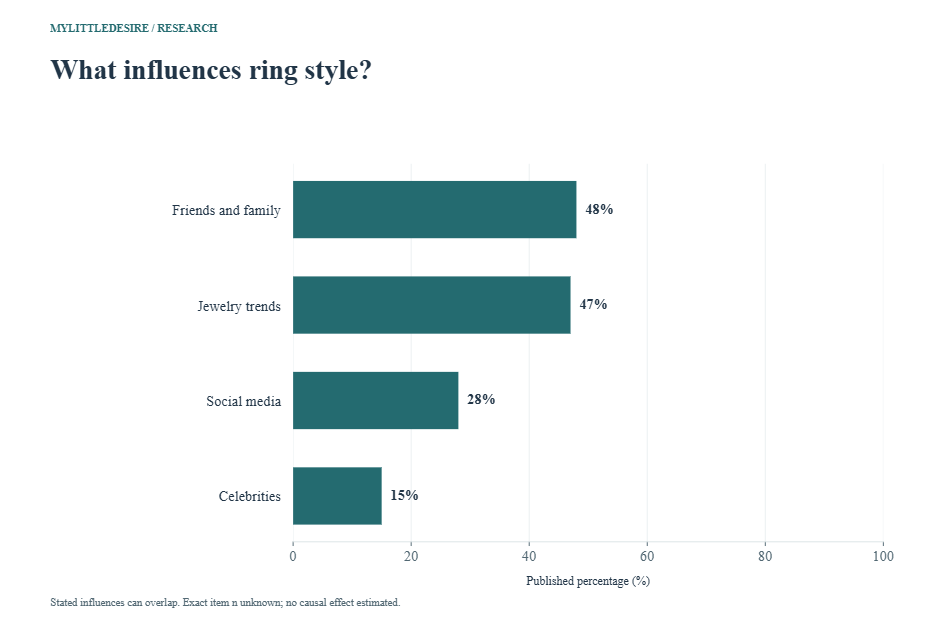
F14 Four published influence percentages. Influences can overlap; no complete exclusive split or causal social-media effect inferred. Exact item base and instrument not released.
| Measure / group | Published result | Actual cohort or report period | Source |
|---|---|---|---|
| Friends and family | 48% | May 2026 survey; rings purchased/received in prior five years; selected 2024 comparator separately labelled | Original source [S02] How do I research engagement ring styles? |
| Jewelry trends | 47% | May 2026 survey; rings purchased/received in prior five years; selected 2024 comparator separately labelled | Original source [S02] How do I research engagement ring styles? |
| Social media | 28% | May 2026 survey; rings purchased/received in prior five years; selected 2024 comparator separately labelled | Original source [S02] How do I research engagement ring styles? |
| Celebrities | 15% | May 2026 survey; rings purchased/received in prior five years; selected 2024 comparator separately labelled | Original source [S02] How do I research engagement ring styles? |
Where do people buy engagement rings?
F05 Reported mean retailer/ring counts and in-person purchase percentage. Means refer to in-person visits/views; exact item bases unknown. The source’s one-third online wording is not converted into a precise 33% or inferred as the complement of 64%.
| Measure / group | Published result | Actual cohort or report period | Source |
|---|---|---|---|
| Mean retailers visited in person | 2 retailers | 2025 US wedding cohort; ring purchases can precede the wedding; exact ring-item dates unpublished | Original source [S01] PDF printed p.6 (physical p.8), The Ring, Ring Shopping bullets 4–5 |
| Mean rings viewed in person | 10 rings | 2025 US wedding cohort; ring purchases can precede the wedding; exact ring-item dates unpublished | Original source [S01] PDF printed p.6 (physical p.8), The Ring, Ring Shopping bullets 4–5 |
| Purchased in person | 64% | 2025 US wedding cohort; ring purchases can precede the wedding; exact ring-item dates unpublished | Original source [S01] PDF printed p.6 (physical p.8), The Ring, Ring Shopping bullets 4–5 |
F15 Three source-defined categories where respondents bought rings. Not the full distribution; jewelry brand store, retail store and local business retain publisher labels. No inferred online channel or missing-category share.
| Measure / group | Published result | Actual cohort or report period | Source |
|---|---|---|---|
| Jewelry brand store | 43% | May 2026 survey; rings purchased/received in prior five years; selected 2024 comparator separately labelled | Original source [S02] The ring quest: where do people buy? |
| Retail store | 28% | May 2026 survey; rings purchased/received in prior five years; selected 2024 comparator separately labelled | Original source [S02] The ring quest: where do people buy? |
| Local business | 10% | May 2026 survey; rings purchased/received in prior five years; selected 2024 comparator separately labelled | Original source [S02] The ring quest: where do people buy? |
An in-person purchase measure and a store-category measure are different. Jewelers Mutual’s jewelry brand store, retail store and local business labels do not identify an online/offline split. The Knot’s approximate one-third online wording is not converted into a new exact percentage.
How do design and affordability affect stated priorities?
F10 Respondents saying purchase was not financially stressful. Retrospective selected sample and unknown exact item n. Do not infer a complementary stressed share or a causal effect of setting a particular budget.
| Measure / group | Published result | Actual cohort or report period | Source |
|---|---|---|---|
| Purchase was not financially stressful | 47% | May 2026 survey; rings purchased/received in prior five years; selected 2024 comparator separately labelled | Original source [S02] Average cost section, financial-stress paragraph |
F11 Two separate questions about selection and the ring’s place among possessions. Unknown exact item bases. Design priority is not willingness to pay a premium; ownership ranking is not an appraisal.
| Measure / group | Published result | Actual cohort or report period | Source |
|---|---|---|---|
| Design / uniqueness as top selection factor | 52% | May 2026 survey; prior-five-year purchase/receipt eligibility; selected 2024 setting comparator | Original source [S03] Design still wins over price; financial-exposure paragraph |
| Ring among three most expensive possessions | 62% | May 2026 survey; prior-five-year purchase/receipt eligibility; selected 2024 setting comparator | Original source [S03] Design still wins over price; financial-exposure paragraph |
F23 Preference for starting married life without debt over heavy ring spending. Selected relationship-status sample, not all US adults. An expressed preference, not observed debt or a record of reduced ring spending. Exact item n unavailable.
| Measure / group | Published result | Actual cohort or report period | Source |
|---|---|---|---|
| Prefer debt-free married life to heavy ring spending | 74% | 2026 publication; exact survey fieldwork dates not disclosed on issuer page | Original source [S07] By the Numbers; debt-free priority passages |
F24 Selected top influences on ring spending. Different response options from the same published summary; not a full distribution. Exact item base unknown and no causal spending effect estimated.
| Measure / group | Published result | Actual cohort or report period | Source |
|---|---|---|---|
| Budget as top factor | 40% | 2026 publication; exact survey fieldwork dates not disclosed on issuer page | Original source [S07] How are Engagement Rings Changing? |
| Symbolic value as most important | 21% | 2026 publication; exact survey fieldwork dates not disclosed on issuer page | Original source [S07] How are Engagement Rings Changing? |
F25 Hypothetical openness to lab-grown diamonds and resale platforms. Consideration is not actual purchasing, origin market share or future conversion. Choices may overlap; exact item n unknown.
| Measure / group | Published result | Actual cohort or report period | Source |
|---|---|---|---|
| Would consider a lab-grown diamond | 23% | 2026 publication; exact survey fieldwork dates not disclosed on issuer page | Original source [S07] How are Engagement Rings Changing?, alternatives bullets |
| Would consider buying on a resale platform | 21% | 2026 publication; exact survey fieldwork dates not disclosed on issuer page | Original source [S07] How are Engagement Rings Changing?, alternatives bullets |
Chime’s commissioned survey covers US adults in serious relationships, engaged or married, with a full sample of 2,000. Its alternative-purchase figures describe consideration. They cannot be used as lab-grown or resale transaction shares. Jewelers Mutual’s May 2026 panel also has 2,000 adults, but a different eligibility frame covering rings bought or received within five years. Chime / Talker Research [S07]; Jewelers Mutual [S03].
What do Australian ring-cost and budget reports show?
F21 Engagement-ring mean printed in the annual budget panel. Nominal Australian dollars. Exact ring base, purchase dates and inclusions unpublished. Different report cohorts; not a matched price index. The 2026 growth arrow is not reconciled to the preceding report value.
| Measure / group | Published result | Actual cohort or report period | Source |
|---|---|---|---|
| 2026 report edition | A$6,842 | 2026 report edition; mixed engaged/recently married research, exact ring-item dates unavailable | Original source [S05] PDF physical/printed p.6, engagement-ring cost panel |
F22 Engagement-ring mean printed in the annual budget panel. Nominal Australian dollars. Exact ring base, purchase dates and inclusions unpublished. Different report cohorts; not a matched price index. The 2026 growth arrow is not reconciled to the preceding report value.
| Measure / group | Published result | Actual cohort or report period | Source |
|---|---|---|---|
| 2025 report edition | A$5,854 | 2025 report edition; planning/spending research for 2025 and beyond; exact ring-item dates unavailable | Original source [S06] PDF physical/printed p.6, engagement-ring cost panel |
F26 Three published views on ring cost relative to three months of salary. August 2026 wave n=1,006; exact valid question base not printed. Opinion, not observed cost or required budget. No population extrapolation or historical trend inferred.
| Measure / group | Published result | Actual cohort or report period | Source |
|---|---|---|---|
| Should cost less than three months’ salary | 69% | August 2026 Consumer Sentiment Tracker wave | Original source [S08] Main findings; Credits for wave and operation |
| Three months’ salary is appropriate | 21% | August 2026 Consumer Sentiment Tracker wave | Original source [S08] Main findings; Credits for wave and operation |
| Should cost more than three months’ salary | 10% | August 2026 Consumer Sentiment Tracker wave | Original source [S08] Main findings; Credits for wave and operation |
The two Australian report means differ by A$988. The 2026 report prints a 14.5% growth marker, but its basis is not reconciled to the preceding A$5,854 mean. We retain the published means and a descriptive dollar difference, without adopting that growth marker or calling the difference ring-price inflation.
Finder’s figures come from its August 2026 wave of 1,006 respondents, operated through Qualtrics. They describe views about a salary multiple, not evidence that buyers spent that amount. The broad tracker’s cumulative participation is not this question’s sample size. Finder [S08].
How can buyers use these findings?
Use the findings to identify questions for your own purchase: the recipient’s preferences, stone origin, the precise weight being quoted, setting and metal, and the total price for the finished ring. Compare quotations on the same specifications and check what each includes. A study average does not determine the amount that fits your circumstances.
Keep the purchase price and any appraisal as separate records. Ask how the seller describes returns, resizing and aftercare, and keep those terms with the receipt. For the wider celebration budget, see our wedding cost and budget statistics. These are practical comparison steps; the selected research does not test a universal shopping strategy or guarantee savings.
Ten reproducible descriptive comparisons
The workbook reproduces ten differences from stable observation IDs. Units/currencies and measure types must match. Calculations reuse observations; they do not add studies or establish matched-quality discounts, causal effects or inflation.
| Comparison | First | Second | Difference | Qualification |
|---|---|---|---|---|
| The Knot: natural-stone minus lab-grown-stone mean | US$7,000 | US$4,300 | +2700 USD | Separate subgroup means; exact n/mix unknown, not a matched-quality discount. |
| The Knot: round minus oval shape | 26% | 25% | +1 percentage points | Same selected shape list; unknown exact item base. |
| The Knot: recipient input minus no input | 79% | 21% | +58 percentage points | Any input differs from a shared final purchase decision. |
| Jewelers Mutual: friends/family minus social influence | 48% | 28% | +20 percentage points | Overlapping stated influences; no causal effect. |
| Jewelers Mutual: brand store minus retail store | 43% | 28% | +15 percentage points | Source-defined store categories, not online/offline channels. |
| Jewelers Mutual white gold: 2026 minus 2024 comparator | 43% | 35% | +8 percentage points | Retrospective annual cohorts; exact 2024 base unavailable. |
| Jewelers Mutual solitaire: 2026 minus 2024 comparator | 37% | 22% | +15 percentage points | Historical comparison, not a causal design trend estimate. |
| BriteCo 2025: natural minus lab-grown estimated sale median | US$12,961 | US$4,557 | +8404 USD | Modeled platform medians, not matched quality or two verified individual receipts. |
| BriteCo lab-grown share: first-half 2026 minus 2025 | 51.0% | 47.0% | +4 percentage points | Partial-year versus full-year composition; no whole-year 2026 outcome. |
| Australia ring mean: 2026 report minus 2025 report | A$6,842 | A$5,854 | +988 AUD | Report means with unknown matching bases. Printed growth arrow not reconciled; not inflation. |
Common questions
Why is BriteCo’s US$6,939 different from The Knot’s US$4,600?
BriteCo reports an estimated sales-price median from selected appraisal records. The Knot reports a survey mean for a wedding cohort. Sample, method, timing and summary statistic all differ.
Does a replacement appraisal tell me what I could sell the ring for?
No. Replacement appraisal, purchase price and resale proceeds are different concepts. These tables establish no guaranteed resale value or investment return.
Did lab-grown ring buying fall from 61% to 51%?
Those figures come from different publishers and eligible populations. They do not form a before-and-after series. BriteCo’s own annual appraisal series is shown separately, with 2026 limited to January–June.
Does a lab-grown versus natural price gap measure savings on the same ring?
No. The reported group means or medians can reflect different weights, designs and stone characteristics. A matched-specification comparison needs appropriate matched quotes or transaction data.
Do the carat figures describe the center stone?
The selected Knot panel does not explicitly resolve center-only versus total weight. Its source-labelled carat figures are retained without adding that definition.
Should an engagement ring cost three months of salary?
The salary-relative percentages here are opinions. They do not establish a required budget. Decide on an amount consistent with your own resources and priorities.
Are the Jewelers Mutual figures only about rings bought in 2026?
No. The May 2026 survey covers eligible adults who bought or received a ring within the previous five years. The 2024 comparisons also have their own unpublished original bases.
Does this resource supply national UK or Canadian buying rates?
No independently verified national UK or Canadian engagement-ring buying benchmark was selected. An unattributed UK guide average was screened out, and US/Australian results are not relabelled.
Research method and limitations
MyLittleDesire compiled selected original survey releases, publisher tables and reports. AI assisted retrieval, organization and drafting. No original survey, respondent-level reanalysis, independent audit of private transactions, exhaustive systematic review, pooled international estimate or causal buying experiment was conducted. Original selected PDF pages were visually checked.
The database contains 51 percentages, 15 currency values, three source-labelled carat figures and two shopping-count means, for 71 observations in 26 groups. Eight numerical records come from six publisher labels. The Knot contributes 28 observations; two Jewelers Mutual pages share one study and contribute 15; BriteCo supplies 18; Easy Weddings supplies two annual means; Chime five attitudes/intentions; and Finder three opinions. This concentration remains visible.
- Unknown bases: full study totals and broad database counts are not substituted for exact item/subgroup n. Unknown exact eligible bases stay blank in the data and workbook.
- Timing: wedding year, purchase year, retrospective eligibility, report edition and half-year appraisal windows remain distinct. No 2027 forecast is counted as an observation.
- Value: survey means, modeled sale medians and replacement appraisals are different. Currencies remain original, without exchange conversion.
- Selection: commercial members, insurance-decision-makers, commissioned relationship audiences and appraisal records are not interchangeable national samples.
- Exclusions: inconsistent ring-holding summaries, ambiguous research-timeline bases, unexplained growth markers, old BriteCo methods, resale claims and unrelated jewelry/watch metrics are not used to pad evidence.
Original sources and supporting records
- S01. The Knot / The Knot Worldwide. The Knot Real Weddings Study 2026, The Ring. Released 2026-02-18. Actual period: 2025 US wedding cohort; ring purchases can precede the wedding; exact ring-item dates unpublished. Main n=10,474 couples, plus ad hoc engaged/newlywed research. Exact ring-item, proposer, recipient and stone-origin subgroup bases not supplied. Method: Main survey emailed members during 2025 whose weddings occurred January–December 2025; report also incorporates ad hoc research. Ring page printed p.6, physical PDF p.8 visually checked; methods printed p.2. Commercial membership audience, not all US purchases. Wedding year is not necessarily ring-purchase year. Means differ from medians. Natural-stone versus lab-grown-stone subgroup labels retained. Carat panel does not explicitly settle center-only versus total weight; keep its original scope rather than relabeling. Supporting records: record 1, record 2.
- S02. Jewelers Mutual. Engagement ring buying trends 2026: Jewelers Mutual study. Exact guide publication day not displayed in checked text. Actual period: May 2026 survey; rings purchased/received in prior five years; selected 2024 comparator separately labelled. Full 2026 sample n=2,000 from companion release. Exact purchaser/item bases and original 2024 comparison sample unavailable. Method: Online research panel, self-completion, May 2026, per original companion newsroom methods. Selected guide results: purchase stress, white-gold choice, style influences, store categories and joint final decisions. Retrospective insurance-decision-maker sample, not only 2026 buyers or all US adults. Store categories are source-defined and incomplete; no online/offline split inferred. The 2024 metal comparator is historical, with exact original base unknown. Ambiguous research-timeline items and inconsistent ring-holding summaries excluded. Supporting records: record 1.
- S03. Jewelers Mutual. Study Finds Mutual Engagement Ring-Wearing on the Rise, Insurance Lagging. Publication: 2026-10-08. Actual period: May 2026 survey; prior-five-year purchase/receipt eligibility; selected 2024 setting comparator. Full n=2,000; exact design, ownership-ranking, setting and 2024 comparator bases unpublished. Method: Original issuer release states online panel/self-completion and May 2026 fieldwork. Selected design-priority, ownership-value ranking and solitaire percentages checked. Overlaps S02. Design priority, ownership ranking and setting choice are separate questions. Original 2024 setting base not supplied. No causal claim about why buyers changed designs or whether a budget strategy reduces stress. Supporting records: record 1.
- S04. BriteCo. Jewelry, Diamond, & Watch Price Index 2026. Current restated web edition checked 2026-11-03. Actual period: Appraisals January 2019–June 2026; 2026 values cover January–June only. Publisher describes a large multi-category appraisal database, but exact engagement-ring, year and origin counts and model uncertainty are not provided. Overall jewelry totals are not ring n. Method: Anonymized appraisal records. Sales price is estimated from actual recorded sales matched by year, jewelry category and diamond origin. Appraised value is retail insurance replacement value. Current page restates earlier methodology and supersedes previous report figures. Selected appraisal-platform records, not a nationally weighted transaction census or audited receipt for every record. Sale estimates and appraisals are different measures; neither is resale value. Partial 2026 is not a full year. Lab-grown share refers to newly appraised rings. Unknown bases and changing composition limit generalization; no forecasts used. Supporting records: record 1, record 2.
- S05. Easy Weddings. 2026 Australian Wedding Industry Report. Exact PDF release day not specified. Actual period: 2026 report edition; mixed engaged/recently married research, exact ring-item dates unavailable. Foreword gives more than 4,200 couples plus 540 businesses, marketplace/community inputs. Exact ring-cost answering n and ring inclusions unknown. Method: Original PDF foreword p.2 and physical/printed cost page p.6 checked visually for engagement-ring average A$6,842. Report edition, not a completed-year census. Exact paying-user base, stone mix and dates unknown. Printed 14.5% growth marker is not reconciled to preceding report mean A$5,854; no claimed source growth or inflation rate adopted.
- S06. Easy Weddings. 2025 Australian Wedding Industry Report. Exact PDF release day unavailable. Actual period: 2027 report edition; planning/spending research for 2025 and beyond; exact ring-item dates unavailable. Foreword reports more than 4,000 couples plus 800 businesses and other inputs. Exact ring-cost base and ring basket not published. Method: Original foreword p.2 and physical/printed p.6 engagement-ring mean A$5,854 visually checked. Nominal Australian-dollar report mean, not a matched transaction series or cost recommendation. Bases and ring mix not harmonized with 2026. No exchange conversion or ring-price inflation inferred.
- S07. Chime / Talker Research. The Rise of the Goal-Setting Engagement. Actual period: 2026 publication; exact survey fieldwork dates not disclosed on issuer page. Full survey n=2,000; exact item bases and full questionnaire not published in checked issuer release. Method: Talker Research survey commissioned by Chime. Original release states audience and total n. Selected affordability priority, ring-spend drivers and hypothetical alternative-purchase openness read directly. Commercially commissioned selected relationship audience, not every US adult. Preferences and willingness are not actual purchases, financing behavior or diamond market shares. Recruitment, weighting and dates not detailed; no Chime product claims adopted.
- S08. Finder. The price of proposing: Australians slam outdated engagement ring rule. Actual period: August 2026 Consumer Sentiment Tracker wave. Cited wave n=1,006. Exact per-question valid base and full questionnaire not printed; cumulative tracker total is not this question’s n. Method: Original commissioning publisher release; Consumer Sentiment Tracker, operated through Qualtrics, described as nationally representative. Three salary-relative spending-opinion percentages read directly. Opinions about what a ring should cost, not observed purchases or a salary rule to follow. Sampling/weighting details and item base not fully supplied. Population extrapolation and historical trend language excluded.
Supporting records without additional observations
- R01. BriteCo. US Jewelry Research & Data Methodology. General appraisal-database and survey methods. Describes de-identified appraisal data and a broad retail-jeweler network. General jewelry database/network counts are not eligible engagement-ring sample sizes; current index’s specific 2019–June 2026 window retained.
- R02. BriteCo. Price Index announcement. Clarifies newly appraised rings, January–June 2026 and estimated sales versus replacement appraisal. No repeated numeric observations counted; forecasts, general jewelry-metal shares and non-ring categories excluded.
- R03. Jewelers Mutual. Jewelry Trend Insights and Research. Cross-check of reported 2026 study summaries. Ring-holding headline says one in four/over a quarter, whereas newsroom release says 41% for more than one month. Ambiguous inconsistent ring-holding result withheld. Early-research percentages also withheld because eligible groups/timing differ across passages.
- R04. Bridebook. How Much Does an Engagement Ring Cost? The Average Couples Spend in 2026. Original publisher guide screened for a UK benchmark. Cost guide does not identify the underlying ring-cost survey cohort or eligible sample beside its average. UK average excluded from numerical observations. Update date is not assigned as survey fieldwork; no UK or Canadian national buying rate substituted.
How to cite this resource
MyLittleDesire. Engagement Ring Buying Statistics 2027. https://mylittledesire.com/engagement-ring-buying-statistics/.