
Among US married or cohabiting parents in different-sex couples where both work full time, 52% said the mother does more day-to-day parenting, while 39% reported sharing about equally in Pew’s March 2026 survey. The figures describe perceived responsibility. Time diaries answer another question: BLS estimates how long parents spend on childcare as their main activity, while Australian and Canadian sources use different activity definitions and denominators. Pew Research Center [S01]; US Bureau of Labor Statistics [S02]; Australian Bureau of Statistics [S03]; Statistics Canada [S04].
This resource collects 73 published numerical observations in 21 groups, four charts and ten reproducible comparisons from five original numerical source records and five publishers. The observations include 53 percentages, eight decimal-hour estimates and twelve minute estimates. Repeated tasks and respondent groups are not independent studies. Each result retains its actual period, eligible audience and measure.
52%
55% / 36%
Reported that the mother does more day-to-day parenting.Pew, March 2026; different-sex couples with both parents working full time. Pew Research Center [S01]
Fathers / mothers extremely or very satisfied with parenting-task division.Same restricted Pew audience; task-specific satisfaction. Pew Research Center [S01]
2.53 / 1.66
449 / 302
Decimal hours of primary childcare per day for mothers / fathers.BLS 2025; parents with a child under 6, population means. US Bureau of Labor Statistics [S02]
Minutes of unpaid work per day for female / male parent participants.ABS 2024; child under 15, participant-only broad unpaid work. Australian Bureau of Statistics [S03]
What do parenting and partnership roles statistics measure?
A household can divide responsibility, time, availability and decision-making in different ways. Saying that one parent does more does not provide an exact time share. Being satisfied with the arrangement does not establish how many hours either person works. A diary-day participation rate identifies whether an activity occurred that day, rather than who is permanently a caregiver.
| Measure | Meaning in this collection | Key boundary |
|---|---|---|
| Reported division | Who a respondent says does more, or whether work is shared about equally | Comparative responsibility, not a measured share of minutes |
| Division satisfaction | Extremely or very satisfied with a specific division of tasks | Task-specific, not overall relationship satisfaction |
| Expected time off | Who would be more likely to respond to unexpected childcare | A hypothetical report, not observed leave use |
| Population-average time | Mean over the eligible population, including diary-day nonparticipants | BLS selected estimates use this denominator |
| Participant-average time | Mean only among people who did the activity on the diary day | ABS selected durations use this denominator |
| Diary-day participation | Percentage reporting a particular activity that day | Activities can overlap; no permanent caregiver prevalence |
| Care plus child presence | Care activities and other activities with a child present | Canada’s broad measure is not primary-care-only time |
| Equal task sharing | A report about types of childcare tasks | Canada’s half-task threshold is not half of all minutes |
Who does more parenting and household work?
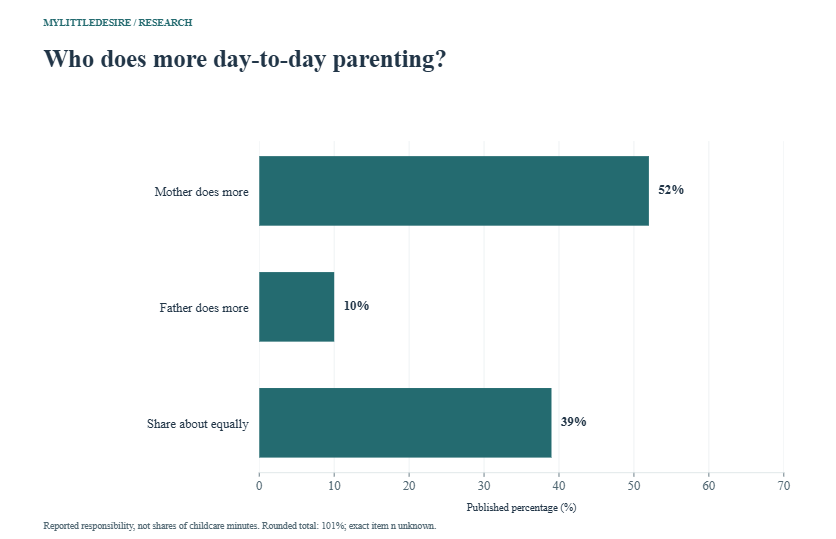
F01 Three published division-of-parenting responses in Pew’s 2026 survey. Married/cohabiting different-sex couples with both parents working full time. Exact eligible n unknown; full survey n is not this base. Rounded total 101% retained; about-equal report does not mean verified 50/50 minutes.
| Measure / response | Published result | Eligible audience and actual period | Source |
|---|---|---|---|
| Mother does more | 52% | Married/cohabiting full-time working parents with a different-sex spouse/partner who also works full time; respondent-sex subgroups where specified March 2–15, 2026 survey; exact item n unavailable | Original source [S01] Report physical p. 24 / printed p. 23, parenting-task chart |
| Father does more | 10% | Married/cohabiting full-time working parents with a different-sex spouse/partner who also works full time; respondent-sex subgroups where specified March 2–15, 2026 survey; exact item n unavailable | Original source [S01] Report physical p. 24 / printed p. 23, parenting-task chart |
| Share about equally | 39% | Married/cohabiting full-time working parents with a different-sex spouse/partner who also works full time; respondent-sex subgroups where specified March 2–15, 2026 survey; exact item n unavailable | Original source [S01] Report physical p. 24 / printed p. 23, parenting-task chart |
F02 Three published chore-division responses in the same restricted family group. Married/cohabiting different-sex couples with both parents working full time. Exact eligible n unknown; full survey n is not this base. Reported responsibility, not a diary-time share.
| Measure / response | Published result | Eligible audience and actual period | Source |
|---|---|---|---|
| Mother does more | 43% | Married/cohabiting full-time working parents with a different-sex spouse/partner who also works full time; respondent-sex subgroups where specified March 2–15, 2026 survey; exact item n unavailable | Original source [S01] Report physical p. 24 / printed p. 23, household-chore chart |
| Father does more | 17% | Married/cohabiting full-time working parents with a different-sex spouse/partner who also works full time; respondent-sex subgroups where specified March 2–15, 2026 survey; exact item n unavailable | Original source [S01] Report physical p. 24 / printed p. 23, household-chore chart |
| Share about equally | 40% | Married/cohabiting full-time working parents with a different-sex spouse/partner who also works full time; respondent-sex subgroups where specified March 2–15, 2026 survey; exact item n unavailable | Original source [S01] Report physical p. 24 / printed p. 23, household-chore chart |
Pew’s selected analysis holds one feature constant: both members of the different-sex couple work full time. That makes the comparison useful for describing this particular family arrangement. It does not remove differences in schedules, job flexibility, children’s needs or other support, and it does not represent every parent or household. The parenting responses total 101% after rounding; the source values are preserved.
Also Read:-
Wedding Cost by State Statistics 2027
Wedding Planning Stress Statistics 2027
Micro Wedding Elopement Statistics 2027
Destination Wedding Statistics 2027
AI Wedding Planning Statistics 2027
Do mothers and fathers describe the division differently?
F03 All three responses for each respondent group. Married/cohabiting different-sex couples with both parents working full time. Exact eligible n unknown; full survey n is not this base. Separate respondent groups, not two reports from the same couples. Rounding/no-answer exclusions retained.
| Measure / response | Published result | Eligible audience and actual period | Source |
|---|---|---|---|
| Mother respondents: mother does more | 63% | Mothers in Pew different-sex dual-full-time parent analysis March 2–15, 2026 survey; exact item n unavailable | Original source [S01] Report physical p. 24 / printed p. 23, respondent-group parenting rows |
| Mother respondents: father does more | 7% | Mothers in Pew different-sex dual-full-time parent analysis March 2–15, 2026 survey; exact item n unavailable | Original source [S01] Report physical p. 24 / printed p. 23, respondent-group parenting rows |
| Mother respondents: share about equally | 30% | Mothers in Pew different-sex dual-full-time parent analysis March 2–15, 2026 survey; exact item n unavailable | Original source [S01] Report physical p. 24 / printed p. 23, respondent-group parenting rows |
| Father respondents: mother does more | 41% | Fathers in Pew different-sex dual-full-time parent analysis March 2–15, 2026 survey; exact item n unavailable | Original source [S01] Report physical p. 24 / printed p. 23, respondent-group parenting rows |
| Father respondents: father does more | 13% | Fathers in Pew different-sex dual-full-time parent analysis March 2–15, 2026 survey; exact item n unavailable | Original source [S01] Report physical p. 24 / printed p. 23, respondent-group parenting rows |
| Father respondents: share about equally | 47% | Fathers in Pew different-sex dual-full-time parent analysis March 2–15, 2026 survey; exact item n unavailable | Original source [S01] Report physical p. 24 / printed p. 23, respondent-group parenting rows |
F04 All three household responses for each respondent group. Married/cohabiting different-sex couples with both parents working full time. Exact eligible n unknown; full survey n is not this base. Separate respondents, not a matched-couple agreement study.
| Measure / response | Published result | Eligible audience and actual period | Source |
|---|---|---|---|
| Mother respondents: mother does more | 63% | Mothers in Pew different-sex dual-full-time parent analysis March 2–15, 2026 survey; exact item n unavailable | Original source [S01] Report physical p. 24 / printed p. 23, respondent-group household rows |
| Mother respondents: father does more | 8% | Mothers in Pew different-sex dual-full-time parent analysis March 2–15, 2026 survey; exact item n unavailable | Original source [S01] Report physical p. 24 / printed p. 23, respondent-group household rows |
| Mother respondents: share about equally | 29% | Mothers in Pew different-sex dual-full-time parent analysis March 2–15, 2026 survey; exact item n unavailable | Original source [S01] Report physical p. 24 / printed p. 23, respondent-group household rows |
| Father respondents: mother does more | 25% | Fathers in Pew different-sex dual-full-time parent analysis March 2–15, 2026 survey; exact item n unavailable | Original source [S01] Report physical p. 24 / printed p. 23, respondent-group household rows |
| Father respondents: father does more | 25% | Fathers in Pew different-sex dual-full-time parent analysis March 2–15, 2026 survey; exact item n unavailable | Original source [S01] Report physical p. 24 / printed p. 23, respondent-group household rows |
| Father respondents: share about equally | 50% | Fathers in Pew different-sex dual-full-time parent analysis March 2–15, 2026 survey; exact item n unavailable | Original source [S01] Report physical p. 24 / printed p. 23, respondent-group household rows |
Fathers were more likely than mothers to describe parenting and chores as shared about equally. These are reports from different respondent groups. The survey does not pair the two partners from each household for this analysis, so the gap cannot identify a percentage of couples in which partners disagree. A practical conversation can distinguish visible tasks from remembering, arranging and following up, but these tables do not quantify all of that planning work.
How does paid-work time fit into family responsibilities?
F05 Three responses about a typical working day. Married/cohabiting different-sex couples with both parents working full time. Exact eligible n unknown; full survey n is not this base. Rounded total 101%; paid-work time is reported, not measured minutes or earnings.
| Measure / response | Published result | Eligible audience and actual period | Source |
|---|---|---|---|
| Father works more time | 41% | Married/cohabiting full-time working parents with a different-sex spouse/partner who also works full time; respondent-sex subgroups where specified March 2–15, 2026 survey; exact item n unavailable | Original source [S01] Report physical p. 25 / printed p. 24, paid-work paragraph |
| Mother works more time | 21% | Married/cohabiting full-time working parents with a different-sex spouse/partner who also works full time; respondent-sex subgroups where specified March 2–15, 2026 survey; exact item n unavailable | Original source [S01] Report physical p. 25 / printed p. 24, paid-work paragraph |
| Both work about equal time | 39% | Married/cohabiting full-time working parents with a different-sex spouse/partner who also works full time; respondent-sex subgroups where specified March 2–15, 2026 survey; exact item n unavailable | Original source [S01] Report physical p. 25 / printed p. 24, paid-work paragraph |
Both people working full time does not mean they report identical paid-work hours. The question asks about time spent working on a typical working day, rather than income, job intensity or control over the family budget. For related evidence on financial administration and shared decisions, see our couples’ money management statistics.
How satisfied are parents with the division of tasks?
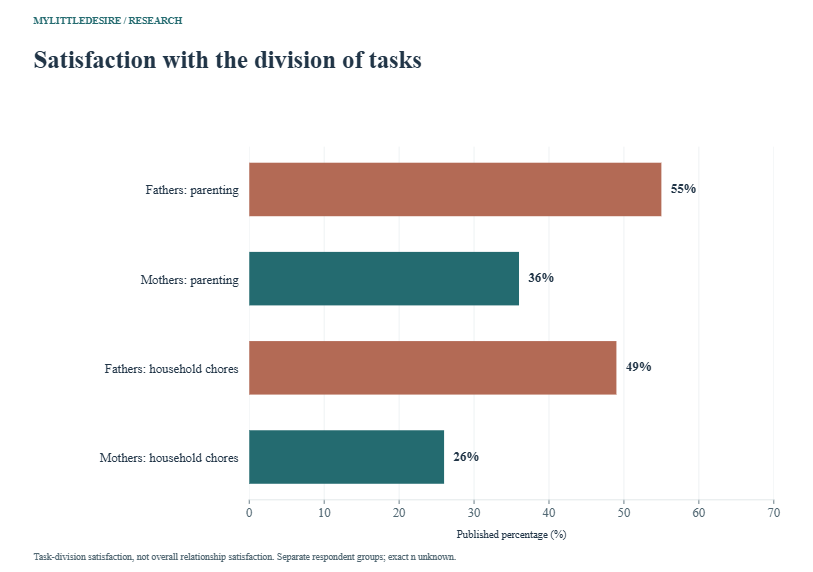
F06 Extremely or very satisfied, separately by task and respondent group. Married/cohabiting different-sex couples with both parents working full time. Exact eligible n unknown; full survey n is not this base. Satisfaction with division of tasks, not overall relationship satisfaction or a causal outcome of equal sharing.
| Measure / response | Published result | Eligible audience and actual period | Source |
|---|---|---|---|
| Fathers: parenting-task division | 55% | Fathers in Pew different-sex dual-full-time parent analysis March 2–15, 2026 survey; exact item n unavailable | Original source [S01] Report physical p. 26 / printed p. 25, satisfaction chart |
| Mothers: parenting-task division | 36% | Mothers in Pew different-sex dual-full-time parent analysis March 2–15, 2026 survey; exact item n unavailable | Original source [S01] Report physical p. 26 / printed p. 25, satisfaction chart |
| Fathers: household-chore division | 49% | Fathers in Pew different-sex dual-full-time parent analysis March 2–15, 2026 survey; exact item n unavailable | Original source [S01] Report physical p. 26 / printed p. 25, satisfaction chart |
| Mothers: household-chore division | 26% | Mothers in Pew different-sex dual-full-time parent analysis March 2–15, 2026 survey; exact item n unavailable | Original source [S01] Report physical p. 26 / printed p. 25, satisfaction chart |
The satisfaction questions are specific to how parenting tasks and household chores are divided. They do not measure overall happiness with a partner, relationship stability, or the quality of care children receive. The descriptive differences are 19 percentage points for parenting division and 23 points for household-chore division. Those calculations do not establish why the respondent groups differ.
Who expects to take time off for unexpected childcare?
F07 Hypothetical sick-child or childcare-issue question. Married/cohabiting different-sex couples with both parents working full time. Exact eligible n unknown; full survey n is not this base. Rounded total 99% retained. Likelihood report is not observed leave use or a childcare-emergency frequency.
| Measure / response | Published result | Eligible audience and actual period | Source |
|---|---|---|---|
| Mother more likely to take time off | 48% | Married/cohabiting full-time working parents with a different-sex spouse/partner who also works full time; respondent-sex subgroups where specified March 2–15, 2026 survey; exact item n unavailable | Original source [S01] Report physical p. 27 / printed p. 26, unexpected-time-off paragraph |
| Both about equally likely | 29% | Married/cohabiting full-time working parents with a different-sex spouse/partner who also works full time; respondent-sex subgroups where specified March 2–15, 2026 survey; exact item n unavailable | Original source [S01] Report physical p. 27 / printed p. 26, unexpected-time-off paragraph |
| Father more likely to take time off | 22% | Married/cohabiting full-time working parents with a different-sex spouse/partner who also works full time; respondent-sex subgroups where specified March 2–15, 2026 survey; exact item n unavailable | Original source [S01] Report physical p. 27 / printed p. 26, unexpected-time-off paragraph |
F08 Four separate items rated a major factor. Married/cohabiting different-sex couples with both parents working full time. Exact eligible n unknown; full survey n is not this base. Each factor rated independently, so percentages do not form one exclusive distribution. Broader topline figures use a different audience.
| Measure / response | Published result | Eligible audience and actual period | Source |
|---|---|---|---|
| Who has more work flexibility | 70% | Married/cohabiting full-time working parents with a different-sex spouse/partner who also works full time; respondent-sex subgroups where specified March 2–15, 2026 survey; exact item n unavailable | Original source [S01] Report physical p. 28 / printed p. 27, factor chart |
| Who is less busy that day | 41% | Married/cohabiting full-time working parents with a different-sex spouse/partner who also works full time; respondent-sex subgroups where specified March 2–15, 2026 survey; exact item n unavailable | Original source [S01] Report physical p. 28 / printed p. 27, factor chart |
| Who works fewer hours | 19% | Married/cohabiting full-time working parents with a different-sex spouse/partner who also works full time; respondent-sex subgroups where specified March 2–15, 2026 survey; exact item n unavailable | Original source [S01] Report physical p. 28 / printed p. 27, factor chart |
| Who does a better job caring for children | 16% | Married/cohabiting full-time working parents with a different-sex spouse/partner who also works full time; respondent-sex subgroups where specified March 2–15, 2026 survey; exact item n unavailable | Original source [S01] Report physical p. 28 / printed p. 27, factor chart |
Unexpected childcare creates a decision about availability as well as an additional task. Pew asks who would be more likely to take time off and which considerations would be major factors. The factor ratings are independent items: flexibility, that day’s workload, hours and perceived caregiving ability can each matter to the same respondent. They must not be added into a single distribution. These responses describe anticipated decisions rather than a diary of actual absences.
How much primary childcare time do US parents record?
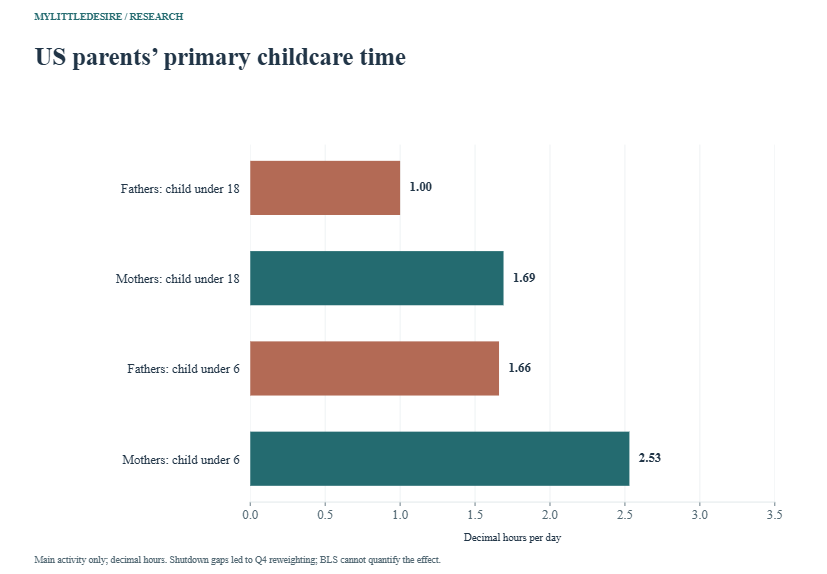
F09 Six population averages from the total care/help row, in decimal hours. Source-defined parents 15+; includes eligible parents with no primary care on diary day. Main activity only, not supervision or mental load. Parent subgroup n unknown. 2025 Q4 shutdown gaps were reweighted; impact unquantifiable.
| Measure / response | Published result | Eligible audience and actual period | Source |
|---|---|---|---|
| All parents, child under 18 | 1.36 hours/day | US parents 15+ with household child under 18 2025 annual ATUS estimates; fourth-quarter diaries reweighted after government-shutdown data gaps; exact item n unavailable | Original source [S02] Original BLS parent chart, Total caring for/helping household children row |
| Fathers, child under 18 | 1.00 hours/day | US fathers 15+ with household child under 18 2025 annual ATUS estimates; fourth-quarter diaries reweighted after government-shutdown data gaps; exact item n unavailable | Original source [S02] Original BLS parent chart, Total caring for/helping household children row |
| Mothers, child under 18 | 1.69 hours/day | US mothers 15+ with household child under 18 2025 annual ATUS estimates; fourth-quarter diaries reweighted after government-shutdown data gaps; exact item n unavailable | Original source [S02] Original BLS parent chart, Total caring for/helping household children row |
| All parents, child under 6 | 2.12 hours/day | US parents 15+ with household child under 6 2025 annual ATUS estimates; fourth-quarter diaries reweighted after government-shutdown data gaps; exact item n unavailable | Original source [S02] Original BLS parent chart, Total caring for/helping household children row |
| Fathers, child under 6 | 1.66 hours/day | US fathers 15+ with household child under 6 2025 annual ATUS estimates; fourth-quarter diaries reweighted after government-shutdown data gaps; exact item n unavailable | Original source [S02] Original BLS parent chart, Total caring for/helping household children row |
| Mothers, child under 6 | 2.53 hours/day | US mothers 15+ with household child under 6 2025 annual ATUS estimates; fourth-quarter diaries reweighted after government-shutdown data gaps; exact item n unavailable | Original source [S02] Original BLS parent chart, Total caring for/helping household children row |
The BLS chart is specifically about parents age 15 and older. Its figures average over eligible parents, including those who recorded no primary childcare on their diary day. The younger-child group is nested within the broader group, so the two groups cannot be added. A value such as 2.53 is a decimal number of hours, not 2 hours 53 minutes. The main-activity restriction also leaves out supervision occurring alongside another main activity.
2025 diary coverage: BLS reports missing diary dates from September 30 through November 11 because of the federal government shutdown. Collection resumed November 13. Remaining fourth-quarter diary days were reweighted to represent the quarter, and BLS says it cannot quantify the effect of the missing period. Preserve that qualification when citing these annual estimates. US Bureau of Labor Statistics [S02].
What do Australian parent time-use statistics show?
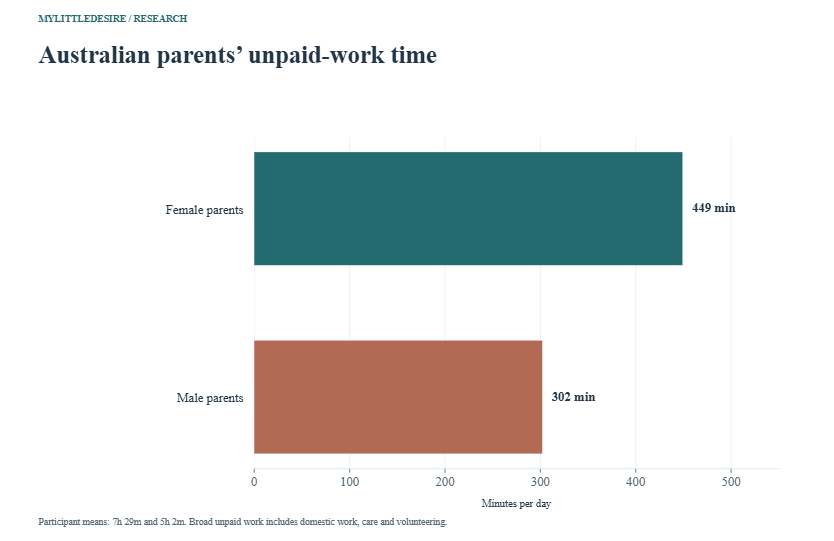
F10 Unpaid-work duration among parents with a child under 15 who participated in unpaid work. Participant-only mean, not all-parent mean. Unpaid work includes domestic work, childcare, adult care and volunteering. Different individuals, not paired-couple hours.
| Measure / response | Published result | Eligible audience and actual period | Source |
|---|---|---|---|
| Female parents | 7 hours 29 minutes/day | Parents 15+ with children under 15; sex and lone/couple-parent groups as specified, not restricted to two full-time working parents August–October 2024 Time Use Survey; exact item n unavailable | Original source [S03] Unpaid work, parent-by-sex paragraph |
| Male parents | 5 hours 2 minutes/day | Parents 15+ with children under 15; sex and lone/couple-parent groups as specified, not restricted to two full-time working parents August–October 2024 Time Use Survey; exact item n unavailable | Original source [S03] Unpaid work, parent-by-sex paragraph |
F11 Lone and couple-family parents with children under 15. Participant averages from different families; does not estimate a causal time saving from partnership or identify equal division within couples.
| Measure / response | Published result | Eligible audience and actual period | Source |
|---|---|---|---|
| Lone parents | 7 hours 4 minutes/day | Australian lone parents 15+ with child under 15 participating in unpaid work August–October 2024 Time Use Survey; exact item n unavailable | Original source [S03] Unpaid work, living-situation paragraph |
| Parents in couple families | 6 hours 16 minutes/day | Australian couple-family parents 15+ with child under 15 participating in unpaid work August–October 2024 Time Use Survey; exact item n unavailable | Original source [S03] Unpaid work, living-situation paragraph |
ABS’s unpaid-work durations include domestic work, child and adult care, and volunteering. The selected means concern parents who participated in unpaid work, so they cannot be read as averages for every parent. Lone-parent and couple-family results also describe different families; subtracting them would not estimate how much time a person saves by entering a partnership.
F12 Precise original table percentages among parents with children under 15. Diary-day participation, not permanent caregiver status or percent of all childcare done. Values retain table precision rather than duplicate rounded prose figures.
| Measure / response | Published result | Eligible audience and actual period | Source |
|---|---|---|---|
| Female parents | 88.0% | Parents 15+ with children under 15; sex and lone/couple-parent groups as specified, not restricted to two full-time working parents August–October 2024 Time Use Survey; exact item n unavailable | Original source [S03] Parents participation in looking after children by sex, All looking after children row |
| Male parents | 72.2% | Parents 15+ with children under 15; sex and lone/couple-parent groups as specified, not restricted to two full-time working parents August–October 2024 Time Use Survey; exact item n unavailable | Original source [S03] Parents participation in looking after children by sex, All looking after children row |
F13 Duration among female/male parents who reported the activity. Participant-only means. Source-defined looking after children differs from separately measured supervisory care. Do not compare directly with BLS population means or Canada child-presence totals.
| Measure / response | Published result | Eligible audience and actual period | Source |
|---|---|---|---|
| Female parents who did care | 4 hours 38 minutes/day | Australian female parents 15+ with child under 15 who looked after children on diary day August–October 2024 Time Use Survey; exact item n unavailable | Original source [S03] Looking after children, participant-duration paragraph |
| Male parents who did care | 3 hours 29 minutes/day | Australian male parents 15+ with child under 15 who looked after children on diary day August–October 2024 Time Use Survey; exact item n unavailable | Original source [S03] Looking after children, participant-duration paragraph |
F14 Four selected activity categories, each with female and male participation. Parents with children under 15; activities can overlap across a day. These are participation rates, not time shares or an exclusive division between partners.
| Measure / response | Published result | Eligible audience and actual period | Source |
|---|---|---|---|
| Personal care: female parents | 64.2% | Parents 15+ with children under 15; sex and lone/couple-parent groups as specified, not restricted to two full-time working parents August–October 2024 Time Use Survey; exact item n unavailable | Original source [S03] Parents participation in looking after children by sex, selected category rows |
| Personal care: male parents | 43.7% | Parents 15+ with children under 15; sex and lone/couple-parent groups as specified, not restricted to two full-time working parents August–October 2024 Time Use Survey; exact item n unavailable | Original source [S03] Parents participation in looking after children by sex, selected category rows |
| Child food preparation: female parents | 47.9% | Parents 15+ with children under 15; sex and lone/couple-parent groups as specified, not restricted to two full-time working parents August–October 2024 Time Use Survey; exact item n unavailable | Original source [S03] Parents participation in looking after children by sex, selected category rows |
| Child food preparation: male parents | 24.5% | Parents 15+ with children under 15; sex and lone/couple-parent groups as specified, not restricted to two full-time working parents August–October 2024 Time Use Survey; exact item n unavailable | Original source [S03] Parents participation in looking after children by sex, selected category rows |
| Talking/emotional support: female parents | 17.6% | Parents 15+ with children under 15; sex and lone/couple-parent groups as specified, not restricted to two full-time working parents August–October 2024 Time Use Survey; exact item n unavailable | Original source [S03] Parents participation in looking after children by sex, selected category rows |
| Talking/emotional support: male parents | 7.2% | Parents 15+ with children under 15; sex and lone/couple-parent groups as specified, not restricted to two full-time working parents August–October 2024 Time Use Survey; exact item n unavailable | Original source [S03] Parents participation in looking after children by sex, selected category rows |
| Playing/reading/homework: female parents | 42.5% | Parents 15+ with children under 15; sex and lone/couple-parent groups as specified, not restricted to two full-time working parents August–October 2024 Time Use Survey; exact item n unavailable | Original source [S03] Parents participation in looking after children by sex, selected category rows |
| Playing/reading/homework: male parents | 29.0% | Parents 15+ with children under 15; sex and lone/couple-parent groups as specified, not restricted to two full-time working parents August–October 2024 Time Use Survey; exact item n unavailable | Original source [S03] Parents participation in looking after children by sex, selected category rows |
Participation and duration need separate labels. A parent can do several childcare activities on one diary day, and another parent can do none of the selected activity on that particular day. The precise participation table values are retained instead of repeating rounded prose figures as extra observations. ABS warns that 2024 methodology changes reduce comparability with 2020–21; this article does not construct a trend between those editions.
How do Canadian parents report sharing childcare tasks?
F15 Mothers’ and fathers’ mean care-related and child-present time. Different-gender couples with own child 14 or under. Includes other activities when a household child is present, not just primary active childcare. Categories include some non-binary parents per source.
| Measure / response | Published result | Eligible audience and actual period | Source |
|---|---|---|---|
| Mothers, care plus child-present time | 7.5 hours/day | Parents in source-defined different-gender couples living with at least one of their children age 14 or under; physical-care questions child 0–4, homework questions child 5–14 2022 Time Use Survey, collected July 2022–July 2023; exact item n unavailable | Original source [S04] Infographic top headline and care-time footnote |
| Fathers, care plus child-present time | 4.9 hours/day | Parents in source-defined different-gender couples living with at least one of their children age 14 or under; physical-care questions child 0–4, homework questions child 5–14 2022 Time Use Survey, collected July 2022–July 2023; exact item n unavailable | Original source [S04] Infographic top headline and care-time footnote |
F16 Source summary of sharing at least half of childcare tasks equally. Different-gender couples with child 14 or under; task-type threshold, not half the minutes. Overall value is approximate. Separate respondents, not matched partner reports. Source mothers/fathers include some non-binary respondents.
| Measure / response | Published result | Eligible audience and actual period | Source |
|---|---|---|---|
| All eligible parents | About 55% | Parents in source-defined different-gender couples living with at least one of their children age 14 or under; physical-care questions child 0–4, homework questions child 5–14 2022 Time Use Survey, collected July 2022–July 2023; exact item n unavailable | Original source [S04] Infographic equal-sharing summary |
| Father respondents | 64% | Parents in source-defined different-gender couples living with at least one of their children age 14 or under; physical-care questions child 0–4, homework questions child 5–14 2022 Time Use Survey, collected July 2022–July 2023; exact item n unavailable | Original source [S04] Infographic equal-sharing summary |
| Mother respondents | 46% | Parents in source-defined different-gender couples living with at least one of their children age 14 or under; physical-care questions child 0–4, homework questions child 5–14 2022 Time Use Survey, collected July 2022–July 2023; exact item n unavailable | Original source [S04] Infographic equal-sharing summary |
Statistics Canada’s broad care-time result includes both childcare activities and other activities when a child is present. Its equal-sharing summary answers a different question about task types. The approximately 55% headline is not a verified equal split of all childcare minutes. The original survey is called the 2022 Time Use Survey, with collection running from July 2022 to July 2023.
F17 Four reports of equally shared physical-care tasks. Only eligible parents with child age 0–4 in different-gender couples. Weekday/weekend responses, not percentages of diary time or causal weekend effects. Source gender grouping retained.
| Measure / response | Published result | Eligible audience and actual period | Source |
|---|---|---|---|
| Mothers: weekdays | 28% | Mothers in Canadian different-gender couples with child age 0–4 2022 Time Use Survey, collected July 2022–July 2023; exact item n unavailable | Original source [S04] Infographic Table 1, Providing physical care row and age footnote |
| Mothers: weekends | 46% | Mothers in Canadian different-gender couples with child age 0–4 2022 Time Use Survey, collected July 2022–July 2023; exact item n unavailable | Original source [S04] Infographic Table 1, Providing physical care row and age footnote |
| Fathers: weekdays | 45% | Fathers in Canadian different-gender couples with child age 0–4 2022 Time Use Survey, collected July 2022–July 2023; exact item n unavailable | Original source [S04] Infographic Table 1, Providing physical care row and age footnote |
| Fathers: weekends | 65% | Fathers in Canadian different-gender couples with child age 0–4 2022 Time Use Survey, collected July 2022–July 2023; exact item n unavailable | Original source [S04] Infographic Table 1, Providing physical care row and age footnote |
F18 Four reports of equally shared homework help. Eligible child age 5–14, different from physical-care item audience. Different-gender couples and source gender grouping. No matched-couple agreement or diary-time share inferred.
| Measure / response | Published result | Eligible audience and actual period | Source |
|---|---|---|---|
| Mothers: weekdays | 22% | Mothers in Canadian different-gender couples with child age 5–14 2022 Time Use Survey, collected July 2022–July 2023; exact item n unavailable | Original source [S04] Infographic Table 1, Helping with homework row and age footnote |
| Mothers: weekends | 38% | Mothers in Canadian different-gender couples with child age 5–14 2022 Time Use Survey, collected July 2022–July 2023; exact item n unavailable | Original source [S04] Infographic Table 1, Helping with homework row and age footnote |
| Fathers: weekdays | 44% | Fathers in Canadian different-gender couples with child age 5–14 2022 Time Use Survey, collected July 2022–July 2023; exact item n unavailable | Original source [S04] Infographic Table 1, Helping with homework row and age footnote |
| Fathers: weekends | 52% | Fathers in Canadian different-gender couples with child age 5–14 2022 Time Use Survey, collected July 2022–July 2023; exact item n unavailable | Original source [S04] Infographic Table 1, Helping with homework row and age footnote |
The physical-care questions apply to children aged 0–4, while the homework questions apply to ages 5–14. Weekday and weekend results therefore need their age-specific audiences as well as their day labels. The source’s mother/father groups include some non-binary respondents allocated to those categories for confidentiality. That qualification is retained rather than interpreting the labels as an exhaustive description of parents’ gender identities. The original infographic is archived for reference; it remains dated historical evidence.
What do corrected historical UK time-use figures show?
F19 Historical corrected mean daily minutes for employed resident parents. March 2022 snapshot in 2022 bulletin corrected June 2023. Same-household dependent children; no restriction to two-full-time couples. All-work total includes paid work and the unpaid components; do not add it to them.
| Measure / response | Published result | Eligible audience and actual period | Source |
|---|---|---|---|
| Employed women with dependent children | 84 minutes/day | Employed women and men living with dependent children in the same household; not restricted to married couples or both-full-time families March 2022 UK Time Use Survey estimates in corrected bulletin; exact item n unavailable | Original source [S05] Corrected Main points and Section 8, Time use |
| Employed men with dependent children | 55 minutes/day | Employed women and men living with dependent children in the same household; not restricted to married couples or both-full-time families March 2022 UK Time Use Survey estimates in corrected bulletin; exact item n unavailable | Original source [S05] Corrected Main points and Section 8, Time use |
F20 Historical corrected mean daily minutes for employed resident parents. March 2022 snapshot in 2022 bulletin corrected June 2023. Same-household dependent children; no restriction to two-full-time couples. All-work total includes paid work and the unpaid components; do not add it to them.
| Measure / response | Published result | Eligible audience and actual period | Source |
|---|---|---|---|
| Employed women with dependent children | 169 minutes/day | Employed women and men living with dependent children in the same household; not restricted to married couples or both-full-time families March 2022 UK Time Use Survey estimates in corrected bulletin; exact item n unavailable | Original source [S05] Corrected Main points and Section 8, Time use |
| Employed men with dependent children | 106 minutes/day | Employed women and men living with dependent children in the same household; not restricted to married couples or both-full-time families March 2022 UK Time Use Survey estimates in corrected bulletin; exact item n unavailable | Original source [S05] Corrected Main points and Section 8, Time use |
F21 Historical corrected mean daily minutes for employed resident parents. March 2022 snapshot in 2022 bulletin corrected June 2023. Same-household dependent children; no restriction to two-full-time couples. All-work total includes paid work and the unpaid components; do not add it to them.
| Measure / response | Published result | Eligible audience and actual period | Source |
|---|---|---|---|
| Employed women with dependent children | 492 minutes/day | Employed women and men living with dependent children in the same household; not restricted to married couples or both-full-time families March 2022 UK Time Use Survey estimates in corrected bulletin; exact item n unavailable | Original source [S05] Corrected Main points and Section 8, Time use |
| Employed men with dependent children | 480 minutes/day | Employed women and men living with dependent children in the same household; not restricted to married couples or both-full-time families March 2022 UK Time Use Survey estimates in corrected bulletin; exact item n unavailable | Original source [S05] Corrected Main points and Section 8, Time use |
The ONS article title refers to 2021, but the selected time-use estimates cover March 2022. Its June 2023 correction affects the main points, time-use section and a figure. This collection uses the corrected current figures. The employed-parent population includes resident dependent children and is not restricted to couples where both adults work full time. All-work totals include paid work as well as the unpaid categories, so adding those totals to childcare or household work would double count activity. These historical estimates do not establish a current UK rate or a causal pandemic effect.
How can partners use these findings in a practical discussion?
These editorial discussion questions follow from the distinctions in the sources. They are prompts for describing a household’s arrangement, rather than interventions tested by the selected surveys. A population average does not set the right role or schedule for a particular family.
| Area | A concrete question | Distinction to preserve |
|---|---|---|
| Responsibility | Who notices, plans, completes and follows up on this task? | Reported responsibility and observed minutes answer different questions |
| Availability | Who can respond today, and what work or care constraint affects that? | Flexibility is not the same as fewer paid-work hours |
| Unexpected care | What is the backup plan when a child is ill or regular care falls through? | An intended plan can differ from what happens |
| Perceived fairness | How does each person describe the current arrangement? | Group-level perception gaps do not diagnose your household |
| Satisfaction | Which part of the division feels workable, and which needs discussion? | Task satisfaction differs from overall relationship satisfaction |
| Time records | Are we counting active care, supervision, child presence or all unpaid work? | The definition and the denominator determine what an hour total means |
Ten reproducible descriptive comparisons
Each difference below is first value minus second. Percentage differences use percentage points; time differences retain decimal hours or minutes per day. The workbook requires matching units and measure types and unique observation IDs. These are descriptive calculations from published inputs, not extra studies, statistical-significance findings or causal effects.
| Comparison | Published inputs | Difference | Interpretation |
|---|---|---|---|
| Reported parenting: mother-more minus father-more | 52% − 10% | 42 percentage points | Different response categories in one restricted audience; not a difference in minutes. |
| Reported chores: mother-more minus father-more | 43% − 17% | 26 percentage points | Same household-role question; not a diary-time share. |
| Equal parenting report: fathers minus mothers | 47% − 30% | 17 percentage points | Different respondent groups, not disagreement measured within the same couples. |
| Parenting-division satisfaction: fathers minus mothers | 55% − 36% | 19 percentage points | Extremely/very satisfied with task division; not overall relationship satisfaction. |
| Chore-division satisfaction: fathers minus mothers | 49% − 26% | 23 percentage points | Restricted dual-full-time audience; no causal effect or significance test. |
| UK unpaid childcare: employed women minus men | 84 minutes/day − 55 minutes/day | 29 minutes/day | Corrected March 2022 historical estimates, not future time use. |
| US primary care, child under 6: mothers minus fathers | 2.53 hours/day − 1.66 hours/day | 0.87 hours/day | Population means in decimal hours; primary activity only and 2025 shutdown weighting caveat. |
| Australian unpaid-work participants: female minus male parents | 449 minutes/day − 302 minutes/day | 147 minutes/day | Participant-only minutes; includes broader unpaid work, not matched-couple hours. |
| Australian care participation: female minus male parents | 88% − 72.2% | 15.8 percentage points | Diary-day participation, not permanent caregiver prevalence or share of care done. |
| Canadian task-sharing summary: fathers minus mothers | 64% − 46% | 18 percentage points | At-least-half task-type threshold; distinct respondents, not paired-partner agreement. |
Common questions
What percentage of parents share parenting equally?
In Pew’s March 2026 selected different-sex dual-full-time parent group, 39% reported sharing day-to-day parenting about equally. That is a comparative self-report for a restricted audience, not a universal rate or an exact 50/50 time split.
Do mothers and fathers agree about the division?
Pew reports different percentages from mother and father respondent groups. The selected analysis does not pair both partners in the same couples, so those results cannot measure within-couple agreement.
Does greater task satisfaction mean better relationship quality?
The selected Pew measures ask specifically about division of parenting or chores. They do not directly measure overall relationship satisfaction, relationship stability or child outcomes.
Can the time-use figures be compared across countries?
Their activity definitions, child ages, employment restrictions and denominators differ. BLS population means, ABS participant means and Canadian care-plus-presence totals do not support a direct country ranking.
Are the full survey samples the question bases?
No. The full exact samples of 2,242 for Pew, 10,613 persons for ABS and 12,336 for Canada are not the selected item or subgroup counts. Exact selected item bases are unavailable for all 73 observations and remain blank.
Do these findings cover all family types?
Coverage varies. The selected Pew and Canadian partnership analyses restrict couple type, while BLS and ABS parent measures use broader family arrangements. No universal role pattern for same-sex couples, lone parents or every other household can be inferred from a narrower group.
Research method and limitations
The collection has 73 observations in 21 groups from five original numerical source records: Pew supplies 32, BLS six, ABS sixteen, Statistics Canada thirteen and ONS six. Counts describe selected published numerical inputs, not independent samples. Charts and calculations reuse those inputs. Original reports, accessible tables, methods and question wording were checked; Pew physical pages 24–28 and the Canadian infographic were also visually inspected.
The five publishers use survey-based evidence, including probability-recruited panels and official time-use surveys. Weighting and each survey’s target population still matter. Source review checks published aggregates, not confidential respondent records. Exact item/subgroup n and weighted item bases are unavailable for the selected observations and stay blank. No raw counts were reconstructed from weighted or rounded percentages. Full samples are held separately in the source registry.
Pew sample-size discrepancy: The methodology and original topline confirm a full survey of 2,242 respondents, made up of 1,900 ATP and 342 SSRS respondents. A chapter/report sentence instead gives 2,422. This resource treats that transposition as a source typo, uses the verified methodology total and does not assign either total to the smaller selected analysis. Broader questionnaire routing counts also do not provide its exact eligible bases. Pew Research Center [S01].
Source-specific cautions include the US 2025 shutdown gap and reweighting, ABS participant-only durations and changed 2024 methods, Canada’s care-plus-presence definition and task-age restrictions, and the corrected historical UK period. The scope and methods differ too much for a pooled global care average, a country league table or a harmonized annual trend. Rounded totals are not repaired. No new survey, respondent-level reanalysis, meta-analysis or new significance test was performed.
Interpretations excluded: A measured 2027 rate; a universal gender-role norm; a causal link between workload and relationship or child outcomes; treating about equal as verified half-time; turning diary-day participation into permanent caregiver status; summing independently rated factors; using the broader Pew topline audience in the restricted analysis; or treating Canadian child-presence time as US primary-care time. No India-wide benchmark or representative same-sex-couple rate was established by this selected collection.
Original sources and supporting records
- S01. Pew Research Center. How working parents divide family responsibilities. Exact full survey n=2,242. Working parents in full survey: 1,900 ATP and 342 SSRS Opinion Panel respondents; not the selected dual-full-time different-sex item base. Selected dual-full-time different-sex item/subgroup n unavailable. Topline broader routing n=1,796 partnered parents for PARCHORES/SATCHORES and n=1,482 with employed spouse for paid-work/time-off items are not these narrower analysis bases. Method: Probability-recruited ATP Wave 188 plus SSRS Opinion Panel oversamples, weighted to US working parents; English/Spanish web and live phone. Original report charts physically checked, with chapter percentages and questionnaire routing. Methodology confirms full n=2,242; chapter has a contradictory 2,422 sentence, treated as a source typo rather than adopted. Self-reported responsibility, satisfaction and hypothetical time-off decisions; not matched responses from both partners or observed shares of minutes. Same-sex couples excluded from selected analysis for insufficient sample, not evidence about their roles. Rounded totals can be 99/101. Full-sample error margin does not describe these smaller groups. No new significance or causal claim. Supporting records: record 1, record 2, record 3.
- S02. US Bureau of Labor Statistics. Average hours per day parents spent caring for and helping household children as their main activity. Actual period: 2025 annual ATUS estimates; fourth-quarter diaries reweighted after government-shutdown data gaps. Exact full sample n not established. Approximately 6,100 individuals interviewed in full 2025 ATUS; exact full count and selected parent-group n not supplied in checked technical note. Exact valid parent/sex/age-group item n unavailable. Averages include eligible respondents who did no primary childcare on diary day. Method: Census Bureau survey for BLS; one randomly selected person 15+ from former CPS households reports previous diary day by telephone. Selected total-care row has six explicit estimates. Chart is parent-specific, unlike some news-release tables for all adults living with children. Primary/main activity only, not all supervision, copresence or mental load. Decimal hours, not hours:minutes. Published population averages differ from participant-only ABS durations. Shutdown caused missing fourth-quarter diary days; remaining diaries were reweighted, and BLS says the effect cannot be quantified. Not matched couple time or causal parenting quality. Supporting records: record 1, record 2.
- S03. Australian Bureau of Statistics. How Australians use their time, 2024. Actual period: August–October 2024 Time Use Survey. Exact full survey n=10,613. Persons providing 19,319 diary days from 6,899 households in full survey, not parent/participant subgroup n. Exact selected parent/sex/living-situation item n unavailable. Duration averages selected here are for activity participants; participation rates describe a diary day. Method: Random private-dwelling sample, online household questionnaire and normally two assigned diary days, with limited telephone collection. Original main-page durations and precise participation-table values checked. Methods define participant versus population means and main activities, with supervisory care measured separately. Do not compare participant durations directly with US all-parent averages or Canadian care-plus-presence totals. Participation is not a permanent caregiver-prevalence rate. Broad unpaid work includes domestic work, child/adult care and volunteering. Source sex categories retained. 2024 methodology changes reduce comparability with 2020–21; no trend reconstructed. Supporting records: record 1.
- S04. Statistics Canada. How do parents share child care?. Original page now archived for reference. Actual period: 2022 Time Use Survey, collected July 2022–July 2023. Exact full survey n=12,336. Respondents 15+ in full Time Use Survey; exact partnered-parent, sex, age-specific and task-answering bases unavailable. No exact valid item/subgroup n supplied in selected infographic. Full survey total comes from original StatCan methods paper, not the parent subgroup. Method: Original one-page infographic and accessible tables visually/textually checked. 2022 TUS collected by electronic questionnaire and telephone with 24-hour diary. Gender categories distribute some non-binary respondents into mothers/fathers for confidentiality, per source footnote. Care-time measure includes care activities plus other activities with a child present; not exclusively active primary childcare. Equal-sharing summary concerns at least half of task types, not half of all time. Task sharing is respondent report, not paired-partner agreement. Weekday/weekend differences not experiments. Archived status does not make it current 2027 evidence. Supporting records: record 1, record 2, record 3.
- S05. UK Office for National Statistics. Families and the labour market, UK: 2021, corrected Time use section. Time Use data corrected June 7, 2023. Actual period: March 2022 UK Time Use Survey estimates in corrected bulletin. Exact full sample n not established. Exact full March 2022 Time Use sample and selected employed-parent bases not established in selected bulletin. Exact valid sex/task item n unavailable; Labour Force Survey employment totals elsewhere in bulletin are not the time-diary base. Method: Corrected original main points and Time use section checked. Three activity definitions selected: unpaid childcare, unpaid household work, and all work combined. ONS glossary includes resident guardians/foster parents and excludes parents whose children usually live elsewhere. Historical March 2022 snapshot, not 2021 fieldwork or 2027 benchmark. All-work total includes paid work at/away from home plus childcare/household work and is not an additional category to add to its components. Original Time Use correction retained. No causal pandemic effect, equal-role norm or cross-country ranking. Supporting records: record 1.
Supporting checks, without added observations
- R01. Pew Research Center. Working parents methodology and questionnaire routing. Methodology confirms 2,242 respondents, including 1,900 ATP and 342 SSRS. Chapter/report sentence also says 2,422. Topline has broader routing counts 1,796 and 1,482. Use verified method total 2,242; do not substitute typo or wider routing counts for restricted different-sex dual-full-time analysis.
- R02. BLS;ABS;Statistics Canada. Different time-use measures and denominators. BLS parent means include nonparticipants and primary activity; ABS selected duration means use participants; Canada includes care plus child-presence time. No pooled care average, global workload ranking or subtraction across incompatible source measures. Source-specific methods linked in registry.
- R03. ONS. Original corrected UK time-use bulletin. Bulletin labels itself 2021 but selected Time Use figures cover March 2022. Notice corrects Main points, Section 8 and Figure 10. Use corrected current text, not superseded version or 2021/2027 fieldwork labels.
How to cite this resource
MyLittleDesire. Parenting & Partnership Roles Statistics 2027. https://mylittledesire.com/parenting-partnership-roles-statistics/.