
Long-distance relationships can be satisfying, difficult, stable or short-lived. Published research measures each of those experiences differently. A breakup percentage over a few months, a satisfaction score and a survey respondent’s belief about what works cannot be combined into one universal success rate.
This resource brings together 50 selected quantitative findings from 13 original publications, four research charts and reproducible comparisons. Several findings include both distance groups in one record. Sample sizes and calculations are documented separately rather than counted as extra studies.
What are the key findings?
- 47% of U.S. adults in YouGov’s May 2019 poll reported ever having had a long-distance relationship. This is lifetime experience. S01
- 34% of GB adults reported lifetime experience in a separate May 2019 YouGov poll. Different response options limit direct comparison with the U.S. poll. S02
- 51% of U.S. single adults seeking a relationship said they probably or definitely would not consider someone living far away in Pew’s 2019 survey. S13
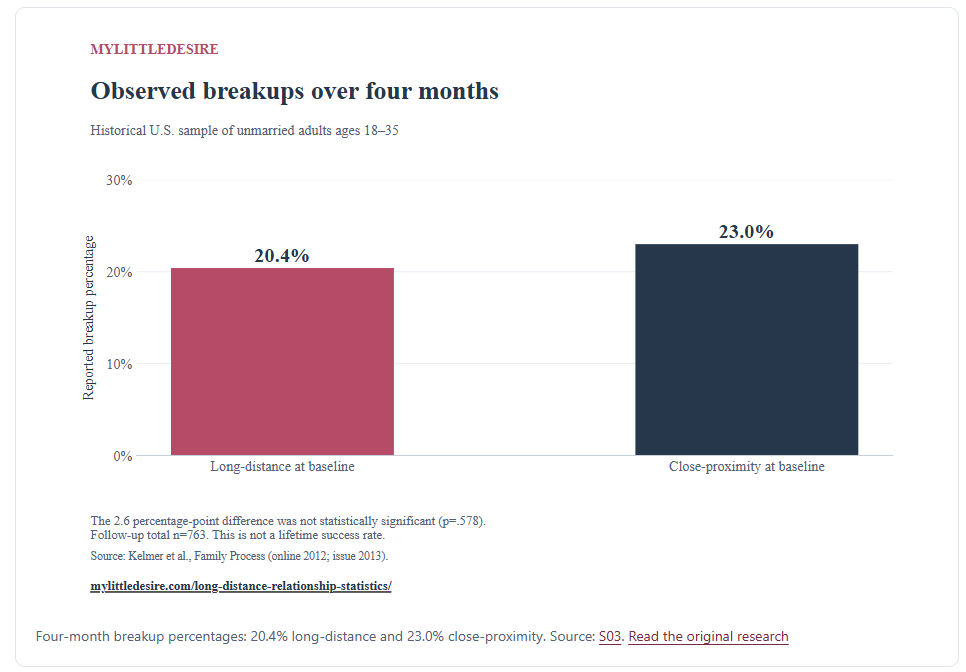
- Four-month breakups were 20.4% versus 23.0% for long-distance and close-proximity groups in Kelmer’s study. The difference was not statistically significant. S03
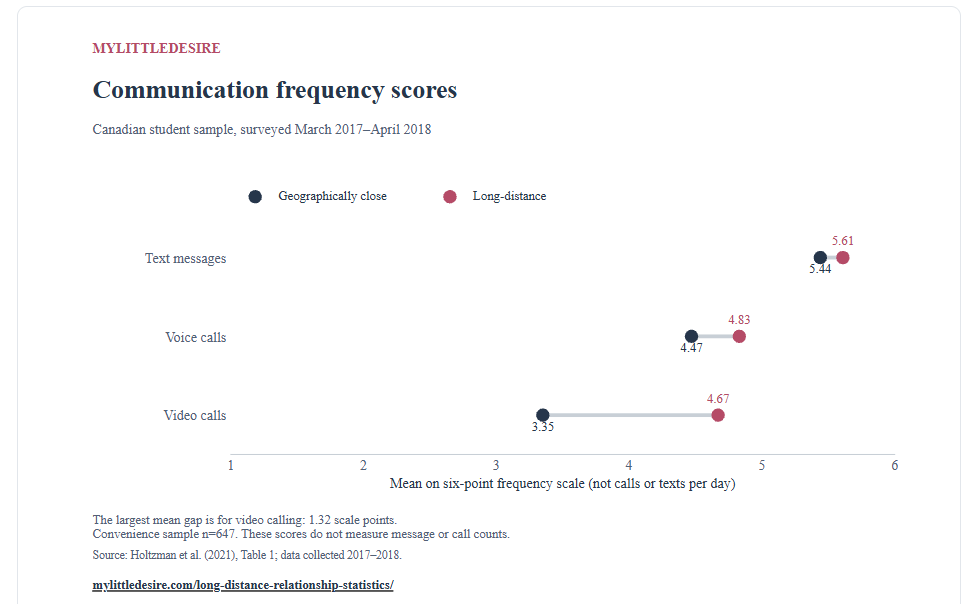
- A Canadian student study reported a 1.32-point video-frequency gap on a six-point scale. That calculation measures frequency ratings, not calls per day. S04
- 65.7% of the same study’s LDR subgroup met at most monthly, calculated by adding its less-than-monthly and monthly categories. S04
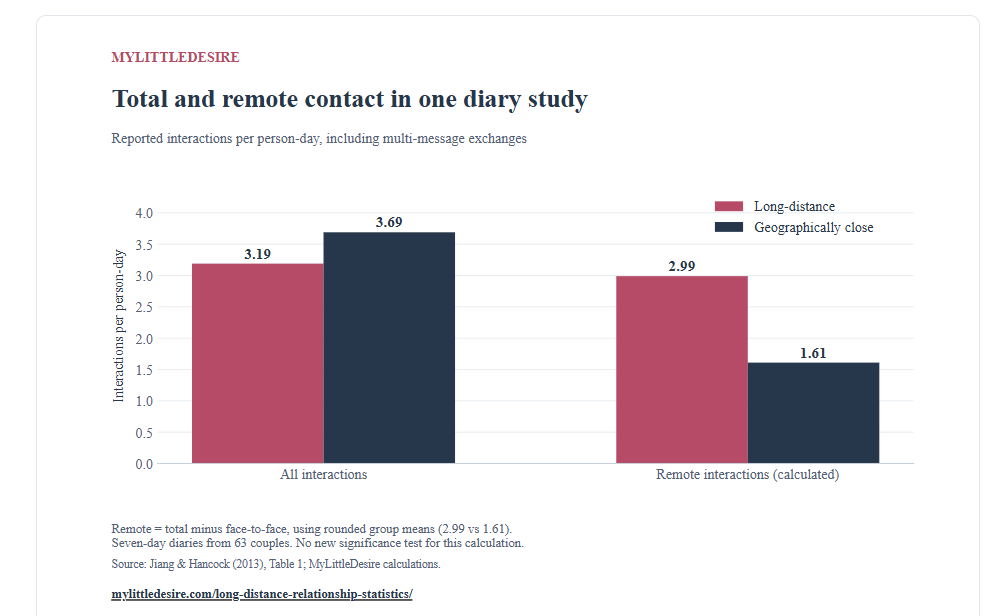
- One diary study reported 3.19 versus 3.69 total interactions per person-day for long-distance and close couples. S06
- 56.7% of 194 followed first-year students remained in their original LDR in semester two. This is a defined follow-up outcome. S11
- £168 per month was the reported travel-spending average in a commercially commissioned student survey released in 2025. Its sampling and fieldwork detail are limited. S08
- 72% in that selected student survey said their relationship had worked out and they were still together. It does not estimate a universal or lifetime success rate. S08
How common is long-distance relationship experience?
The available polls measure having ever experienced distance, using digital tools to maintain a relationship, or willingness to begin one. They do not provide a current count of all long-distance couples.
| Finding | Reported value | Population, period and source |
|---|---|---|
| LDR001U.S. adults reporting lifetime LDR experience | 47 percent | United States. 2019-05-14. S01 All-adult results |
| LDR002GB adults reporting lifetime LDR experience | 34 percent | Great Britain. 2019-05-29. S02 All-adult results |
| LDR048Recent-dating internet users who used internet/email to maintain an LDR | 24 percent | United States. 2013-04-17–2013-05-19. S12 Final LDR paragraph; footnote 15 |
| LDR049Historical estimate for digital maintenance of an LDR, as reported by Pew | 19 percent | United States. 2005; retrospective figure in 2013 publication. S12 Final LDR paragraph; retrospective 2005 comparison |
| LDR050Single relationship seekers unwilling to date someone living far away | 51 percent | United States. 2019-10-16–2019-10-28. S13 Section: long-distance relationship deal breakers |
The Pew estimates are historical. Its 2013 dating-experience group includes internet users who were single and looking or in a committed relationship of ten years or less. The older survey and newer eligibility windows require checking before making a time-trend claim. The U.S. and GB YouGov results also come from separate polls with different response options.
Are long-distance couples more likely to break up?
Results depend on the population and observation period. Kelmer and colleagues found no statistically significant difference in observed four-month breakups. A separate university follow-up records what happened between two semesters. Neither study measures lifetime success.
| Finding | Reported value | Population, period and source |
|---|---|---|
| LDR003Four-month breakups: long-distance versus close-proximity group | 20.4 vs 23 percent | United States. Collection dates not stated in accessed manuscript; baseline and approximately four-month follow-up. S03 Results p.10 |
| LDR005Relationship-adjustment mean: long-distance versus close-proximity | 16.74 vs 15.98 DAS-4 score | United States. Collection dates not stated in accessed manuscript; baseline and approximately four-month follow-up. S03 Table 2 p.9 |
| LDR006Conversation-quality mean: long-distance versus close-proximity | 6.24 vs 5.98 points on 1–7 scale | United States. Collection dates not stated in accessed manuscript; baseline and approximately four-month follow-up. S03 Table 2 p.9 |
| LDR007Dedication mean: long-distance versus close-proximity | 5.56 vs 5.2 points on 1–7 scale | United States. Collection dates not stated in accessed manuscript; baseline and approximately four-month follow-up. S03 Table 2 p.9 |
| LDR008Feeling-trapped mean: long-distance versus close-proximity | 1.77 vs 2.13 points on 1–7 scale | United States. Collection dates not stated in accessed manuscript; baseline and approximately four-month follow-up. S03 Table 2 p.9 |
| LDR009Expected-breakup likelihood: long-distance versus close-proximity | 1.78 vs 2.13 points on 1–5 scale | United States. Collection dates not stated in accessed manuscript; baseline and approximately four-month follow-up. S03 Table 2 p.9 |
| LDR045Original LDR continuing in semester two | 56.7 percent | United States. First and second college semesters; calendar fieldwork years not identified in inspected manuscript. S11 Table 1, semester-two outcomes |
| LDR046Originally LDR students single in semester two | 31.4 percent | United States. First and second college semesters; calendar fieldwork years not identified in inspected manuscript. S11 Table 1, semester-two outcomes |
| LDR047Originally LDR students with a new partner in semester two | 11.9 percent | United States. First and second college semesters; calendar fieldwork years not identified in inspected manuscript. S11 Table 1, semester-two outcomes |
Kelmer’s long-distance group was more optimistic about future stability on average. That perception was not matched by a demonstrated breakup advantage. The Canadian and diary studies below also found no significant group difference on their reported satisfaction measures. A non-significant result does not prove that every distance group is equivalent.
How far apart are partners, and how often do they interact?
The same study can show fewer interactions overall and more remote contact. Jiang and Hancock’s diaries include face-to-face contact, so remote communication and total communication answer different questions.
| Finding | Reported value | Population, period and source |
|---|---|---|
| LDR004Mean versus median distance within the long-distance group | 735.37 vs 200 miles | United States. Collection dates not stated in accessed manuscript; baseline and approximately four-month follow-up. S03 Methods p.5 |
| LDR023Mean versus median miles apart among long-distance couples | 539.17 vs 170 miles | United States. Seven-day diary; calendar collection dates not stated in inspected paper. S06 Participants, printed p.563 / PDF p.8 |
| LDR024All reported daily interactions: long-distance versus geographically close | 3.19 vs 3.69 interactions per person-day | United States. Seven-day diary; calendar collection dates not stated in inspected paper. S06 Table 1, printed p.567 / PDF p.12 |
| LDR025Phone interactions per day: long-distance versus geographically close | 1.01 vs 0.29 interactions per person-day | United States. Seven-day diary; calendar collection dates not stated in inspected paper. S06 Table 1, printed p.567 / PDF p.12 |
| LDR026Video interactions per day: long-distance versus geographically close | 0.23 vs 0.01 interactions per person-day | United States. Seven-day diary; calendar collection dates not stated in inspected paper. S06 Table 1, printed p.567 / PDF p.12 |
| LDR027Texting interactions per day: long-distance versus geographically close | 1.39 vs 1.12 interactions per person-day | United States. Seven-day diary; calendar collection dates not stated in inspected paper. S06 Table 1, printed p.567 / PDF p.12 |
| LDR028Satisfaction mean: long-distance versus geographically close | 6.09 vs 5.95 points on 1–7 scale | United States. Seven-day diary; calendar collection dates not stated in inspected paper. S06 Table 1, printed p.567 / PDF p.12 |
| LDR029Commitment mean: long-distance versus geographically close | 6.26 vs 5.78 points on 1–7 scale | United States. Seven-day diary; calendar collection dates not stated in inspected paper. S06 Table 1, printed p.567 / PDF p.12 |
Subtracting reported face-to-face means from total means gives about 2.99 remote interactions per person-day for the long-distance group and 1.61 for the close group. The calculation uses rounded published means. An interaction can contain several messages. This is MyLittleDesire’s descriptive calculation from the study’s table, with no new significance test.
The two distance distributions also show why “average miles apart” needs a definition. Kelmer’s mean was about 3.68 times its median, while Jiang’s was about 3.17 times its median. These are separate samples, not a historical trend.
What do studies show about calls, texts and satisfaction?
Frequency, responsiveness and satisfaction are different measures. In the Canadian student study, LDR participants used all three remote channels more frequently. Texting frequency and responsiveness were associated with satisfaction within the LDR group, but an observational association cannot establish that a prescribed number of texts improves a relationship.
| Finding | Reported value | Population, period and source |
|---|---|---|
| LDR010LDR students meeting their partner less than once a month | 32.6 percent | Canada. March 2017–April 2018. S04 Method, Procedure and participants |
| LDR011LDR students meeting their partner once a month | 33.1 percent | Canada. March 2017–April 2018. S04 Method, Procedure and participants |
| LDR012Video-call frequency: long-distance versus geographically close mean | 4.67 vs 3.35 points on 1–6 frequency scale | Canada. March 2017–April 2018. S04 Table 1 |
| LDR013Voice-call frequency: long-distance versus geographically close mean | 4.83 vs 4.47 points on 1–6 frequency scale | Canada. March 2017–April 2018. S04 Table 1 |
| LDR014Texting frequency: long-distance versus geographically close mean | 5.61 vs 5.44 points on 1–6 frequency scale | Canada. March 2017–April 2018. S04 Table 1 |
| LDR015Relationship-satisfaction mean: long-distance versus geographically close | 29.29 vs 29.57 RAS total, 7–35 | Canada. March 2017–April 2018. S04 Table 1 |
| LDR016LDR texting-frequency association with relationship satisfaction | 1.46 unstandardized regression slope b | Canada. March 2017–April 2018. S04 Results Aim 3, Figure 1 |
| LDR017LDR texting-responsiveness association with relationship satisfaction | 1.03 unstandardized regression slope b | Canada. March 2017–April 2018. S04 Results Aim 3, Figure 1 |
| LDR018Text-message use frequency in the international LDR sample | 6.92 points on 1–9 frequency scale | International sample: 61% U.S., 9% UK, 9% Canada, 2% Australia; remainder elsewhere. Collection dates not stated; accepted 2017-11-02. S05 Table 1, printed p.178 / PDF p.8 |
| LDR019Skype use frequency in the international LDR sample | 4.74 points on 1–9 frequency scale | International sample: 61% U.S., 9% UK, 9% Canada, 2% Australia; remainder elsewhere. Collection dates not stated; accepted 2017-11-02. S05 Table 1, printed p.178 / PDF p.8 |
| LDR020Skype-use correlation with relationship satisfaction | 0.12 Pearson correlation r | International sample: 61% U.S., 9% UK, 9% Canada, 2% Australia; remainder elsewhere. Collection dates not stated; accepted 2017-11-02. S05 Table 2, printed p.179 / PDF p.9 |
| LDR021Skype-use correlation with communication satisfaction | 0.21 Pearson correlation r | International sample: 61% U.S., 9% UK, 9% Canada, 2% Australia; remainder elsewhere. Collection dates not stated; accepted 2017-11-02. S05 Table 2, printed p.179 / PDF p.9 |
| LDR022Picture-message-use correlation with communication satisfaction | 0.14 Pearson correlation r | International sample: 61% U.S., 9% UK, 9% Canada, 2% Australia; remainder elsewhere. Collection dates not stated; accepted 2017-11-02. S05 Table 2, printed p.179 / PDF p.9 |
Hampton’s international survey used a different, nine-point frequency scale. Its platform-specific findings come from an earlier technology environment. The correlations with Skype use were small: the relationship-satisfaction correlation had a 95% interval of .04 to .20, and the communication-satisfaction interval was .13 to .29. The picture-message interval was .06 to .21. These historical associations do not establish which current app is best.
The regression slopes in the table are measured in satisfaction-score units, not percentages. Holtzman’s texting-frequency slope had SE .47 and p=.002; the responsiveness slope had SE .40 and p=.01. Its RAS totals were not significantly different by distance group in the initial model.
What do student surveys reveal about visits and travel costs?
A National Express survey release reports visits, travel spending and beliefs about staying connected among adults who had a university LDR. It is useful as a clearly labelled snapshot of a selected student experience.
| Finding | Reported value | Population, period and source |
|---|---|---|
| LDR032Average visits per month in the student LDR survey | 2.84 visits per month | UK travel-campaign context; respondent country not explicitly stated in inspected release. Fieldwork dates not disclosed in release. S08 Love-index input list |
| LDR033Average travel distance to see a partner in the student survey | 171.3 miles | UK travel-campaign context; respondent country not explicitly stated in inspected release. Fieldwork dates not disclosed in release. S08 Release travel paragraph |
| LDR034Average monthly travel spending in the student LDR survey | 168 GBP per month | UK travel-campaign context; respondent country not explicitly stated in inspected release. Fieldwork dates not disclosed in release. S08 Love-index input list; release rounds to almost £170 |
| LDR035Respondents saying cheaper travel would allow more visits | 85 percent | UK travel-campaign context; respondent country not explicitly stated in inspected release. Fieldwork dates not disclosed in release. S08 Release travel paragraph |
| LDR036Respondents reporting that their student LDR worked out and they remained together | 72 percent | UK travel-campaign context; respondent country not explicitly stated in inspected release. Fieldwork dates not disclosed in release. S08 Release relationship-outcome paragraph |
| LDR037Respondents identifying daily calls as a secret of success | 69 percent | UK travel-campaign context; respondent country not explicitly stated in inspected release. Fieldwork dates not disclosed in release. S08 Release success-factors paragraph |
| LDR038Respondents identifying temporary separation as a secret of success | 62 percent | UK travel-campaign context; respondent country not explicitly stated in inspected release. Fieldwork dates not disclosed in release. S08 Release success-factors paragraph |
| LDR039Respondents identifying frequent texting as a secret of success | 61 percent | UK travel-campaign context; respondent country not explicitly stated in inspected release. Fieldwork dates not disclosed in release. S08 Release success-factors paragraph |
The release describes 1,000 adults ages 18–30 and identifies OnePoll as the survey provider. It does not publish fieldwork dates, the questionnaire, weights or item-level bases. Although the campaign concerns UK travel and reports pounds sterling, the inspected release does not explicitly identify respondent country. The success-factor answers are respondents’ opinions. The campaign’s promotional prediction formula is not used here.
What happens when partners close the distance?
Moving near one another changes a relationship’s routines and expectations. An older university study records post-reunion endings and the experience of missing aspects of distance. Its timing claims need particular care.
| Finding | Reported value | Population, period and source |
|---|---|---|
| LDR030Reunited cases reported as ending after reunion at any measured time | 36.6 percent | United States. Retrospective survey; exact fieldwork dates not stated. S07 Results, printed p.909 / PDF p.9 |
| LDR031Selected reunion-comparison respondents missing at least one aspect of distance | 85 percent | United States. Retrospective survey; exact fieldwork dates not stated. S07 Results, printed p.911 / PDF p.11 |
| LDR040Participants with patterns contrary to typical conflict/passion changes | 19 percent, approximately | Multinational; exact country composition unavailable in public abstract. COVID-19 pandemic; exact collection dates not available in public abstract. S09 Public publisher abstract |
Stafford’s detailed results report 66 of 180 reunion cases ending after reunion, presented as 36.6%, across varying elapsed periods. The paper’s abstract and discussion describe one-third ending within three months, but its methods identify 44 early endings before missing-data exclusions. We retain the detailed all-times figure and do not present it as a clean three-month rate.
The 85% finding comes from a deliberately balanced 72-person comparison sample, not the whole university sample. The pandemic paper’s approximately 19% result covers both relationship types among people completing at least three waves. It shows variation in conflict/passion patterns, not the share of LDRs that fail. Only its public publisher abstract was accessible for numerical verification.
What does a longer panel study add?
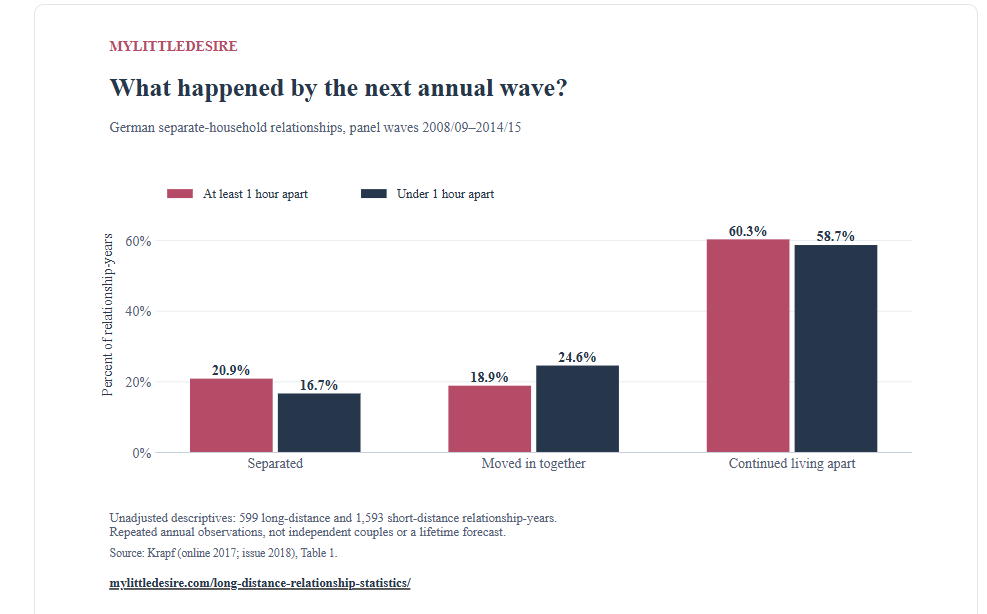
A German panel offers a useful counterpoint to short student surveys. Its unadjusted table shows more next-wave separations and fewer moves into a shared home among relationship-years spent at least one hour apart.
| Finding | Reported value | Population, period and source |
|---|---|---|
| LDR041Separated by the next wave: long-distance versus short-distance relationship-years | 20.9 vs 16.7 percent of relationship-years | Germany. German Family Panel waves 1–7, 2008/2009–2014/2015. S10 Table 1 |
| LDR042Started living together by the next wave: long-distance versus short-distance relationship-years | 18.9 vs 24.6 percent of relationship-years | Germany. German Family Panel waves 1–7, 2008/2009–2014/2015. S10 Table 1 |
| LDR043Remained in separate-household relationships at the next wave: long-distance versus short-distance relationship-years | 60.3 vs 58.7 percent of relationship-years | Germany. German Family Panel waves 1–7, 2008/2009–2014/2015. S10 Table 1 |
| LDR044Highest partnership satisfaction category at the prior wave: long-distance versus short-distance relationship-years | 20.2 vs 25.4 percent of relationship-years | Germany. German Family Panel waves 1–7, 2008/2009–2014/2015. S10 Table 1 |
These are percentages of repeated relationship-years from 1,156 relationships, not percentages of independent couples followed for a common lifetime. The highest satisfaction category means exactly 10 on a 0–10 scale. Germany is included as explicitly labelled context rather than substituted for a target-market estimate. Its different population, definition and time frame help explain why results need not match Kelmer’s four-month comparison.
Which original comparisons can publishers use?
MyLittleDesire contributes the charts, a standardized source inventory and transparent calculations from published aggregates. These are original presentation and synthesis, not new fieldwork or claims of scientific discovery. The supporting file records all 18 calculations.
| Comparison | Calculated result | Interpretation |
|---|---|---|
| Observed breakups (C01) | -2.6 percentage points | A defined short follow-up cannot answer lifetime success. |
| Monthly visits (C07) | 65.7 percent | Adjacent mutually exclusive categories can be combined within one subgroup. |
| All daily contact (C08) | -0.50 interactions per person-day | Includes in-person interactions. |
| Remote daily contact: LDR (C09) | 2.99 interactions per person-day | Calculated from the same sample, with a matched denominator. |
| Remote daily contact: close (C10) | 1.61 interactions per person-day | Calculated from the same sample, with a matched denominator. |
| Relative remote-contact difference (C12) | 85.7 percent | A descriptive synthesis of rounded means, not a causal effect. |
| Distance distribution: Kelmer (C13) | 3.68 times | An arithmetic mean is sensitive to the long-distance tail. |
| Distance distribution: Jiang (C14) | 3.17 times | A separate distribution, not a comparison over time. |
| German separation difference (C15) | 4.2 percentage points | Annual repeated observations cannot be pooled with a four-month U.S. percentage. |
| College follow-up endings (C17) | 43.3 percent | Single and new-partner outcomes together identify those no longer with the original partner. |
Calculation inputs come from S03, S04, S06, S10 and S11. Each underlying finding above links directly to its source.
Which statistics can be compared fairly?
| Measure | Example | Denominator or definition | What it cannot establish |
|---|---|---|---|
| Ever experienced an LDR | U.S./GB YouGov polls | All sampled adults, historical lifetime recall | Current prevalence, number of couples or a success rate |
| Used digital tools for an LDR | Pew 2013/2005 | Internet users with recent dating experience | The share currently living apart |
| Four-month breakup | Kelmer | Follow-up participants, classified by baseline distance over 50 miles | Lifetime failure risk |
| Annual transition | Krapf | Repeated relationship-years, with one-hour travel threshold | Independent couples or U.S. outcomes |
| Daily interaction | Jiang | Individual diary-day exchange, possibly many messages | Each text message or an app notification |
| Frequency rating | Holtzman/Hampton | Different subjective scales in different samples | Calls per day or a pooled time trend |
| Still together at survey | National Express | Selected current/former university LDR sample | A validated forecast for a new couple |
| Living apart together | LAT research | Separate households, possibly close by | Automatically a long-distance relationship |
Compare groups within a study when their units and observation periods match. Retain the researchers’ reported uncertainty. Across studies, use the differences in design to explain findings rather than calculating a pooled “success rate.” We have not calculated a precise U.S.–GB experience gap, a harmonized digital-maintenance trend, or a common-currency travel-cost comparison.
How were these statistics selected and checked?
We searched public research publications, university copies, original survey releases and research organizations’ result pages. We checked reported numbers against the original tables or results text, recorded the population and period, and excluded unsupported claim forms. No MyLittleDesire survey was conducted.
The database contains 50 selected quantitative finding records from 13 original publications. Paired distance-group results are kept together in one record. The sample sizes, two supporting face-to-face inputs and 18 calculations do not increase that finding count. No single publication contributes more than eight records. YouGov contributes two records; the commissioned National Express survey contributes eight.
“Verified” means the stated number and qualification were found in the identified original publication. It does not mean the sampling design is flawless, the result is current, or the original data were independently reanalysed. Most academic findings are historical. One result was checked only in a public abstract. Item Ns, collection dates and uncertainty are marked unavailable wherever the publication did not supply them.
Students and young unmarried adults dominate several studies. Same-sex couples, married couples, older adults, international borders, military deployments and Australia-specific outcomes are not adequately described by this source set. The international Hampton sample includes Australian participants, but it cannot establish an Australian national statistic. No current comparable national LDR count was verified for all four target markets.
We keep uncertain findings separately. In particular, a 2026 Mayflower release and its linked questionnaire describe different achieved/planned samples and eligibility windows. Those travel-cost and moving-intention values are excluded pending clarification. Widely repeated universal success rates, current couple counts, average durations and a validated “love index” are also excluded in those forms.
Reported study dates remain visible even in a 2027 edition. Calculations use published rounded aggregates and sensible displayed precision; they carry no new confidence intervals or significance tests. Publication dates are not treated as dates of data collection.
Complete original sources
- S01. YouGov. Have you ever been in a long-distance relationship?. Published 2019-05-14.
Evidence period: 2019-05-14. Daily Question: all-adult response table and sample/date header. Checked October 23, 2026. - S02. YouGov. Have you ever had a long-distance relationship?. Published 2019-05-29.
Evidence period: 2019-05-29. Daily Question: all-adult response table and sample/date header. Checked October 23, 2026. - S03. Kelmer, Rhoades, Stanley and Markman; University of Denver. Relationship Quality, Commitment, and Stability in Long-Distance Relationships. Published 2012-09-18 online; June 2013 journal issue. Accessible research copy or methodology
Evidence period: Collection dates not stated in accessed manuscript; baseline and approximately four-month follow-up. Author-uploaded manuscript, Methods pp.5–6, Table 2 p.9, Results p.10. Checked October 23, 2026. - S04. Holtzman, Kushlev, Wozny and Godard; University of British Columbia and collaborators. Long-distance texting: Text messaging is linked with higher relationship satisfaction in long-distance relationships. Published 2021-11-14 online; December 2021 issue.
Evidence period: March 2017–April 2018. Method; Table 1; Results Aim 3 and Figure 1. Checked October 23, 2026. - S05. Hampton, Rawlings, Treger and Sprecher; Purdue, Illinois State and Syracuse universities. Channels of Computer-Mediated Communication and Satisfaction in Long-Distance Relationships. Published 2018-02-23 version of record; 2017 volume. Accessible research copy or methodology
Evidence period: Collection dates not stated; accepted 2017-11-02. Published PDF pp.176–179; Tables 1 and 2. Checked October 23, 2026. - S06. L. Crystal Jiang and Jeffrey T. Hancock; Cornell University. Absence Makes the Communication Grow Fonder: Geographic Separation, Interpersonal Media, and Intimacy in Dating Relationships. Published 2013; June journal issue. Accessible research copy or methodology
Evidence period: Seven-day diary; calendar collection dates not stated in inspected paper. PDF p.8 participant description; p.12 Table 1 (printed pp.563 and 567). Checked October 23, 2026. - S07. Stafford, Merolla and Castle; Ohio State University. When long-distance dating partners become geographically close. Published 2006; December journal issue. Accessible research copy or methodology
Evidence period: Retrospective survey; exact fieldwork dates not stated. Published PDF pp.906, 909 and 911 (PDF pp.6, 9 and 11). Checked October 23, 2026. - S08. National Express, commissioned survey conducted via OnePoll. The formula to a successful long-distance relationship for students has been revealed. Published 2025-10-08.
Evidence period: Fieldwork dates not disclosed in release. Release body: travel and relationship findings; formula input list for 2.84 visits and £168 monthly. Checked October 23, 2026. - S09. DiGiovanni, Valshtein, Harris, Zoppolat, Balzarini and Slatcher. Investigating the social benefits of long-distance romantic relationships during the COVID-19 pandemic. Published 2025-09-11 first online; 2026 journal issue.
Evidence period: COVID-19 pandemic; exact collection dates not available in public abstract. Publisher abstract, final results paragraph. Checked October 23, 2026. - S10. Sandra Krapf; University of Cologne. Moving in or Breaking Up? The Role of Distance in the Development of Romantic Relationships. Published 2017-05-24 online; August 2018 issue.
Evidence period: German Family Panel waves 1–7, 2008/2009–2014/2015. Methods; Table 1; satisfaction definition in Explanatory Variables. Checked October 23, 2026. - S11. Waterman, Wesche, Leavitt, Jones and Lefkowitz; Penn State and collaborators. Long-distance dating relationships, relationship dissolution, and college adjustment. Published 2017-04-25 online; August 2017 issue.
Evidence period: First and second college semesters; calendar fieldwork years not identified in inspected manuscript. Participants and Procedure; Table 1; LDDR dissolution measures. Checked October 23, 2026. - S12. Pew Research Center. Part 3: The Broader Online Environment around Dating and Relationships. Published 2013-10-21. Accessible research copy or methodology
Evidence period: 2013 survey April 17–May 19; historical comparison refers to 2005. Chapter final LDR paragraph and footnotes 15–16; companion methodology. Checked October 23, 2026. - S13. Pew Research Center. Personal experiences and attitudes of daters. Published 2020-08-20. Accessible research copy or methodology
Evidence period: 2019-10-16–2019-10-28. Section on long-distance relationships as deal breakers; companion methodology. Checked October 23, 2026.
How should this page be cited?
Suggested citation for this synthesis:
MyLittleDesire. Long-Distance Relationship Statistics 2027: What the Research Shows. 2027 planning edition. Evidence reviewed October 23, 2026. https://mylittledesire.com/long-distance-relationship-statistics/.
When quoting an underlying survey or study, also cite its original source. When reproducing a MyLittleDesire calculation or chart, credit MyLittleDesire’s synthesis and the underlying researchers. Linking to the relevant section helps readers check the denominator and date.