Father’s Day research covers more than gifts. It includes the people we celebrate, time spent together, the work of organising the day and what fathers say they want. This resource separates those experiences from retail forecasts and shopping plans.
60 grouped findings across 11 original-source records, containing 230 numeric inputs, 20 transparent descriptive calculations and four MyLittleDesire charts. The main survey evidence concerns the US, UK and Australia. Canada is represented by a clearly limited retailer case study; a current national Canadian holiday benchmark was not independently verified.
When is Father’s Day in 2027?
Father’s Day falls on June 20 in the United States, United Kingdom and Canada, and on September 5 in Australia. The dates identify the observance; they do not establish a future spending result.
| Country | Date | Calendar rule | Calendar reference |
|---|---|---|---|
| United States | Sunday, June 20, 2027 | Third Sunday in June | Time and Date country calendar |
| United Kingdom | Sunday, June 20, 2027 | Third Sunday in June | Time and Date country calendar |
| Canada | Sunday, June 20, 2027 | Third Sunday in June | Time and Date country calendar |
| Australia | Sunday, September 5, 2027 | First Sunday in September | Time and Date country calendar |
What are the key Father’s Day statistics?
US$27.9bn
US$226.58
Projected US Father’s Day spending for 2026. This was a plan, not an audited outcome. Original source [S01].
NRF’s average planned budget per person for 2026. Original source [S01].
77%
34%
Planned to celebrate in NRF’s 2026 survey. Original source [S01].
Answered yes to YouGov’s explicit do-anything celebration question. This differs from NRF’s measure. Original source [S04].
88%
70%
Of the surveyed fathers wanted to spend the day with their children. Original source [S06].
Of the surveyed fathers valued a gift feeling personal or thoughtful. Original source [S06].
26%
64.5%
Most wanted yard or home-improvement duties removed for the day. Original source [S06].
Reported usually buying a Father’s Day gift a week ahead. Original source [S05].
71.8% / 49.7%
51.5%
Preferred personalised gifts among sentimental versus non-sentimental shoppers. Original source [S05].
Of prior AI gift-idea users had bought a suggested gift; this is a conditional base. Original source [S05].
23%
A$135
Of Australian adults planned to buy a gift in 2026. Original source [S07].
Average intended budget per Australian gift buyer in 2026. Original source [S07].
Which Father’s Day measures should stay separate?
Choose a statistic by its question, population and period. Spending intentions describe a different behavior from completed purchases, and gifts can be for more than one father figure.
| Measure | What it describes | Boundary when quoting |
|---|---|---|
| Calendar date | When the observance falls. | The date can be known before survey results exist. |
| Projected aggregate spending | A modelled total based on pre-holiday intentions. | Not audited sales, realized economic activity or proof of a causal effect. |
| Average planned budget | The source’s stated per-person or buyer-level mean. | Not the median or an amount that every household spends. |
| Gift-buying participation | Intention to buy a present. | Different from any celebration, a meal or a gift received by a father. |
| Multiple recipients or categories | People/types/channels selected in one question. | Overlap is possible; sums do not count unique people or money shares. |
| Wants and recalled behavior | Current preferences and memories of last year. | Not a verified annual trend or a matched giver-recipient fulfillment rate. |
| Father sample versus giver sample | Different eligible respondent groups. | A non-father celebrant is not every gift giver; fathers can give presents too. |
| Practical and personalised | Different gift attributes. | A useful item can be personalised; separate marginals do not show individual overlap. |
| AI inspiration, intention and purchase | Different scopes and conditional bases. | Past use, expected use and purchase among AI users are not one adoption rate. |
| Retailer first-party sales | Transactions/category analysis at one business. | Cannot establish national celebration rates or total market behavior. |
| Percentage points and percent growth | Subtraction of rates versus relative change. | A 3-point difference is not automatically 3% growth. |
ALSO READ:-
Couples Money Management Statistics 2027
Cyberbullying And Online Social Relationships Statistics 2027
Teen Friendship And Peer Support Statistics 2027
Couples Therapy and Counseling Statistics 2027
Sibling Relationship Statistics 2027
How much did US consumers plan to spend for Father’s Day?
NRF projected US$27.9 billion for 2026 and published an average planned budget of US$226.58. These are pre-holiday plans. The same release separates recipients, gift types, gift qualities and shopping destinations.
| ID | Finding and qualification | Population, actual period and base | Original source and locator |
|---|---|---|---|
| F01 | NRF projected US$27.9 billion in Father’s Day spending for 2026. Definition: Projected aggregate spending in nominal USD. Qualification: A pre-holiday projection, not realized sales, an audited total or a 2027 forecast. | US adults 18+; celebration, shopping and spending bases vary by item United States 2026-04-30 to 2026-05-06 per release; landing page ends May 5 Overall report n=7,914. Item/subgroup bases are not provided alongside these estimates. Overall report size is not the valid base for every item. | NRF / Prosper Insights & Analytics Published 2026-06-10 Release opening paragraph. |
| F02 | The published average planned budget was US$226.58 per person. Definition: NRF’s reported per-person planned-spending benchmark. Qualification: Not a median, a spending recommendation or a directly comparable international basket. The release does not itemize the valid spending base. | US adults 18+; celebration, shopping and spending bases vary by item United States 2026-04-30 to 2026-05-06 per release; landing page ends May 5 Overall report n=7,914. Item/subgroup bases are not provided alongside these estimates. Overall report size is not the valid base for every item. | NRF / Prosper Insights & Analytics Published 2026-06-10 Participation/average-spend paragraph. |
| F03 | 77% of consumers planned to celebrate Father’s Day. Definition: Pre-holiday stated celebration intention. Qualification: Not the share of fathers receiving a gift or a measurement of completed celebrations. | US adults 18+; celebration, shopping and spending bases vary by item United States 2026-04-30 to 2026-05-06 per release; landing page ends May 5 Overall report n=7,914. Item/subgroup bases are not provided alongside these estimates. Overall report size is not the valid base for every item. | NRF / Prosper Insights & Analytics Published 2026-06-10 Participation/average-spend paragraph. |
| F04 | Planned recipients included fathers/stepfathers (45%), husbands (25%), sons (13%), brothers (10%), friends (8%) and grandfathers (7%). Definition: Shares naming different recipients. Qualification: Categories can overlap; do not sum into unique people or call the remaining recipients everyone except birth fathers. Item base not printed. | US adults 18+; celebration, shopping and spending bases vary by item United States 2026-04-30 to 2026-05-06 per release; landing page ends May 5 Overall report n=7,914. Item/subgroup bases are not provided alongside these estimates. Overall report size is not the valid base for every item. | NRF / Prosper Insights & Analytics Published 2026-06-10 Recipient paragraph. |
| F05 | Gift plans included greeting cards (60%), clothing (58%), outings (55%) and gift cards (52%). Definition: Planned purchase categories, not sales shares. Qualification: Multiple gift types can be selected. A special outing and the separate experience-gift question are not interchangeable. | US adults 18+; celebration, shopping and spending bases vary by item United States 2026-04-30 to 2026-05-06 per release; landing page ends May 5 Overall report n=7,914. Item/subgroup bases are not provided alongside these estimates. Overall report size is not the valid base for every item. | NRF / Prosper Insights & Analytics Published 2026-06-10 Gift-category paragraph. |
| F06 | 44% prioritized a distinctive gift and 34% a gift that creates a special memory. Definition: Important qualities in choosing a gift. Qualification: Separate from a father’s own wish list and from actual purchase results; no individual overlap inferred. | US adults 18+; celebration, shopping and spending bases vary by item United States 2026-04-30 to 2026-05-06 per release; landing page ends May 5 Overall report n=7,914. Item/subgroup bases are not provided alongside these estimates. Overall report size is not the valid base for every item. | NRF / Prosper Insights & Analytics Published 2026-06-10 Gift-meaning paragraph. |
| F07 | 31% planned to give an experience. Definition: Experience-gift intention. Qualification: The question differs from the outing category and from all holiday activities. | US adults 18+; celebration, shopping and spending bases vary by item United States 2026-04-30 to 2026-05-06 per release; landing page ends May 5 Overall report n=7,914. Item/subgroup bases are not provided alongside these estimates. Overall report size is not the valid base for every item. | NRF / Prosper Insights & Analytics Published 2026-06-10 Subscription/experience paragraph. |
| F08 | 45% expressed interest in giving a subscription box. Definition: Interest, using the release’s wording. Qualification: Do not relabel interest as a completed purchase or compare directly with a differently worded prior-year plan. | US adults 18+; celebration, shopping and spending bases vary by item United States 2026-04-30 to 2026-05-06 per release; landing page ends May 5 Overall report n=7,914. Item/subgroup bases are not provided alongside these estimates. Overall report size is not the valid base for every item. | NRF / Prosper Insights & Analytics Published 2026-06-10 Subscription/experience paragraph. |
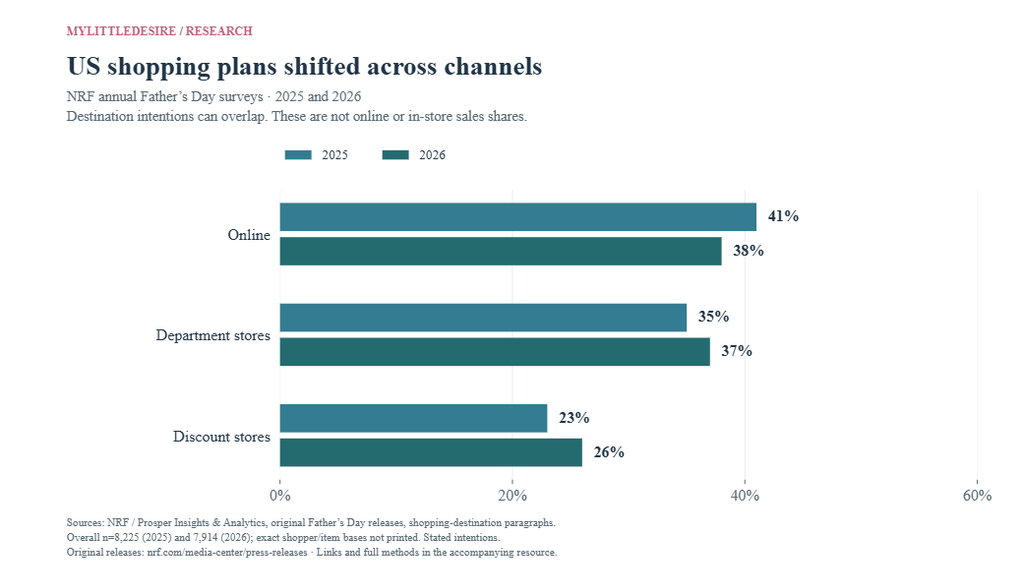
| F09 | Shopping destinations included online (38%), department stores (37%) and discount stores (26%). Definition: Destination intentions; multiple channels possible. Qualification: Not the share of money spent online or the share buying exclusively in one channel. | US adults 18+; celebration, shopping and spending bases vary by item United States 2026-04-30 to 2026-05-06 per release; landing page ends May 5 Overall report n=7,914. Item/subgroup bases are not provided alongside these estimates. Overall report size is not the valid base for every item. | NRF / Prosper Insights & Analytics Published 2026-06-10 Shopping-destination paragraph. |
How did US shopping plans change from 2025 to 2026?
Online destination intentions were 3 percentage points lower, while department stores and discount stores were 2 and 3 points higher. These are descriptive changes between annual samples, not individual shoppers switching channels or changes in sales share.
| ID | Finding and qualification | Population, actual period and base | Original source and locator |
|---|---|---|---|
| F10 | For 2025, NRF projected US$24 billion total, a US$199.38 average budget and 76% celebration. Its stated 2024 average was US$189.81. Definition: Prior annual benchmarks retained for clearly dated comparison. Qualification: Different annual respondents; planned nominal dollars. The 2024 figure is retrospective and does not inherit 2025’s sample size. | US adult consumers; different celebration, shopper and age-group bases United States 2025-05-01 to 2025-05-07; retrospective 2024 benchmark labeled separately Overall report n=8,225. Item/subgroup bases are not provided alongside these estimates. Overall report size is not the valid base for every item. | NRF / Prosper Insights & Analytics Published 2025-05-29 Opening and average-spend/participation paragraphs. |
| F11 | The highest-spending reported age group in 2025 was ages 35–44, with US$278.90 planned per person. Definition: Age-group average budget. Qualification: Age-group n and uncertainty not printed. A subgroup mean is not an ideal personal budget. | US adult consumers; different celebration, shopper and age-group bases United States 2025-05-01 to 2025-05-07; retrospective 2024 benchmark labeled separately Overall report n=8,225. Item/subgroup bases are not provided alongside these estimates. Overall report size is not the valid base for every item. | NRF / Prosper Insights & Analytics Published 2025-05-29 Age-group paragraph. |
| F12 | In 2025, planned destinations were online (41%), department stores (35%), discount stores (23%), specialty stores (22%) and local/small businesses (19%). Definition: Prior-year channel intentions. Qualification: Same published channel labels support descriptive annual comparisons. No panel tracking or new significance tests are claimed. | US adult consumers; different celebration, shopper and age-group bases United States 2025-05-01 to 2025-05-07; retrospective 2024 benchmark labeled separately Overall report n=8,225. Item/subgroup bases are not provided alongside these estimates. Overall report size is not the valid base for every item. | NRF / Prosper Insights & Analytics Published 2025-05-29 Shopping-destination paragraph. |
The average US planned budget rose by US$27.20, or 13.6%, between the published 2025 and 2026 benchmarks. Planned celebration changed by 1 percentage point. These distinct measures do not explain why budgets changed.
How does Father’s Day compare with Mother’s Day?
NRF’s separate Mother’s Day release published higher aggregate and average planned budgets. The holiday populations and survey dates differ. A spending gap cannot establish how much a parent is loved.
| ID | Finding and qualification | Population, actual period and base | Original source and locator |
|---|---|---|---|
| F13 | NRF’s Mother’s Day average planned budget was US$284.25 in 2026; the stated 2025 benchmark was US$259.04. Definition: Separate holiday’s per-person benchmark. Qualification: Separate samples and survey dates; not a matched-parent test or a measure of who is loved more. Detailed comparisons belong in the linked Mother’s Day hub. | US adults; Mother’s Day spending/celebration bases, not identical to Father’s Day respondents United States 2026-04-01 to 2026-04-08; prior-year benchmarks explicitly marked Overall report n=7,877. Item/subgroup bases are not provided alongside these estimates. Overall report size is not the valid base for every item. | NRF / Prosper Insights & Analytics Published 2026-04-21 Average-spend paragraph. |
| F14 | The 2026 Mother’s Day spending projection was US$38 billion, compared with the release’s US$34.1 billion benchmark for 2025. Definition: Nominal aggregate projections for a separate holiday. Qualification: Not completed transactions or a population-adjusted comparison with Father’s Day. | US adults; Mother’s Day spending/celebration bases, not identical to Father’s Day respondents United States 2026-04-01 to 2026-04-08; prior-year benchmarks explicitly marked Overall report n=7,877. Item/subgroup bases are not provided alongside these estimates. Overall report size is not the valid base for every item. | NRF / Prosper Insights & Analytics Published 2026-04-21 Opening paragraph. |
Our Mother’s Day statistics resource contains the fuller comparison of the two holidays. This page focuses on Father’s Day choices, preferences, planning and shopping channels.
Who planned to celebrate Father’s Day in the US?
YouGov’s explicit do-anything question returned 34% yes in April 2026, with 45% no and 21% unsure. It differs from NRF’s 77% headline in target population, wording, survey context and timing. Treat them as separate estimates, not a time trend.
| ID | Finding and qualification | Population, actual period and base | Original source and locator |
|---|---|---|---|
| F15 | Asked whether they planned to do anything for Father’s Day, 34% said yes, 45% no and 21% were unsure. Definition: An explicit do-anything question with a not-sure option. Qualification: Citizen sample, question wording and survey timing differ from NRF. The two estimates are not a time trend or proof of an error. | US adult citizens 18+; item-specific valid bases and restricted upbringing base retained United States 2026-04-23 to 2026-04-28 Overall report n=1,134. Published input bases: 1,129. Overall report size is not the valid base for every item. | YouGov Published 2026-05-07 accompanying article PDF physical p.30 / printed p.26, Q11; methods physical p.31. |
| F16 | For Mother’s Day in the same survey, 47% said yes, 34% no and 20% were unsure. Definition: Matching celebration-question wording for a different holiday. Qualification: Rounded responses total 101%; do not force to 100. Valid n differs slightly from Father’s Day. | US adult citizens 18+; item-specific valid bases and restricted upbringing base retained United States 2026-04-23 to 2026-04-28 Overall report n=1,134. Published input bases: 1,131. Overall report size is not the valid base for every item. | YouGov Published 2026-05-07 accompanying article PDF physical p.27 / printed p.23, Q9. |
| F17 | YouGov reported 32% planning both holidays. Among parents of under-18s, 52% planned Father’s Day and 67% Mother’s Day. Definition: Overall two-holiday overlap and a separately defined parent subgroup. Qualification: Article is an original YouGov analysis, but subgroup n/cross-tab for these statements is not in the linked PDF. Do not use 1,134 as the subgroup base. | Adult US citizens; overall base for both-holiday figure; parents of children under 18 for 52% and 67% United States 2026-04-23 to 2026-04-28 Overall report n=1,134. Item/subgroup bases are not provided alongside these estimates. Overall report size is not the valid base for every item. | YouGov Published 2026-05-07 accompanying article Accompanying May 7 article, opening celebration paragraphs. |
| F18 | Father’s Day yes responses were 50% at ages 18–29, 41% at 30–44, 30% at 45–64 and 18% at 65+. Definition: Cross-sectional age-group celebration intentions. Qualification: Not the percentage of fathers in each age group. No cohort aging or causal age effect is established. | US adult citizens 18+; item-specific valid bases and restricted upbringing base retained United States 2026-04-23 to 2026-04-28 Overall report n=1,134. Published input bases: 227, 295, 297, 310. Overall report size is not the valid base for every item. | YouGov Published 2026-05-07 accompanying article PDF physical p.30 / printed p.26, Q11 age columns. |
| F19 | Planned celebration was 26% in the under-US$50,000 family-income band, 37% in the US$50,000–100,000 band and 49% in the US$100,000+ band. Definition: Income-group celebration intentions using published band labels. Qualification: Unadjusted association, not an income effect or a measure of generosity. Labels are retained without inventing endpoint rules. | US adult citizens 18+; item-specific valid bases and restricted upbringing base retained United States 2026-04-23 to 2026-04-28 Overall report n=1,134. Published input bases: 278, 338, 411. Overall report size is not the valid base for every item. | YouGov Published 2026-05-07 accompanying article PDF physical p.30 / printed p.26, Q11 family-income columns. |
| F20 | Among adults raised by a mother and father, 15% recalled being closer to their father, 39% to their mother, 40% to both equally and 6% to neither. Definition: Retrospective comparative childhood closeness. Qualification: Restricted upbringing base, not every adult, current relationship quality or a Father’s Day gift-giving explanation. | Adult US citizens who reported being raised by a mother and father United States 2026-04-23 to 2026-04-28 Overall report n=1,134. Published input bases: 930. Overall report size is not the valid base for every item. | YouGov Published 2026-05-07 accompanying article PDF physical p.9 / printed p.5, Q2D. |
Childhood closeness is separate context. The survey does not establish that closeness caused someone’s holiday plans, or that not celebrating means a family relationship is poor.
How do UK shoppers find and choose Father’s Day gifts?
In Create Gift Love’s selected gift-shopper sample, search engines and in-person browsing were the leading listed sources of inspiration. The study also separates practical gifts, personalisation, sentimentality, usual shopping timing and several different AI-use questions.
| ID | Finding and qualification | Population, actual period and base | Original source and locator |
|---|---|---|---|
| F21 | 81.5% enjoyed Father’s Day gift shopping; the reported shares were 81% among men and 81.8% among women. Definition: Self-reported enjoyment among screened gift shoppers. Qualification: Not all UK adults. Gender subgroup bases are unpublished. | Adults 18+ screened for planned Father’s Day gift buying; being a dad alone did not qualify United Kingdom April 2026; recall item concerns Father’s Day 2025 Overall report n=1,001. Item/subgroup bases are not provided alongside these estimates. Overall report size is not the valid base for every item. | Create Gift Love / Pollfish Published 2026-05-13 Enjoyment question section. |
| F22 | Sources of Father’s Day inspiration included search engines (67.6%), in-person browsing (67.1%), social media (49.9%) and AI chatbots (24.3%). Definition: Father’s Day-specific, multiple-response inspiration sources. Qualification: Overlap is allowed. This AI figure differs from the later any-gift AI question and from intended future AI use. | Adults 18+ screened for planned Father’s Day gift buying; being a dad alone did not qualify United Kingdom April 2026; recall item concerns Father’s Day 2025 Overall report n=1,001. Item/subgroup bases are not provided alongside these estimates. Overall report size is not the valid base for every item. | Create Gift Love / Pollfish Published 2026-05-13 Gift-inspiration question section. |
| F23 | For gift ideas generally, 18.1% used AI frequently, 32.4% occasionally, 36.1% had not but were open to it and 13.5% were not interested. Definition: Any-gift AI usage, not necessarily Father’s Day. Qualification: Published rounded categories total 100.1%. Do not describe 51.5% conditional purchasers as all gift shoppers. | Adults 18+ screened for planned Father’s Day gift buying; being a dad alone did not qualify United Kingdom April 2026; recall item concerns Father’s Day 2025 Overall report n=1,001. Item/subgroup bases are not provided alongside these estimates. Overall report size is not the valid base for every item. | Create Gift Love / Pollfish Published 2026-05-13 General ChatGPT/AI-assistant question. |
| F24 | Any-gift AI use was 60.3% at ages 18–24, 66.7% at 25–34, 50.2% at 35–44, 36.4% at 45–54 and 25% at 55+; men reported 55.8% and women 45.1%. Definition: Frequent-or-occasional use within each selected subgroup. Qualification: Subgroup n and uncertainty not published. Not a longitudinal technology-adoption trend. | Adults 18+ screened for planned Father’s Day gift buying; being a dad alone did not qualify United Kingdom April 2026; recall item concerns Father’s Day 2025 Overall report n=1,001. Item/subgroup bases are not provided alongside these estimates. Overall report size is not the valid base for every item. | Create Gift Love / Pollfish Published 2026-05-13 General AI question, age/gender paragraphs. |
| F25 | Among AI gift-idea users, 51.5% had bought a suggested gift, 43.4% found ideas useful but chose something else and 5.2% did not find suggestions helpful. Definition: Self-reported response among prior AI users. Qualification: Conditional base n is undisclosed. Not 51.5% of all UK adults or all Father’s Day shoppers, and not a causal conversion rate. | Prior AI gift-idea users within the selected UK gift-shopper sample United Kingdom April 2026; recall item concerns Father’s Day 2025 Overall report n=1,001. Item/subgroup bases are not provided alongside these estimates. Overall report size is not the valid base for every item. | Create Gift Love / Pollfish Published 2026-05-13 Conditional AI-recommendation purchase question. |
| F26 | 30% reported buying about a month ahead, 64.5% a week ahead and 5.1% a day ahead. Definition: Usual Father’s Day gift-shopping lead time. Qualification: Retain the source’s categories; do not turn a usual-behavior answer into observed 2027 shopping dates. Rounded categories do not sum exactly to 100. | Adults 18+ screened for planned Father’s Day gift buying; being a dad alone did not qualify United Kingdom April 2026; recall item concerns Father’s Day 2025 Overall report n=1,001. Item/subgroup bases are not provided alongside these estimates. Overall report size is not the valid base for every item. | Create Gift Love / Pollfish Published 2026-05-13 Shopping-timing question section. |
| F27 | Expected gift budgets were under £10 (4.1%), £10–30 (34.1%), £30–50 (32.3%), £50–75 (12.5%), £75–100 (10.5%), £100–250 (4.5%) and over £250 (2.1%). Definition: Published categorical planned spending, in GBP. Qualification: Bands are retained as labeled, without inventing boundary rules or estimating a mean from an open-ended top category. Rounding totals 100.1%. | Adults 18+ screened for planned Father’s Day gift buying; being a dad alone did not qualify United Kingdom April 2026; recall item concerns Father’s Day 2025 Overall report n=1,001. Item/subgroup bases are not provided alongside these estimates. Overall report size is not the valid base for every item. | Create Gift Love / Pollfish Published 2026-05-13 Gift-spending question section. |
| F28 | Usual gifts included food/drink (54.2%), personalised items (45.7%), clothing (45.6%), experiences (19%) and tech accessories (18.5%); 31.3% of the selected dad subgroup wanted tech accessories. Definition: Givers’ usual choices compared with a selected father subset’s preferences. Qualification: Different questions and bases, not matched giver-recipient pairs or a national unmet-demand percentage. | Adults 18+ screened for planned Father’s Day gift buying; being a dad alone did not qualify United Kingdom April 2026; recall item concerns Father’s Day 2025 Overall report n=1,001. Item/subgroup bases are not provided alongside these estimates. Overall report size is not the valid base for every item. | Create Gift Love / Pollfish Published 2026-05-13 Usual gift-type question and dad-subgroup paragraph. |
| F29 | 65.7% of shoppers preferred giving a practical gift; in the selected dad group, 66% preferred receiving practical and 34% emotive gifts. Definition: Useful-item versus sentimental-item preference under the survey’s definitions. Qualification: Giver and father-subset bases differ. This is not a forced choice between caring and not caring. | Adults 18+ screened for planned Father’s Day gift buying; being a dad alone did not qualify United Kingdom April 2026; recall item concerns Father’s Day 2025 Overall report n=1,001. Item/subgroup bases are not provided alongside these estimates. Overall report size is not the valid base for every item. | Create Gift Love / Pollfish Published 2026-05-13 Practical-versus-emotive question section. |
| F30 | 64.5% preferred to give a personalised Father’s Day gift. Definition: Giver preference for customisation. Qualification: The dad-subgroup percentage conflicts between key data and body and is withheld. Personalised need not mean impractical. | Adults 18+ screened for planned Father’s Day gift buying; being a dad alone did not qualify United Kingdom April 2026; recall item concerns Father’s Day 2025 Overall report n=1,001. Item/subgroup bases are not provided alongside these estimates. Overall report size is not the valid base for every item. | Create Gift Love / Pollfish Published 2026-05-13 Personalised-versus-non-personalised question section. |
| F31 | 67% described themselves as sentimental, including 75.7% of women, 58.4% of men and 79.4% of ages 18–24. Definition: Self-description within the screened gift-shopper sample. Qualification: Not a validated psychological scale or all UK adults; subgroup bases unavailable. | Adults 18+ screened for planned Father’s Day gift buying; being a dad alone did not qualify United Kingdom April 2026; recall item concerns Father’s Day 2025 Overall report n=1,001. Item/subgroup bases are not provided alongside these estimates. Overall report size is not the valid base for every item. | Create Gift Love / Pollfish Published 2026-05-13 Sentimentality question section. |
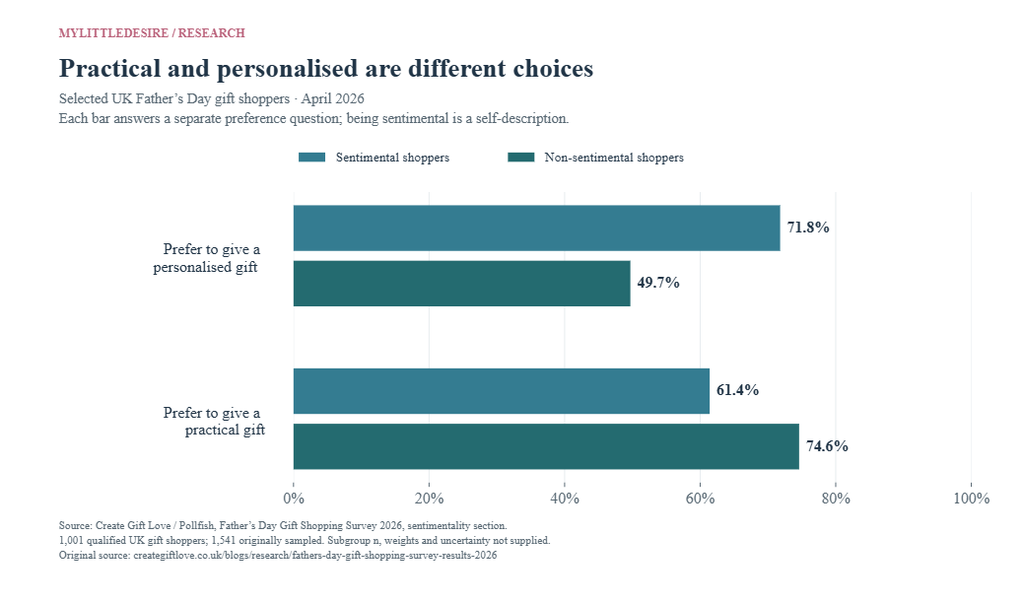
| F32 | Sentimental versus non-sentimental shoppers preferred personalised gifts at 71.8% versus 49.7%, and practical gifts at 61.4% versus 74.6%. Definition: Two preference questions split by the same self-description. Qualification: Question results are separate marginals. Do not infer how many chose a gift that was both practical and personalised, or claim sentimentality causes choices. | Adults 18+ screened for planned Father’s Day gift buying; being a dad alone did not qualify United Kingdom April 2026; recall item concerns Father’s Day 2025 Overall report n=1,001. Item/subgroup bases are not provided alongside these estimates. Overall report size is not the valid base for every item. | Create Gift Love / Pollfish Published 2026-05-13 Sentimentality section, shopping-habit paragraphs. |
| F33 | 67.3% recalled what they gave the previous Father’s Day and 32.7% did not; recall was 71.4% among men, 63.3% among women and 68% in the selected dad recipient group. Definition: Recollection roughly ten months after Father’s Day 2025. Qualification: Recall is not verified purchase history or a measure of how much a gift mattered. Giver and recipient-subset questions differ. | Adults 18+ screened for planned Father’s Day gift buying; being a dad alone did not qualify United Kingdom April 2026 recall of Father’s Day 2025 Overall report n=1,001. Item/subgroup bases are not provided alongside these estimates. Overall report size is not the valid base for every item. | Create Gift Love / Pollfish Published 2026-05-13 Previous-year gift-recall section. |
| F34 | Agreement that an attribute mattered was 75.3% for small businesses, 70.3% for sustainable/ethical goods, 69.5% for UK-made goods and 65.6% for handmade goods. Definition: Combined somewhat agree, agree and strongly agree responses. Qualification: Stated importance, not observed sales shares. The handmade-disagreement rounding inconsistency is not used. | Adults 18+ screened for planned Father’s Day gift buying; being a dad alone did not qualify United Kingdom April 2026; recall item concerns Father’s Day 2025 Overall report n=1,001. Item/subgroup bases are not provided alongside these estimates. Overall report size is not the valid base for every item. | Create Gift Love / Pollfish Published 2026-05-13 Product-attribute importance section. |
What do US fathers want from Father’s Day?
In Drive Research’s father sample, 88% wanted to spend the day with their children and 69% with a spouse or partner. The survey also asked what gifts fathers wanted, what duties they wanted removed, who coordinated plans and how hypothetical pressure changed the question about alone time.
| ID | Finding and qualification | Population, actual period and base | Original source and locator |
|---|---|---|---|
| F35 | Fathers wanted eating out (56%), a meal at home (48%), receiving gifts (36%), an experience/activity (32%) and wellness activities (28%). Definition: Desired 2026 activities, multiple choices. Qualification: Not actual participation or mutually exclusive categories; an activity experience differs from an experience gift. | Father respondents in Drive Research’s US online survey (n=427); valid item bases not printed United States May 2026; recalled events refer to Father’s Day 2025 Overall report n=1,096. Item/subgroup bases are not provided alongside these estimates. Overall report size is not the valid base for every item. | Drive Research Published 2026-05-29 What do dads want to do section, opening list. |
| F36 | For the prior Father’s Day, fathers recalled eating out (52%), receiving gifts (51%), a meal at home (50%), child/grandchild care (33%), chores (31%) and an experience (18%). Definition: May 2026 recall of 2025 activities. Qualification: Not a contemporaneous 2025 survey. Comparing recalled behavior with current wishes does not measure a year-to-year activity trend. | Father respondents in Drive Research’s US online survey (n=427); valid item bases not printed United States May 2026 recall of Father’s Day 2025 Overall report n=1,096. Item/subgroup bases are not provided alongside these estimates. Overall report size is not the valid base for every item. | Drive Research Published 2026-05-29 Prior-year celebration paragraph and examples. |
| F37 | Single/separated/divorced/widowed fathers recalled time alone at 26% versus 14% of married fathers, and doing nothing at 6% versus 2%; married fathers recalled home meals at 55% versus 38% and experiences at 21% versus 10%. Definition: Recalled activities by explicitly combined relationship-status groups. Qualification: Subgroup n unknown. The combined category is not simply single dads or everyone without a partner. No causal status effect or prevalence of loneliness follows. | Father respondents in Drive Research’s US online survey (n=427); valid item bases not printed United States May 2026 recall of Father’s Day 2025 Overall report n=1,096. Item/subgroup bases are not provided alongside these estimates. Overall report size is not the valid base for every item. | Drive Research Published 2026-05-29 Relationship-status subsection on previous celebrations. |
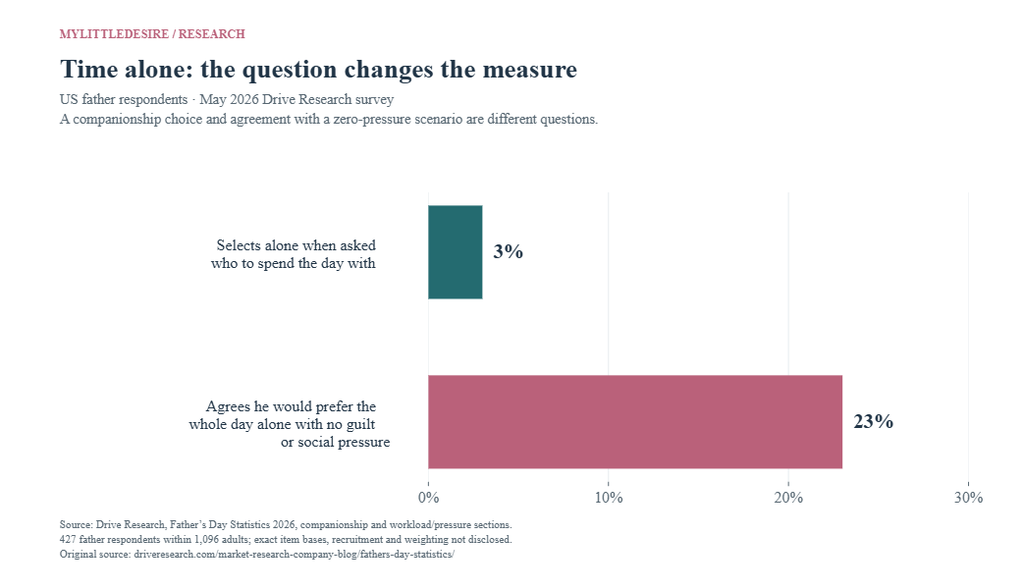
| F38 | Preferred company included children (88%), spouse/partner (69%), friends (22%), own father/father figure (17%), grandchildren (16%) and siblings (15%); 3% selected being alone. Definition: Companionship choices for the day. Qualification: Different from the later hypothetical zero-pressure question. No joint distribution is given; do not use the difference as the share hiding a preference. | Father respondents in Drive Research’s US online survey (n=427); valid item bases not printed United States May 2026; recalled events refer to Father’s Day 2025 Overall report n=1,096. Item/subgroup bases are not provided alongside these estimates. Overall report size is not the valid base for every item. | Drive Research Published 2026-05-29 Who do dads want to spend Father’s Day with section. |
| F39 | Desired presents included gift cards (42%), handwritten cards (37%), money (30%), food/drink (29%), experience gifts (29%), hobby gifts (28%), electronics (23%) and jewellery/wearable tech (21%). Definition: Father respondents’ requested gift categories. Qualification: Multiple responses. Electronics and wearable categories follow the publisher’s labels, which may overlap; no market shares inferred. | Father respondents in Drive Research’s US online survey (n=427); valid item bases not printed United States May 2026; recalled events refer to Father’s Day 2025 Overall report n=1,096. Item/subgroup bases are not provided alongside these estimates. Overall report size is not the valid base for every item. | Drive Research Published 2026-05-29 Gift-wish-list paragraph and comparison examples. |
| F40 | Desired gift qualities included personal/thoughtful (70%), sentimental (45%), surprising (41%), reflecting interests (39%), practical (39%) and high quality (20%). Definition: Importance of gift qualities in fathers’ responses. Qualification: Not a forced ranking of price against thoughtfulness and not evidence that quality is irrelevant. | Father respondents in Drive Research’s US online survey (n=427); valid item bases not printed United States May 2026; recalled events refer to Father’s Day 2025 Overall report n=1,096. Item/subgroup bases are not provided alongside these estimates. Overall report size is not the valid base for every item. | Drive Research Published 2026-05-29 What matters most when dads receive a gift subsection. |
| F41 | Non-father celebrants planned food/drink (43%), handwritten cards (40%), gift cards (28%), clothing (27%), homemade gifts (19%), experiences (17%), electronics (9%) and jewellery/wearable tech (9%). Definition: Giver plans among non-fathers expected to celebrate. Qualification: Not all gift givers, because fathers who give gifts are outside this comparison group. Givers and father recipients were not paired. | Non-fathers expected to celebrate Father’s Day in Drive Research’s US survey (n=669); valid item bases not printed United States May 2026; recalled events refer to Father’s Day 2025 Overall report n=1,096. Item/subgroup bases are not provided alongside these estimates. Overall report size is not the valid base for every item. | Drive Research Published 2026-05-29 Gift-giver plans paragraph and comparison examples. |
| F42 | 98% of the gift-giver group expressed some confidence in choosing something the recipient wants. Definition: Any level of self-reported gift-selection confidence. Qualification: Not 98% strongly confident, accurate gift matches or satisfied recipients. The full scale is not published. | Non-fathers expected to celebrate Father’s Day in Drive Research’s US survey (n=669); valid item bases not printed United States May 2026; recalled events refer to Father’s Day 2025 Overall report n=1,096. Item/subgroup bases are not provided alongside these estimates. Overall report size is not the valid base for every item. | Drive Research Published 2026-05-29 Final paragraph of gift-giver comparison subsection. |
| F43 | The most requested duties to remove were yard/home-improvement work (26%), cleaning (16%), errands (15%), cooking (12%) and planning meals/activities (12%). Definition: The household responsibility respondents most wanted removed. Qualification: Different from the actual time spent doing tasks or wanting no responsibilities at all. | Father respondents in Drive Research’s US online survey (n=427); valid item bases not printed United States May 2026; recalled events refer to Father’s Day 2025 Overall report n=1,096. Item/subgroup bases are not provided alongside these estimates. Overall report size is not the valid base for every item. | Drive Research Published 2026-05-29 What dads want off their plate section, first paragraph. |
| F44 | 20% reported more work than on a usual Sunday, 25% more pressure to make the day special for others, and 23% agreed they would prefer the entire day alone if there were no guilt or social pressure. Definition: Separate workload and hypothetical agreement questions. Qualification: Not individual overlap, a causal effect of pressure, depression or a rejection of family. The zero-pressure wording differs from the companionship choice. | Father respondents in Drive Research’s US online survey (n=427); valid item bases not printed United States May 2026; recalled events refer to Father’s Day 2025 Overall report n=1,096. Item/subgroup bases are not provided alongside these estimates. Overall report size is not the valid base for every item. | Drive Research Published 2026-05-29 Workload/pressure bullet list. |
| F45 | 20% said they coordinated plans themselves and 50% named a spouse/partner. Self-coordination was 34% in the combined non-married group versus 15% among married fathers; spouse/partner coordination was 19% versus 62%. Definition: Who is most responsible for coordinating the holiday. Qualification: Relationship-status subgroup bases undisclosed. Coordination is not total emotional labor, relationship quality or a causal result of marriage. | Father respondents in Drive Research’s US online survey (n=427); valid item bases not printed United States May 2026; recalled events refer to Father’s Day 2025 Overall report n=1,096. Item/subgroup bases are not provided alongside these estimates. Overall report size is not the valid base for every item. | Drive Research Published 2026-05-29 Top-statistics coordination bullet; coordination paragraphs and relationship-status subsection. |
| F46 | Among non-father celebrants, 45% usually started planning a few weeks ahead, 20% over a month ahead and 19% about a week ahead. Definition: Usual holiday-planning lead time. Qualification: Planning and purchasing are different measures; do not directly subtract from Create Gift Love’s buying timeline. | Non-fathers expected to celebrate Father’s Day in Drive Research’s US survey (n=669); valid item bases not printed United States May 2026; recalled events refer to Father’s Day 2025 Overall report n=1,096. Item/subgroup bases are not provided alongside these estimates. Overall report size is not the valid base for every item. | Drive Research Published 2026-05-29 Planning-timing section. |
| F47 | Gift ideas came from own ideas (60%), recipient requests (37%), family/friends (34%), store browsing (31%), prior gifts (30%), social media (27%), search (23%), guides (20%), retailer sites (20%) and AI (8%). Definition: Multiple inspiration sources reported by non-father celebrants. Qualification: Different US selected sample and question from the UK surveys. Neither 8% nor 24.3% is a cross-country AI adoption ranking. | Non-fathers expected to celebrate Father’s Day in Drive Research’s US survey (n=669); valid item bases not printed United States May 2026; recalled events refer to Father’s Day 2025 Overall report n=1,096. Item/subgroup bases are not provided alongside these estimates. Overall report size is not the valid base for every item. | Drive Research Published 2026-05-29 Gift-idea source paragraphs. |
Planning responsibilities are also different from ongoing care. For that broader role, see family caregiving and relationship research.
Why can more Australian gift buyers coexist with smaller budgets?
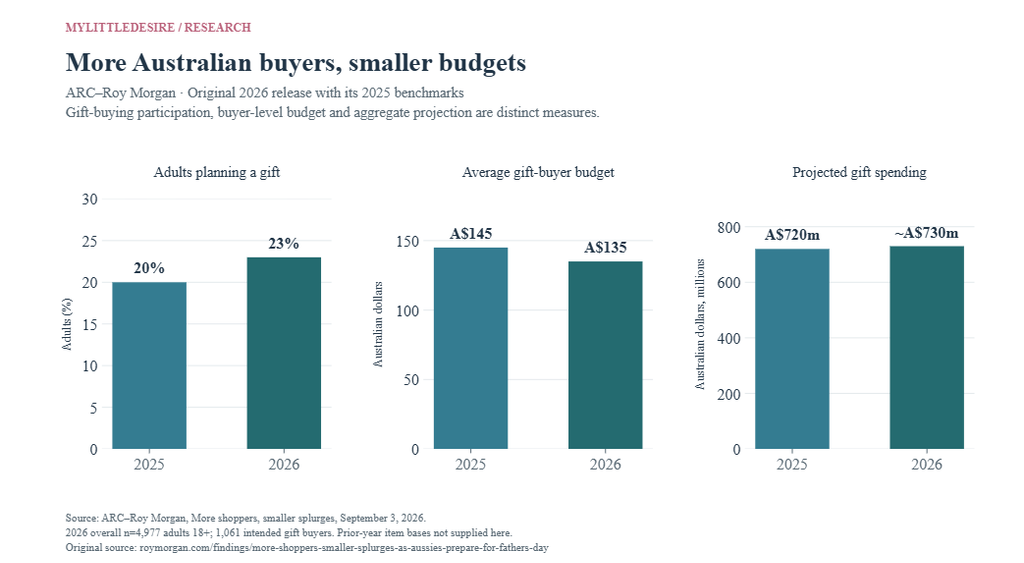
Roy Morgan and ARC projected more intended gift buyers in 2026, a smaller average budget per buyer and a slightly higher aggregate spending total. Each measure answers a different question. Meal celebrations and gifts for father figures add further context.
| ID | Finding and qualification | Population, actual period and base | Original source and locator |
|---|---|---|---|
| F48 | 23% of Australian adults, projected as 5.5 million people, planned to buy a gift in 2026, versus 20% or 4.7 million in 2025. Definition: Gift-buying intentions and projected adult count. Qualification: Weighted population projections, not raw respondent counts or every form of celebration. 2025 figures are quoted retrospectively in the 2026 release. | Australia-wide adults 18+; 1,061 respondents planned gift buying; decided-gift subgroup is smaller/undisclosed Australia 2026-07-31 to 2026-08-04; earlier-year comparisons reported in same release Overall report n=4,977. Item/subgroup bases are not provided alongside these estimates. Overall report size is not the valid base for every item. | Australian Retail Council / Roy Morgan Published 2026-09-03 Opening participation paragraph. |
| F49 | Projected gift spending was about A$730 million, compared with A$720 million in 2025. Definition: Nominal Australian-dollar projection. Qualification: Rounded forecast, not realized sales or a 2027 estimate. Do not treat as US dollars. | Australia-wide adults 18+; 1,061 respondents planned gift buying; decided-gift subgroup is smaller/undisclosed Australia 2026-07-31 to 2026-08-04; earlier-year comparisons reported in same release Overall report n=4,977. Item/subgroup bases are not provided alongside these estimates. Overall report size is not the valid base for every item. | Australian Retail Council / Roy Morgan Published 2026-09-03 Aggregate-spending paragraph. |
| F50 | Average planned spending per gift buyer fell from A$145 to A$135. Definition: Buyer-level planned budget, not a national all-adult mean. Qualification: More buyers can coexist with a lower average. Published rounded counts and means do not exactly reconstruct the published aggregate. | Australia-wide adults 18+; 1,061 respondents planned gift buying; decided-gift subgroup is smaller/undisclosed Australia 2026-07-31 to 2026-08-04; earlier-year comparisons reported in same release Overall report n=4,977. Item/subgroup bases are not provided alongside these estimates. Overall report size is not the valid base for every item. | Australian Retail Council / Roy Morgan Published 2026-09-03 Average-spending paragraph. |
| F51 | Among gift buyers who had decided what to buy, choices included food/alcohol (29%), clothing/shoes/sleepwear (19%), experiences (14%), vouchers (11%), books/music/games (9%), tools/hardware/gardening (8%), personalised items (7%) and homewares (6%). Definition: Gift categories among already-decided gift buyers. Qualification: Exact decided-subgroup n is not disclosed. This is neither all 4,977 adults nor necessarily all 1,061 intended gift buyers; the 2025 gift-mix base differs. | Australian adults planning gifts who already know what they will buy; exact valid subgroup n unavailable Australia 2026-07-31 to 2026-08-04; earlier-year comparisons reported in same release Overall report n=4,977. Item/subgroup bases are not provided alongside these estimates. Overall report size is not the valid base for every item. | Australian Retail Council / Roy Morgan Published 2026-09-03 Most popular gifts list and its explicit base heading. |
| F52 | 37%, projected as 8.7 million adults, planned a Father’s Day meal at home or a restaurant/café, versus 28% in 2025. Definition: Planned meal celebration, independent of buying a gift. Qualification: Not restaurant visits alone. Do not sum meal celebrants and gift buyers into unique participants. | Australia-wide adults 18+; 1,061 respondents planned gift buying; decided-gift subgroup is smaller/undisclosed Australia 2026-07-31 to 2026-08-04; earlier-year comparisons reported in same release Overall report n=4,977. Item/subgroup bases are not provided alongside these estimates. Overall report size is not the valid base for every item. | Australian Retail Council / Roy Morgan Published 2026-09-03 In-person celebrations paragraph. |
| F53 | 12%, projected as 2.8 million adults, planned a gift for someone other than their birth father, compared with 1.9 million in 2025. Definition: Gifting that includes another father figure. Qualification: Can overlap with gifts to birth fathers; do not subtract from all gift buyers to infer exclusive birth-father gifting. | Australia-wide adults 18+; 1,061 respondents planned gift buying; decided-gift subgroup is smaller/undisclosed Australia 2026-07-31 to 2026-08-04; earlier-year comparisons reported in same release Overall report n=4,977. Item/subgroup bases are not provided alongside these estimates. Overall report size is not the valid base for every item. | Australian Retail Council / Roy Morgan Published 2026-09-03 Other-than-birth-father paragraph. |
What additional context does Australia’s 2025 survey provide?
The earlier release describes high-budget buyers, expected changes in personal spending and meal venues. Keep its year and population beside the findings; the 2026 decided-gift category base should not be treated as identical.
| ID | Finding and qualification | Population, actual period and base | Original source and locator |
|---|---|---|---|
| F54 | In 2025, one-quarter of gift buyers planned to spend more than A$200, and 26% expected to spend more than in 2024. Definition: High-budget threshold and self-comparison among gift buyers. Qualification: Related but separate measures; do not equate above-A$200 with year-on-year increase. Original valid bases not disclosed. | Australian adult survey respondents; gift-buyer and all-adult bases differ Australia 2025 pre-holiday survey; exact field dates not given in release Item/subgroup bases are not provided alongside these estimates. Overall report size is not the valid base for every item. | Australian Retailers Association / Roy Morgan Published 2025-08-27 CEO quote on buyer budgets. |
| F55 | In 2025, planned meals were at home for 19% of adults and at a restaurant/café for 9%. Definition: Planned meal venue in the 2025 release. Qualification: Not 2026 venue shares or actual spending/footfall. The source reports a combined 28%, but no new individual overlap is inferred. | Australian adult survey respondents; gift-buyer and all-adult bases differ Australia 2025 pre-holiday survey; exact field dates not given in release Item/subgroup bases are not provided alongside these estimates. Overall report size is not the valid base for every item. | Australian Retailers Association / Roy Morgan Published 2025-08-27 Meal-celebration paragraph. |
What do verified historical UK budget findings show?
MyVoucherCodes’ original 2025 OnePoll release reports a £54.06 average for planned gifts and cards among a restricted contact/gift-buyer population. This is a historical benchmark with its own eligibility, not a current all-UK-adult average.
| ID | Finding and qualification | Population, actual period and base | Original source and locator |
|---|---|---|---|
| F56 | In 2025, intended Father’s Day gift/card spending averaged £54.06; ages 25–34 planned £78.24. Definition: Spending among people planning to buy for a father/stepfather. Qualification: Restricted contact/gift-buyer population; not per family or all UK adults. Age-group valid n unknown. | UK adults in contact with their father/stepfather; gift buyers for spending and father subset for desired gifts United Kingdom 2025-05-02 to 2025-05-10 Overall report n=2,000. Item/subgroup bases are not provided alongside these estimates. Overall report size is not the valid base for every item. | MyVoucherCodes / OnePoll Published 2025-06-04 Opening budget and age-group paragraphs. |
| F57 | Planned gifts included alcohol (23%), food (21%) and a meal out (17%); fathers’ desired gifts included a day out (20%), tech (19%) and a meal (18%). Definition: Giver intentions and father-subgroup preferences. Qualification: Unmatched respondent groups and partly different category labels; not a paired fulfillment gap or a representative wish list for every UK father. | UK adults in contact with their father/stepfather; gift buyers for spending and father subset for desired gifts United Kingdom 2025-05-02 to 2025-05-10 Overall report n=2,000. Item/subgroup bases are not provided alongside these estimates. Overall report size is not the valid base for every item. | MyVoucherCodes / OnePoll Published 2025-06-04 Gift-plans and desired-gifts paragraphs. |
What can Canadian retailer data establish?
Walmart Connect’s first-party category analysis shows high in-person shares for two categories. It describes one retailer’s sales, not national Father’s Day celebration or shopping behavior. Its data footnote is April–May 2024 despite the article’s 2025 title.
| ID | Finding and qualification | Population, actual period and base | Original source and locator |
|---|---|---|---|
| F58 | Walmart Connect reported over 98% of men’s clothing/accessories sales and 99% of greeting-card sales in its Father’s Day category analysis were in person. Definition: Sales-channel shares within Walmart Canada’s own category analysis. Qualification: Retailer-only data. The sales metric and exact holiday window are undisclosed; footnote labels April–May 2024. Not a national Canadian in-store shopping rate. | Walmart Canada category sales, not all Canadian consumers or all national sales Canada Walmart first-party data labeled April–May 2024; article describes the Father’s Day period Item/subgroup bases are not provided alongside these estimates. Overall report size is not the valid base for every item. | Walmart Connect Canada Published 2025-05-01 Men’s Clothing and Accessories; Greeting Cards; footnote 3. |
What additional UK celebration and discovery research is available?
Savvy’s original 2026 release reports home-meal plans and retail inspiration among planned celebrants. Its AI-intention item has a less explicit base. The exact wave sample and field dates are not published, so the findings retain those limits.
| ID | Finding and qualification | Population, actual period and base | Original source and locator |
|---|---|---|---|
| F59 | Among planned celebrants, Savvy reported 71% intending a home meal, 53% looking for limited/exclusive food or drink and 51% planning premium food/drink. Definition: Separate meal and purchase intentions in the issuer’s panel release. Qualification: Wave n, field days and item bases are not supplied. Do not call these all-UK-adult rates or add overlapping choices. | Savvy shopper-panel respondents; meal/inspiration items specify planned celebrants, while the AI item base is not separately stated United Kingdom 2026 pre-holiday survey; exact field dates not disclosed Item/subgroup bases are not provided alongside these estimates. Overall report size is not the valid base for every item. | Savvy Marketing Published 2026-06-10 At-home celebrations section. |
| F60 | Savvy reported Amazon as an inspiration source for 50% of planned celebrants and supermarkets for 48%. Separately, 45% expected to use AI for gift ideas, with that item’s exact base unstated. Definition: Retail inspiration among planned celebrants, plus a separately reported AI-intention item. Qualification: Expected future use differs from past actual AI use, general gift use or conditional AI purchase. AI eligibility is not independently resolved. General panel n=1,000 is not assigned to this exact wave. | Savvy shopper-panel respondents; meal/inspiration items specify planned celebrants, while the AI item base is not separately stated United Kingdom 2026 pre-holiday survey; exact field dates not disclosed Item/subgroup bases are not provided alongside these estimates. Overall report size is not the valid base for every item. | Savvy Marketing Published 2026-06-10 Gift-inspiration and AI sections. |
What comparisons does MyLittleDesire add?
We join compatible source measures, show the arithmetic and retain the interpretation limits. Some contrasts were already apparent in the original reports. Their value here is convenient, traceable presentation; these are not 20 new scientific discoveries, original interviews or new significance tests.
| Comparison | Arithmetic and units | Original source | Interpretation limit |
|---|---|---|---|
| C01 · US average budget: 2026 minus 2025 | 226.58 − 199.38 = +27.20 US dollars | NRF / Prosper Insights & Analytics [S01]; NRF / Prosper Insights & Analytics [S02] F02 / F10 | Published rounded nominal planned budgets; not actual sales, inflation-adjusted growth or individual spending change. |
| C02 · US average-budget nominal growth | (226.58 ÷ 199.38 − 1) × 100 = +13.6 percent | NRF / Prosper Insights & Analytics [S01]; NRF / Prosper Insights & Analytics [S02] F02 / F10 | Published rounded nominal planned budgets; not actual sales, inflation-adjusted growth or individual spending change. |
| C03 · US projected total: 2026 minus 2025 | 27.9 − 24 = +3.9 US dollars billions | NRF / Prosper Insights & Analytics [S01]; NRF / Prosper Insights & Analytics [S02] F01 / F10 | Published rounded nominal planned budgets; not actual sales, inflation-adjusted growth or individual spending change. |
| C04 · US projected-total nominal growth | (27.9 ÷ 24 − 1) × 100 = +16.3 percent | NRF / Prosper Insights & Analytics [S01]; NRF / Prosper Insights & Analytics [S02] F01 / F10 | Published rounded nominal planned budgets; not actual sales, inflation-adjusted growth or individual spending change. |
| C05 · US planned celebration: 2026 minus 2025 | 77 − 76 = +1.0 percentage points | NRF / Prosper Insights & Analytics [S01]; NRF / Prosper Insights & Analytics [S02] F03 / F10 | Different annual survey samples; not a count of newly celebrating individuals or a significance test. |
| C06 · US online destination: 2026 minus 2025 | 38 − 41 = -3.0 percentage points | NRF / Prosper Insights & Analytics [S01]; NRF / Prosper Insights & Analytics [S02] F09 / F12 | Channel intentions can overlap; not an online sales-share change or an individual switch. |
| C07 · US department-store destination: 2026 minus 2025 | 37 − 35 = +2.0 percentage points | NRF / Prosper Insights & Analytics [S01]; NRF / Prosper Insights & Analytics [S02] F09 / F12 | Same published channel label, different annual respondents; no significance test added. |
| C08 · US discount-store destination: 2026 minus 2025 | 26 − 23 = +3.0 percentage points | NRF / Prosper Insights & Analytics [S01]; NRF / Prosper Insights & Analytics [S02] F09 / F12 | Not a transfer of shoppers from another channel; respondents can choose multiple destinations. |
| C09 · YouGov Mother’s Day minus Father’s Day yes responses | 47 − 34 = +13.0 percentage points | YouGov [S04] F16 / F15 | Same survey/wording, slightly different valid n (1,131/1,129). Not a measure of relative love or a paired significance test. |
| C10 · Parents of under-18s: Mother’s Day minus Father’s Day plans | 67 − 52 = +15.0 percentage points | YouGov [S04] F17 / F17 | Original YouGov article analysis; subgroup n and covariance not published. |
| C11 · Father’s Day plans: ages 18–29 minus 65+ | 50 − 18 = +32.0 percentage points | YouGov [S04] F18 / F18 | Cross-sectional citizens with valid n 295/227; not aging effects or subgroup uncertainty inferred from overall MOE. |
| C12 · Father’s Day plans: highest minus lowest published income band | 49 − 26 = +23.0 percentage points | YouGov [S04] F19 / F19 | Unadjusted association with valid n 278/411; no causal income effect inferred. |
| C13 · Australian gift-buying plans: 2026 minus 2025 | 23 − 20 = +3.0 percentage points | Australian Retail Council / Roy Morgan [S07] F48 / F48 | Retrospective prior-year benchmark in the 2026 original release; weighted proportions, not raw n fractions. |
| C14 · Australian buyer budget: 2026 minus 2025 | 135.00 − 145.00 = -10.00 Australian dollars | Australian Retail Council / Roy Morgan [S07] F50 / F50 | Published rounded nominal planned budgets; not actual sales, inflation-adjusted growth or individual spending change. |
| C15 · Australian meal plans minus gift-buying plans | 37 − 23 = +14.0 percentage points | Australian Retail Council / Roy Morgan [S07] F52 / F48 | Different questions among adults; not the share celebrating with a meal but buying no gift. No individual overlap is published. |
| C16 · Australian meal plans: 2026 minus 2025 | 37 − 28 = +9.0 percentage points | Australian Retail Council / Roy Morgan [S07] F52 / F52 | Combined home/restaurant/café intentions, not restaurant growth or unique participants beyond gift buyers. |
| C17 · Personalised preference: sentimental minus non-sentimental | 71.8 − 49.7 = +22.1 percentage points | Create Gift Love / Pollfish [S05] F32 / F32 | Selected gift shoppers; subgroup n unknown. Separate attitude marginals, not an individual overlap or causal effect. |
| C18 · Practical preference: non-sentimental minus sentimental | 74.6 − 61.4 = +13.2 percentage points | Create Gift Love / Pollfish [S05] F32 / F32 | No significance test or validation of sentimentality as a psychological trait. Practical can coexist with personalised. |
| C19 · Any-gift AI use: frequent plus occasional | 18.1 + 32.4 = +50.5 percent | Create Gift Love / Pollfish [S05] F23 / F23 | Sum of rounded mutually exclusive categories. Any-gift scope; not necessarily Father’s Day, and not a forecast. |
| C20 · Alone preference: zero-pressure agreement minus companionship choice | 23 − 3 = +20.0 percentage points | Drive Research [S06] F44 / F38 | Different question frames in the father sample. The 20-point contrast is not the share hiding a wish, a guilt effect or individual inconsistency. |
Why do the AI gift-shopping percentages differ?
The percentages answer different questions. A general gift idea, a Father’s Day-specific source, an expected future action and a purchase among prior AI users are not interchangeable.
| Figure | Scope and eligible base | Source |
|---|---|---|
| 8% | US non-fathers expected to celebrate; AI as a gift-idea source | Drive Research |
| 24.3% | Selected UK gift shoppers; Father’s Day-specific inspiration | Create Gift Love / Pollfish |
| 50.5% calculated | Selected UK gift shoppers; frequent plus occasional AI use for any gift | Create Gift Love / Pollfish |
| 51.5% | Prior AI gift-idea users only; purchase of a recommended gift | Create Gift Love / Pollfish |
| 45% | Savvy’s expected AI use; exact AI-item base not separately stated | Savvy Marketing |
The 50.5% figure is a sum of rounded 18.1% frequent and 32.4% occasional categories (C19). The guide does not rank countries or predict 2027 adoption. For the conditional purchase item, the valid AI-user n is not disclosed.
How was this research compiled and checked?
We checked original releases, original survey reports and the original YouGov questionnaire/cross-tabs. Each finding records its publisher, direct source link, publication label, actual period, geography, eligible population, disclosed sample information, definition, exact section or table locator, qualification and review date. Verification means checking a value as reported by its original publisher; it does not independently replicate the survey.
The 60 grouped findings contain 230 numeric source inputs across 11 original-source records and eight publishing/research groups. Related response categories stay grouped. Create Gift Love supplies 14 findings and Drive Research 13; no single study supplies a majority. NRF’s three holiday/annual records and Roy Morgan’s two annual releases are not presented as unrelated research organizations. Panel overlap and statistical independence are not established.
MyLittleDesire adds four original chart presentations, a source-comparison guide and 20 reproducible calculations. Exact inputs are used for subtractions and growth calculations; the greater-than value in the Canadian retailer case is not treated as an exact percentage. Monetary amounts remain in their original currencies, and historical figures keep their real years. No new confidence intervals, hypothesis tests, causal estimates or respondent-level overlaps are calculated.
Limitations that matter when quoting
- Most evidence is commercially produced. Several sources use selected shoppers, celebrants, gift buyers or fathers rather than all adults. Disclosed recruitment and weighting vary.
- Overall study n is not every question’s or subgroup’s valid n. YouGov supplies item-specific unweighted bases; its overall ±3.8-point margin is not an interval for every subgroup or calculated difference.
- NRF’s 2026 release ends fieldwork on May 6, while its landing page says May 5. The discrepancy is retained rather than silently resolved.
- We excluded conflicting overall struggle/personalisation values in Create Gift Love and conflicting spending passages in Drive Research. Unambiguous selected findings are retained as reported.
- What a father wants, what a non-father giver plans, what was remembered from last year and what someone agrees to in a hypothetical scenario are different measures.
- The Canadian case concerns Walmart category sales from a footnote labeled April–May 2024. It is not a current national spending or celebration benchmark.
- Savvy’s generic monthly n=1,000 is not assigned to its exact Father’s Day wave. Its AI-item base is less explicit than its meal/inspiration base.
- US, UK and Australian amounts have different currencies, populations and scopes. No national generosity ranking, purchasing-power comparison or inflation-adjusted trend is attempted.
- Neither Father’s Day spending nor choosing time alone is a diagnostic measure of family affection, relationship health or loneliness.
Questions publishers ask
Are these measured 2027 statistics?
No. This is the 2027 editorial edition, reviewed October 30, 2026. Calendar dates for 2027 are verified separately. The survey and sales periods remain beside each finding.
How much was US Father’s Day spending expected to reach?
NRF projected US$27.9 billion for 2026 and published a US$226.58 average planned budget. These are intentions, not an audited post-holiday sales result. NRF / Prosper Insights & Analytics.
What percentage planned to celebrate Father’s Day?
NRF reported 77% in its 2026 survey. YouGov’s differently framed do-anything question returned 34% among adult US citizens in April. Keep the source, question and base with either number.
What do fathers want most?
In Drive Research’s selected father sample, 88% wanted to spend the day with their children and 70% valued a personal or thoughtful gift. The study is not presented here as representative of every US father. Drive Research.
Do 23% of fathers secretly want to avoid their family?
The study does not establish that. Its 23% figure is agreement with a hypothetical day-alone preference with no guilt or social pressure. A separate companionship question returned 3% selecting alone. No individual cross-tab identifies hidden preferences. Drive Research.
Are practical gifts less thoughtful?
The UK selected-shopper study asks practical-versus-emotive and personalised-versus-non-personalised separately. Its marginal answers cannot establish that practical gifts lack meaning or how many people wanted both attributes. Create Gift Love / Pollfish.
What was the Australian average budget?
The 2026 ARC–Roy Morgan release reported A$135 per intended gift buyer, down from its A$145 prior-year benchmark. The currency and gift-buyer base should remain attached. Australian Retail Council / Roy Morgan.
Does the AI purchase percentage apply to everyone?
No. The 51.5% purchase figure concerns prior AI gift-idea users in a selected UK sample, with an any-gift scope. It is not the share of all adults buying Father’s Day gifts through AI. Create Gift Love / Pollfish.
Are the charts and comparisons original MyLittleDesire fieldwork?
No. Original organisations collected the underlying evidence. MyLittleDesire checked and organised the publications, added transparent arithmetic and created the chart presentations.
Can I reuse a chart?
Yes, with attribution to MyLittleDesire and the named original research source. Keep the population, dates and caveats visible. Link to the HTML context so readers can inspect the source definitions.
Complete original sources
- [S01] NRF / Prosper Insights & Analytics. Father’s Day Spending to Hit Record $27.9 Billion. Published 2026-06-10.
Actual period: 2026-04-30 to 2026-05-06 per release; landing page ends May 5.
Population: US adults 18+; celebration, shopping and spending bases vary by item. Overall/core report n=7,914.
Method: Annual consumer-intentions survey. NRF reports ±1.1 percentage points overall. Public release does not fully disclose recruitment, weighting or each item base.
Limits: Plans, not audited sales. Per-person amount is NRF’s published benchmark; do not invent its precise valid base or reconstruct total spending from rounded values. NRF’s own landing page and release differ by one day on fieldwork end.
Supporting originals: Original supporting document 1
Checked 2026-10-30. - [S02] NRF / Prosper Insights & Analytics. Father’s Day Spending to Reach Record $24 Billion. Published 2025-05-29.
Actual period: 2025-05-01 to 2025-05-07; retrospective 2024 benchmark labeled separately.
Population: US adult consumers; different celebration, shopper and age-group bases. Overall/core report n=8,225.
Method: Annual intentions survey; publisher reports ±1.1-point overall margin. Exact item/age bases, recruitment and weights not printed.
Limits: Historical nominal-dollar plans, not actual receipts. Different annual samples; no individual change or significance test inferred.
Checked 2026-10-30. - [S03] NRF / Prosper Insights & Analytics. Mother’s Day Spending Expected to Hit Record $38 Billion. Published 2026-04-21.
Actual period: 2026-04-01 to 2026-04-08; prior-year benchmarks explicitly marked.
Population: US adults; Mother’s Day spending/celebration bases, not identical to Father’s Day respondents. Overall/core report n=7,877.
Method: Annual consumer-intentions survey; publisher reports ±1.1-point overall margin. Recruitment/weights and item bases not fully disclosed.
Limits: Comparison context only. Separate holiday, dates and sample. Nominal planned budgets do not measure affection or completed spending.
Supporting originals: Original supporting document 1
Checked 2026-10-30. - [S04] YouGov. Mother’s Day and Father’s Day survey, April 2026. Published 2026-05-07 accompanying article.
Actual period: 2026-04-23 to 2026-04-28.
Population: US adult citizens 18+; item-specific valid bases and restricted upbringing base retained. Overall/core report n=1,134.
Method: Web interviews from YouGov’s opt-in panel, weighted by demographics, region and political/voter variables. PDF reports ±3.8-point overall margin adjusted for weighting.
Limits: Citizen target differs from all US adults. Valid item n differs from total; subgroup uncertainty is not the overall margin. Childhood recollections are retrospective, not current parenting behavior.
Supporting originals: Original supporting document 1
Checked 2026-10-30. - [S05] Create Gift Love / Pollfish. Father’s Day Gift Shopping Survey 2026. Published 2026-05-13.
Actual period: April 2026; recall item concerns Father’s Day 2025.
Population: Adults 18+ screened for planned Father’s Day gift buying; being a dad alone did not qualify. Overall/core report n=1,001.
Method: Pollfish survey: 1,541 sampled, 1,001 qualified. Publisher describes a 50/50 male/female design and claims 95% confidence/4% margin; these claims are not independently validated here.
Limits: Selected gift shoppers, not all UK adults or all fathers. Recruitment/weights, exact valid item and subgroup n not disclosed. Dads are a selected subset (about 30%), not a separate representative father sample. Some key-data/body values conflict and are withheld.
Checked 2026-10-30. - [S06] Drive Research. Father’s Day Statistics 2026: How Dads Want to Celebrate. Published 2026-05-29.
Actual period: May 2026; recalled events refer to Father’s Day 2025.
Population: 427 father respondents and 669 non-fathers expected to celebrate Father’s Day; total 1,096. Overall/core report n=1,096.
Method: Original US online survey. The methods identify father and non-father groups, with the celebration qualifier explicit for non-fathers. Exact field days, recruitment, weighting, item bases and relationship-status subgroup n are not published.
Limits: No national-representativeness claim is added. Fathers and givers are unmatched groups. Wants, recalled behavior, hypothetical guilt-free choices and actual actions differ. Conflicting spending passages are withheld.
Checked 2026-10-30. - [S07] Australian Retail Council / Roy Morgan. More shoppers, smaller splurges as Aussies prepare for Father’s Day. Published 2026-09-03.
Actual period: 2026-07-31 to 2026-08-04; earlier-year comparisons reported in same release.
Population: Australia-wide adults 18+; 1,061 respondents planned gift buying; decided-gift subgroup is smaller/undisclosed. Overall/core report n=4,977.
Method: Snap SMS survey of 4,977 adults, including 1,061 gift buyers. The release provides generic margin-of-error guidance; no estimate-specific intervals are calculated here.
Limits: Intentions and projected population totals, not actual spending. Weighted percentages need not equal unweighted sample shares. Gift mix is restricted to people who already know what they will buy. Rounded totals cannot be exactly rebuilt by multiplying published buyers and mean.
Supporting originals: Original supporting document 1
Checked 2026-10-30. - [S08] Australian Retailers Association / Roy Morgan. Fewer Shoppers, Bigger Splurges: Aussies Spending Up on Father’s Day Gifts. Published 2025-08-27.
Actual period: 2025 pre-holiday survey; exact field dates not given in release.
Population: Australian adult survey respondents; gift-buyer and all-adult bases differ. Exact wave/transaction n not published.
Method: Original joint research release. The retrieved issuer page does not disclose exact wave n, dates, weights or item bases.
Limits: Historical self-reported plans. The 2025 gift-category base differs from 2026’s decided-gift base, so no gift-category growth is calculated.
Checked 2026-10-30. - [S09] MyVoucherCodes / OnePoll. Brits are set to spend £10 More on Father’s Day than Mother’s Day this year. Published 2025-06-04.
Actual period: 2025-05-02 to 2025-05-10.
Population: UK adults in contact with their father/stepfather; gift buyers for spending and father subset for desired gifts. Overall/core report n=2,000.
Method: Online double-opt-in, compensated OnePoll respondents. Original notes supply field dates and overall n; weights/item and father-subgroup bases not given.
Limits: Commercial commissioned study; not all UK adults. Giving plans and father preferences are unmatched groups. The 2026 values found only in secondary coverage are not substituted for these verified 2025 results.
Checked 2026-10-30. - [S10] Walmart Connect Canada. Father’s Day 2025: first-party retail context. Published 2025-05-01.
Actual period: Walmart first-party data labeled April–May 2024; article describes the Father’s Day period.
Population: Walmart Canada category sales, not all Canadian consumers or all national sales. Exact wave/transaction n not published.
Method: Retailer’s original first-party sales analysis. Transaction counts, value-versus-unit metric and exact category observation windows are not disclosed.
Limits: Limited retailer case study, not a national celebration survey. Timing footnote is April–May 2024; do not silently convert to actual June holiday sales. Preserve the greater-than sign.
Checked 2026-10-30. - [S11] Savvy Marketing. Father’s Day spending to reach £1.3bn as retailers eye World Cup opportunity. Published 2026-06-10.
Actual period: 2026 pre-holiday survey; exact field dates not disclosed.
Population: Savvy shopper-panel respondents; meal/inspiration items specify planned celebrants, while the AI item base is not separately stated. Exact wave/transaction n not published.
Method: Original panel release. General panel page describes a monthly survey of 1,000 UK shoppers, but the article does not assign that n or field period to these findings.
Limits: Do not treat the general monthly panel size as this wave’s verified n. Full questionnaire, weights, subgroup base and uncertainty are unavailable. Intentions differ from actual behavior.
Supporting originals: Original supporting document 1
Checked 2026-10-30.
Calendar references are listed in the date table. Calendar dates are not included in the count of 60 research findings.
How to cite this resource
MyLittleDesire. Father’s Day Statistics 2027: Spending, Gifts and How Dads Want to Celebrate. https://mylittledesire.com/fathers-day-statistics/.