
Dating after 50 includes people with very different histories, goals and living arrangements. This resource brings original research together with its actual dates, age boundaries and eligible populations, then makes useful comparisons without treating every older single as an active dater.
What does a dating-over-50 statistic measure?
Check age, relationship status, seeking preference, reference period, question format and denominator before quoting a number.
| Term | What it measures | Interpretation |
|---|---|---|
| 50+, 60+ and 65+ | Different eligibility boundaries. | Over 50 in the title means 50+ unless a source-specific age band is stated. |
| Single / unpartnered / looking | Relationship status and seeking preferences. | Pew excludes committed romance from single; Marquette marital-status singles can include committed LAT partners. |
| Going on dates / using an app | Different reported activities. | Their separate marginal shares do not identify offline daters or how people met. |
| Ever / current / past-year use | Different reference windows. | Pew’s combined current-or-past-year measure is not SSRS current-only use. |
| Main versus major reason | One main goal versus multiple motives rated for importance. | Do not compare AARP main goals with Pew major motives as a trend. |
| Partnered people met online | A current-partner meeting route. | Not a probability that a new app user will find a partner. |
| Suspected attempt / fake profile / financial loss | Different experiences and evidentiary levels. | A combined fake-or-scam item and knowing a victim are not personal confirmed-loss rates. |
| LAT / cohabitation / marriage | Separate living and legal arrangements. | Living apart can be a committed relationship; the Canadian LAT measure excludes married/common-law people. |
| People / couples / transition events | Different counting units. | ONS individual counts are not couple counts; marital transitions are not always unique people. |
| Percentage points / years / interviewees | Units for percentage gaps, age differences and qualitative counts. | Keep units, denominators and sampling limits in every quotation. |
Key dating over 50 findings
52% / 26%
40% / 11%
Ages 50–59: summed non-never dating / app-use frequency.Marquette June 2026; C04/C01; separate marginal questions
Marquette University Law School Poll ·
Ages 60–69: summed non-never dating / app-use frequency.Marquette June 2026; C05/C02; exact subgroup n unavailable
Marquette University Law School Poll ·
21% / 7%
20% / 2%
Ages 70+: summed non-never dating / app-use frequency.Marquette June 2026; C06/C03; not a count of offline daters
Marquette University Law School Poll ·
Adults 50+ had ever used / were currently using online dating.SSRS January 2026; different reference windows
SSRS ·
23% / 14% / 12%
6%
Lifetime adoption in the 50s / 60s / 70+ age groups.Pew July 2022; historical, not current usage
Pew Research Center ·
Partnered adults 50+ met their current partner through online dating.Pew July 2022; partnered denominator, not an app success rate
Pew Research Center ·
49% / 36%
57% / 38%
Past-year users 50+ rated long-term partnership / casual dates a major reason.Pew July 2022; multiple major motives allowed
Pew Research Center
Women / men 50+ described their app experience negatively.Pew July 2022; ever-users; NETs retained
Pew Research Center ·
50% / 75%
47%
Singles ages 50–64 / 65+ were not looking for dates or a relationship.Pew October 2019; historical, singles-only denominator
Pew Research Center ·
App ever-users 50+ suspected they had encountered an attempted scam.Pew July 2022; not verified fraud or money lost
Pew Research Center ·
28% / 10%
97 of 100
Females / males 65+ were widowed.2024 ACS, BGSU analysis; demographic context, not dating interest
Bowling Green State University Center for Aging Families ·
Interviewees ages 60–83 considered sex very important to romance.UNH release February 2026; recruited interview group, not national prevalence
University of New Hampshire / Harris and Melanson ·
How many older singles go on dates or use dating apps?
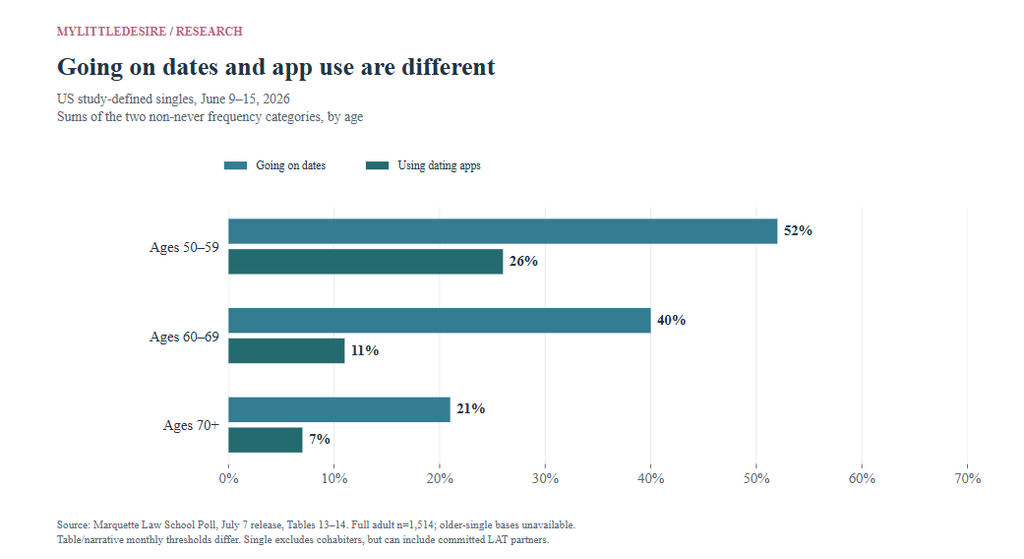
Marquette’s June 2026 survey lets readers compare two different activities within the same older age bands. Summing the two non-never frequency categories gives going-on-dates shares of 52%, 40% and 21% at ages 50–59, 60–69 and 70+, alongside app-use shares of 26%, 11% and 7%. These are separate marginal questions: their gaps do not identify how many people dated without apps. The study’s single definition can include committed partners living apart.
| ID | Finding and qualification | Population, actual period and base | Original source and locator |
|---|---|---|---|
| F01 | App-use frequencies at ages 50–59 were 9% in the highest listed category, 17% several times yearly and 74% never; at 60–69, 4%, 7% and 89%; at 70+, 4%, 3% and 93%. Definition: Table 13: usual dating-app use. Published highest-frequency heading is more than once a month. Qualification: Study-defined singles, not all adults. Exact age/item n unknown. Highest-frequency table heading and narrative differ; no new monthly cutoff inferred. Separate marginal questions cannot count app-free daters. | Study-defined single adults: never married, separated, divorced or widowed; excludes unmarried co-resident partners United States 2026-06-09 to 2026-06-15 Exact item/subgroup valid n is not printed beside these selected figures. An overall report n is not a subgroup base. | Marquette University Law School Poll Published 2026-07-07 July 7 original release / official archive, Table 13 Study methods and limits |
| F02 | Going-on-date frequencies at ages 50–59 were 24% in the highest listed category, 28% several times yearly and 48% never; at 60–69, 22%, 18% and 60%; at 70+, 8%, 13% and 79%. Definition: Table 14: usual frequency of going on dates, not only app-origin dates. Qualification: Study-defined singles, not all adults. Exact age/item n unknown. Highest-frequency table heading and narrative differ; no new monthly cutoff inferred. Separate marginal questions cannot count app-free daters. | Study-defined single adults: never married, separated, divorced or widowed; excludes unmarried co-resident partners United States 2026-06-09 to 2026-06-15 Exact item/subgroup valid n is not printed beside these selected figures. An overall report n is not a subgroup base. | Marquette University Law School Poll Published 2026-07-07 July 7 original release / official archive, Table 14 Study methods and limits |
How common is online dating after 50?
SSRS’s January 2026 poll found 20% of adults 50+ had ever used online dating, while 2% were currently using it. Pew’s July 2022 research reported 17% lifetime use, with substantial differences between older decades. These separate surveys are useful dated estimates, rather than a harmonized growth series. Platform history and meeting a current partner online use narrower denominators.
| ID | Finding and qualification | Population, actual period and base | Original source and locator |
|---|---|---|---|
| F18 | 20% of US adults 50+ had ever used dating sites/apps. Definition: Lifetime adoption. Qualification: Includes people currently partnered; it is not the share actively dating. Older valid n not supplied. | Adults 18+ overall; selected all-50+ and 50+ ever-user groups United States 2026-01-02 to 2026-01-04 and 2026-01-16 to 2026-01-20 Exact item/subgroup valid n is not printed beside these selected figures. An overall report n is not a subgroup base. | SSRS Published 2026-02-02 Original release: public use by age Study methods and limits |
| F19 | 2% of US adults 50+ were currently using dating sites/apps. Definition: Current use at the January survey. Qualification: Not past-year use. Do not compare with Pew’s combined current/past-year 3% as a current-use decline. | Adults 18+ overall; selected all-50+ and 50+ ever-user groups United States 2026-01-02 to 2026-01-04 and 2026-01-16 to 2026-01-20 Exact item/subgroup valid n is not printed beside these selected figures. An overall report n is not a subgroup base. | SSRS Published 2026-02-02 Original release: public use by age Study methods and limits |
| F20 | Among ever-users 50+, 36% had used Plenty of Fish, 33% Match and 28% Facebook Dating. Definition: Ever-use by platform; multiple platforms possible. Qualification: Not current brand share, success or a recommendation to spend. Exact 50+ ever-user n unavailable. | Adults 18+ overall; selected all-50+ and 50+ ever-user groups United States 2026-01-02 to 2026-01-04 and 2026-01-16 to 2026-01-20 Exact item/subgroup valid n is not printed beside these selected figures. An overall report n is not a subgroup base. | SSRS Published 2026-02-02 Original release: platforms used by age Study methods and limits |
| F03 | 17% of adults 50+ had ever used dating sites/apps: 23% in their 50s, 14% in their 60s and 12% at 70+. Definition: Lifetime app/site adoption, not current use or dating interest. Qualification: Historical July 2022 responses; selected older subgroup valid n not supplied. Preserve the population, period and item wording. | US adults in the specified older age groups United States 2022-07-05 to 2022-07-17 Exact item/subgroup valid n is not printed beside these selected figures. An overall report n is not a subgroup base. | Pew Research Center Published Older-adult analysis 2023-07-17; full report 2023-02-02; singles analysis 2023-02-08 Older-adult analysis finding 1; chart 1 Study methods and limits |
| F04 | 3% of adults 50+ currently used dating sites/apps or had used them within the past year, compared with 15% under 50. Definition: Combined current/recent measure, not current-only. Qualification: Historical July 2022 responses; selected older subgroup valid n not supplied. Preserve the population, period and item wording. | US adults 50+ versus under 50 United States 2022-07-05 to 2022-07-17 Exact item/subgroup valid n is not printed beside these selected figures. An overall report n is not a subgroup base. | Pew Research Center Published Older-adult analysis 2023-07-17; full report 2023-02-02; singles analysis 2023-02-08 Older-adult analysis finding 1 Study methods and limits |
| F05 | 6% of partnered adults 50+ first met their current partner through online dating. Definition: Partnered means married, cohabiting or in a committed romantic relationship. Qualification: Not the probability an app user will find a partner; denominator excludes unpartnered adults and includes people who never used apps. | US partnered adults ages 50+ United States 2022-07-05 to 2022-07-17 Exact item/subgroup valid n is not printed beside these selected figures. An overall report n is not a subgroup base. | Pew Research Center Published Older-adult analysis 2023-07-17; full report 2023-02-02; singles analysis 2023-02-08 Older-adult analysis finding 1; PRTNRONL Study methods and limits |
| F06 | Among ever-users, 50% of those 50+ had used Match versus 24% under 50; Tinder shares were 11% versus 59%. Definition: Platform ever-use can overlap across brands. Qualification: Historical brand history, not current share or comparative effectiveness. More than one platform can be selected. | US dating-site/app ever-users in the specified age groups United States 2022-07-05 to 2022-07-17 Exact item/subgroup valid n is not printed beside these selected figures. An overall report n is not a subgroup base. | Pew Research Center Published Older-adult analysis 2023-07-17; full report 2023-02-02; singles analysis 2023-02-08 Older-adult analysis finding 2; chart 2 Study methods and limits |
| F07 | Tinder ever-use was 19% among online daters in their 50s, 6% in their 60s and 1% at 70+. Definition: Platform use conditional on having ever used online dating. Qualification: Historical July 2022 responses; selected older subgroup valid n not supplied. Preserve the population, period and item wording. | US online-dating ever-users in each older decade United States 2022-07-05 to 2022-07-17 Exact item/subgroup valid n is not printed beside these selected figures. An overall report n is not a subgroup base. | Pew Research Center Published Older-adult analysis 2023-07-17; full report 2023-02-02; singles analysis 2023-02-08 Older-adult analysis finding 2; chart 2 Study methods and limits |
Do older online daters want commitment or casual dates?
There is more than one goal. Pew’s 2022 past-year users 50+ could rate multiple major reasons: 49% cited a long-term partner and 36% casual dates. AARP’s dedicated recent-user report instead describes main goals, with 39% casual dating or meeting people and 38% long-term romance. Different questions, sampling and reference periods prevent reading their contrast as a change in older people’s intentions.
| ID | Finding and qualification | Population, actual period and base | Original source and locator |
|---|---|---|---|
| F08 | For past-year users 50+, major motives were a long-term partner 49%, casual dates 36%, casual sex 22% and friends 30%. Under-50 figures were 43%, 41%, 25% and 20%. Definition: Several motives could be rated major. Qualification: Major reasons overlap. Pew says age groups cite similar reasons; descriptive gaps do not establish significant age differences. Older long-term value is 49%, not an invented exact 50%. | US past-year dating-site/app users, 50+ versus 18–49 United States 2022-07-05 to 2022-07-17 Exact item/subgroup valid n is not printed beside these selected figures. An overall report n is not a subgroup base. | Pew Research Center Published Older-adult analysis 2023-07-17; full report 2023-02-02; singles analysis 2023-02-08 Older-adult analysis finding 3; visually checked chart 3 Study methods and limits |
| F28 | Main goals were casual dating/meeting people 39%, long-term romance 38% and sexual relationships 8%. Definition: Reported main-goal options; selected categories, not an exhaustive 100% distribution. Qualification: Published dedicated-report values confirmed. Field date is reported as January 2026, but related AARP pages mention 2025; not reconciled. Recruitment/weighting and complete questionnaire unavailable. Not all adults 50+. | Adults 50+ who had used online dating in the previous three years United States reporting context; precise geographic eligibility not established Dedicated report states January 2026; related AARP reviews refer to 2025, unresolved provenance Exact item/subgroup valid n is not printed beside these selected figures. An overall report n is not a subgroup base. | AARP Smart Picks Published 2026-10-23 Dedicated report, takeaway 1 Study methods and limits |
How do experiences and paid use differ by age and gender?
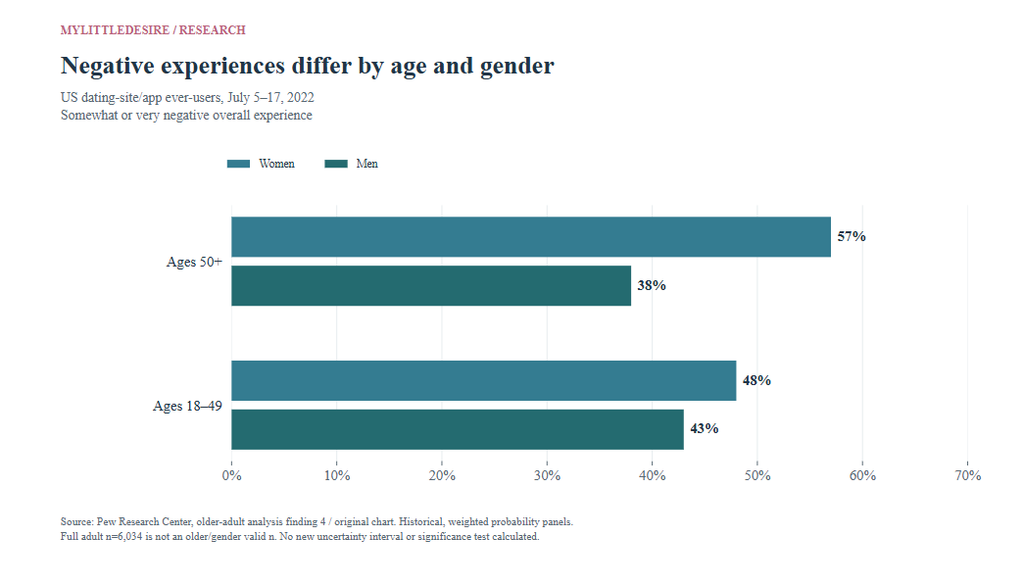
In Pew’s 2022 ever-users, 57% of women 50+ and 38% of men 50+ described their experience negatively. Among those 18–49, the figures were 48% and 43%. The descriptive gender gaps are 19 and 5 percentage points. Paying for a platform was also more common among men in the selected older age groups, but payment does not demonstrate greater success or value.
| ID | Finding and qualification | Population, actual period and base | Original source and locator |
|---|---|---|---|
| F09 | Negative experiences were reported by 57% of women and 38% of men 50+, compared with 48% of women and 43% of men ages 18–49. Definition: Somewhat/very negative NET, not a count of failed relationships. Qualification: Retain published NETs despite rounding; group n unavailable. New gap arithmetic is descriptive, not a tested age×gender effect or causal explanation. | US dating-site/app ever-users by age and gender United States 2022-07-05 to 2022-07-17 Exact item/subgroup valid n is not printed beside these selected figures. An overall report n is not a subgroup base. | Pew Research Center Published Older-adult analysis 2023-07-17; full report 2023-02-02; singles analysis 2023-02-08 Older-adult analysis finding 4; visually checked chart 4 Study methods and limits |
| F10 | Among ever-users ages 50–64, 51% of men and 38% of women had paid; at 65+, 57% of men and 35% of women had paid. Definition: Ever paid for use or extra features. Qualification: Payment history is not proof of value, safety or finding a partner; exact subgroup bases unavailable. | US dating-site/app ever-users in each age/gender group United States 2022-07-05 to 2022-07-17 Exact item/subgroup valid n is not printed beside these selected figures. An overall report n is not a subgroup base. | Pew Research Center Published Older-adult analysis 2023-07-17; full report 2023-02-02; singles analysis 2023-02-08 Older-adult analysis finding 5; visually checked chart 5 Study methods and limits |
What do the available app-outcome figures actually measure?
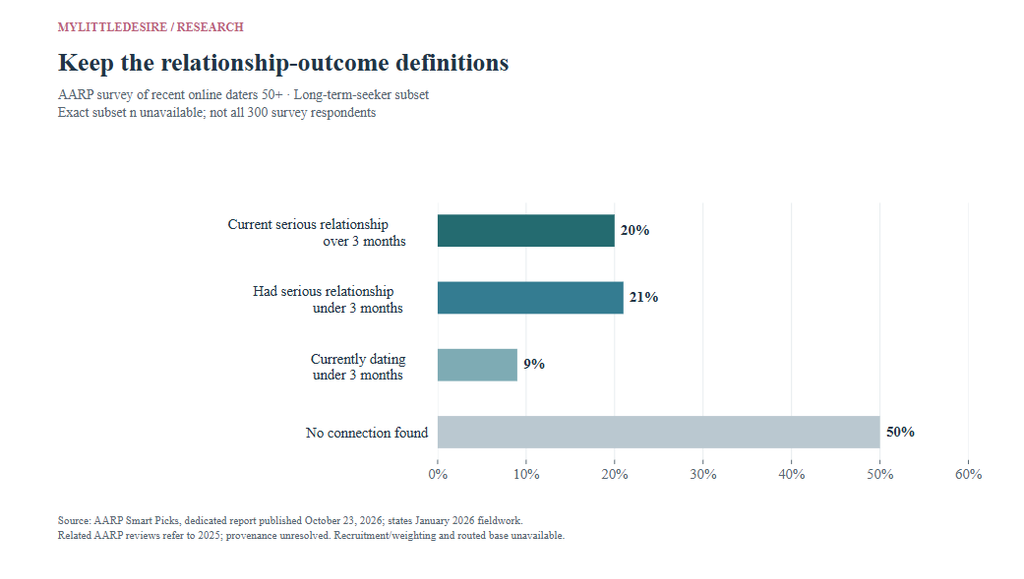
AARP’s dedicated report describes outcomes among respondents seeking a long-term partner, rather than all 300 participants. It mixes current and prior relationship descriptions and does not print that subset’s exact valid sample size. Keep those definitions when quoting it. Satisfaction, recommending an app and paying for features measure different things from forming a lasting partnership. The report states January 2026 fieldwork; related AARP reviews refer to 2025, an unresolved provenance limitation.
| ID | Finding and qualification | Population, actual period and base | Original source and locator |
|---|---|---|---|
| F29 | Among long-term seekers, 20% were currently in a serious relationship over three months, 21% had a serious relationship under three months, 9% were currently dating under three months and 50% had not found a connection. Definition: Source’s outcome wording mixes current and prior relationship descriptions. Qualification: Published dedicated-report values confirmed. Field date is reported as January 2026, but related AARP pages mention 2025; not reconciled. Recruitment/weighting and complete questionnaire unavailable. Not all adults 50+. | Subset seeking a long-term partner; exact valid n not published, not all 300 United States reporting context; precise geographic eligibility not established Dedicated report states January 2026; related AARP reviews refer to 2025, unresolved provenance Exact item/subgroup valid n is not printed beside these selected figures. An overall report n is not a subgroup base. | AARP Smart Picks Published 2026-10-23 Dedicated report, takeaway 2 Study methods and limits |
| F30 | 65% were completely/somewhat satisfied overall and 59% likely/very likely to recommend the app to a friend. Definition: Two different overall evaluations, not partner formation. Qualification: Published dedicated-report values confirmed. Field date is reported as January 2026, but related AARP pages mention 2025; not reconciled. Recruitment/weighting and complete questionnaire unavailable. Not all adults 50+. | Adults 50+ who had used online dating in the previous three years United States reporting context; precise geographic eligibility not established Dedicated report states January 2026; related AARP reviews refer to 2025, unresolved provenance Exact item/subgroup valid n is not printed beside these selected figures. An overall report n is not a subgroup base. | AARP Smart Picks Published 2026-10-23 Dedicated report, takeaway 2 Study methods and limits |
| F32 | 52% paid for special features or upgrades; 48% did not. Definition: Reported payment in this recent-user survey. Qualification: Published dedicated-report values confirmed. Field date is reported as January 2026, but related AARP pages mention 2025; not reconciled. Recruitment/weighting and complete questionnaire unavailable. Not all adults 50+. | Adults 50+ who had used online dating in the previous three years United States reporting context; precise geographic eligibility not established Dedicated report states January 2026; related AARP reviews refer to 2025, unresolved provenance Exact item/subgroup valid n is not printed beside these selected figures. An overall report n is not a subgroup base. | AARP Smart Picks Published 2026-10-23 Dedicated report, takeaway 4 Study methods and limits |
Does being single mean someone wants a date?
No. In Pew’s October 2019 research, half of singles ages 50–64 and three-quarters at 65+ were not looking for dates or a relationship. The Senior List’s later nonprobability surveys also distinguish interest in marriage from willingness to date. These historical or sample-specific observations show why singlehood cannot be treated as the size of an available dating market.
| ID | Finding and qualification | Population, actual period and base | Original source and locator |
|---|---|---|---|
| F15 | In 2019, 28% of adults 50–64 and 36% at 65+ were single. At 50–64 the shares were 27% of men and 29% of women; at 65+, 21% and 49%. Definition: Pew single excludes marriage, cohabitation and committed romance. Qualification: Historical status, not dating interest or activity. Age/gender valid n unavailable. | Adults 18+; selected age groups and single/non-looking subsets United States 2019-10-16 to 2019-10-28 Exact item/subgroup valid n is not printed beside these selected figures. An overall report n is not a subgroup base. | Pew Research Center Published 2020-08-20 Profile section on singlehood by age/gender Study methods and limits |
| F16 | 50% of singles ages 50–64 and 75% at 65+ were not looking for a relationship or dates. Definition: SEEKING among singles, not all older adults. Qualification: Historical October 2019; not evidence older people cannot date or a current estimate. | Adults 18+; selected age groups and single/non-looking subsets United States 2019-10-16 to 2019-10-28 Exact item/subgroup valid n is not printed beside these selected figures. An overall report n is not a subgroup base. | Pew Research Center Published 2020-08-20 Profile section: many singles not looking Study methods and limits |
| F17 | Among non-looking singles, feeling too old was a major reason for 25% at 50+ versus 4% under 50; other priorities were major reasons for 38% versus 61%. Definition: Different age groups within singles who were not currently seeking dates/commitment. Qualification: Not percentages of all older people. Several reasons could apply; no causal mechanism or universal age barrier follows. | Adults 18+; selected age groups and single/non-looking subsets United States 2019-10-16 to 2019-10-28 Exact item/subgroup valid n is not printed beside these selected figures. An overall report n is not a subgroup base. | Pew Research Center Published 2020-08-20 Profile non-dater reasons; footnote explains 50-year cutoff Study methods and limits |
| F14 | 26% of single-and-looking adults 50+ had used a dating platform in the past year, compared with 53% of those under 50. Definition: Past-year use within a restricted single-and-looking population. Qualification: Not 26% of all adults 50+. Pew singles exclude committed romantic relationships; Marquette’s marital-status definition differs. | US singles looking for dates or commitment, by age United States 2022-07-05 to 2022-07-17 Exact item/subgroup valid n is not printed beside these selected figures. An overall report n is not a subgroup base. | Pew Research Center Published Older-adult analysis 2023-07-17; full report 2023-02-02; singles analysis 2023-02-08 Full report printed p.20; singles analysis Study methods and limits |
| F21 | 43% of surveyed men 50+ and 27% of surveyed women 50+ were interested in dating. Definition: Survey-defined unmarried singles, by gender. Qualification: Online publisher surveys with unreconciled stage/item bases. Not a nationally representative prevalence estimate; exact n for selected groups unavailable. | Survey-defined unmarried singles 50+; initial n=1,232; follow-up n=488 United States November 2024 initial poll; December 2024 follow-up Exact item/subgroup valid n is not printed beside these selected figures. An overall report n is not a subgroup base. | The Senior List Published 2025-02-10 Key findings; section on older singles open to dating Study methods and limits |
| F22 | 87% of those not seeking romance cited happiness without a romantic relationship; 59% cited worries about apps or meeting strangers. Definition: Reasons for not seeking dating/romance, rather than all singles. Qualification: Online publisher surveys with unreconciled stage/item bases. Not a nationally representative prevalence estimate; exact n for selected groups unavailable. | Survey-defined unmarried singles 50+; initial n=1,232; follow-up n=488 United States November 2024 initial poll; December 2024 follow-up Exact item/subgroup valid n is not printed beside these selected figures. An overall report n is not a subgroup base. | The Senior List Published 2025-02-10 Key findings; reasons for not dating Study methods and limits |
| F23 | 37% were open to marriage; among that group, 30% were also open to dating and 70% were not. Definition: Published conditional overlap, not inferred by subtracting independent margins. Qualification: Online publisher surveys with unreconciled stage/item bases. Not a nationally representative prevalence estimate; exact n for selected groups unavailable. | Survey-defined unmarried singles 50+; initial n=1,232; follow-up n=488 United States November 2024 initial poll; December 2024 follow-up Exact item/subgroup valid n is not printed beside these selected figures. An overall report n is not a subgroup base. | The Senior List Published 2025-02-10 Key findings; dating as an obstacle to lasting love Study methods and limits |
How do older singles seek connection and support?
The Senior List reports a mix of social routes and no proactive effort among respondents open to romance. Its findings also describe hypothetical willingness to reconsider dating, close-friend support and advice themes. Recruitment, weighting and selected question bases are not fully documented, so these results describe the publisher’s respondents without claiming nationally representative prevalence or proven dating advice.
| ID | Finding and qualification | Population, actual period and base | Original source and locator |
|---|---|---|---|
| F24 | Among romance-open respondents, 44% took no proactive steps; 24% used social media, 22% hobby/church groups, 14% family/friends and 10% professional/social events. Definition: Reported ways of seeking partners; multiple methods may coexist. The source also says about one-third used dating apps. Qualification: Online publisher surveys with unreconciled stage/item bases. Not a nationally representative prevalence estimate; exact n for selected groups unavailable. | Survey-defined unmarried singles 50+; initial n=1,232; follow-up n=488 United States November 2024 initial poll; December 2024 follow-up Exact item/subgroup valid n is not printed beside these selected figures. An overall report n is not a subgroup base. | The Senior List Published 2025-02-10 How older adults date; past-year effort descriptions Study methods and limits |
| F25 | 66% of those not seeking romance would reconsider under the right circumstances or with the right person. Definition: Hypothetical willingness, not observed return to dating. Qualification: Online publisher surveys with unreconciled stage/item bases. Not a nationally representative prevalence estimate; exact n for selected groups unavailable. | Survey-defined unmarried singles 50+; initial n=1,232; follow-up n=488 United States November 2024 initial poll; December 2024 follow-up Exact item/subgroup valid n is not printed beside these selected figures. An overall report n is not a subgroup base. | The Senior List Published 2025-02-10 Finding hope; published 66% callout Study methods and limits |
| F26 | 20% of surveyed singles 50+ had at most one close friend. Definition: Support-network context, separate from dating intentions. Qualification: Online publisher surveys with unreconciled stage/item bases. Not a nationally representative prevalence estimate; exact n for selected groups unavailable. | Survey-defined unmarried singles 50+; initial n=1,232; follow-up n=488 United States November 2024 initial poll; December 2024 follow-up Exact item/subgroup valid n is not printed beside these selected figures. An overall report n is not a subgroup base. | The Senior List Published 2025-02-10 How older adults date; friendship paragraph Study methods and limits |
| F27 | Coded advice themes included taking time 38%, knowing oneself 30%, compatibility 25%, caution 22%, friendship first 20%, and honesty/communication 18%. Definition: Publisher-reported themes in answers about advice to younger people; selected themes. Qualification: Online publisher surveys with unreconciled stage/item bases. Not a nationally representative prevalence estimate; exact n for selected groups unavailable. | Survey-defined unmarried singles 50+; initial n=1,232; follow-up n=488 United States November 2024 initial poll; December 2024 follow-up Exact item/subgroup valid n is not printed beside these selected figures. An overall report n is not a subgroup base. | The Senior List Published 2025-02-10 Published advice table Study methods and limits |
What do the studies say about unwanted experiences and scams?
Pew’s 2022 figures concern suspected scam attempts and unwanted platform experiences; they are not verified financial-loss rates. AARP’s research among all adults 50+ combines personal losses with knowing someone who lost money. Perceived safety, self-rated knowledge, fake profiles and actual losses remain separate measures. The research below explains their different populations and definitions.
| ID | Finding and qualification | Population, actual period and base | Original source and locator |
|---|---|---|---|
| F11 | 47% of ever-users 50+ suspected an attempted scam; age-band shares were 52% at 50–64 and 39% at 65+. Definition: Self-reported encounter with someone thought to be trying to scam them. Qualification: Suspected attempt, not verified fraud, money lost or a current annual victimization rate. | US dating-site/app ever-users ages 50+ United States 2022-07-05 to 2022-07-17 Exact item/subgroup valid n is not printed beside these selected figures. An overall report n is not a subgroup base. | Pew Research Center Published Older-adult analysis 2023-07-17; full report 2023-02-02; singles analysis 2023-02-08 Older-adult analysis finding 6 Study methods and limits |
| F12 | 45% of ever-users 50+ reported at least one of four unwanted behaviors: unsolicited explicit content 33%, continued unwanted contact 26%, offensive naming 17% and threats 4%. Definition: Published any-behavior NET and four overlapping lifetime platform-experience items. Qualification: Do not add overlapping behaviors to derive a union, label all as criminal acts or turn lifetime experience into annual incidence. | US dating-site/app ever-users ages 50+ United States 2022-07-05 to 2022-07-17 Exact item/subgroup valid n is not printed beside these selected figures. An overall report n is not a subgroup base. | Pew Research Center Published Older-adult analysis 2023-07-17; full report 2023-02-02; singles analysis 2023-02-08 Older-adult analysis finding 7 Study methods and limits |
| F13 | 53% of adults ages 50–64 and 62% at 65+ considered online dating not too safe or not at all safe. Definition: Perceived safety among adults, including nonusers. Qualification: Safety perception is not measured victimization or a probability that a date will be unsafe. | US adults in the stated older age groups United States 2022-07-05 to 2022-07-17 Exact item/subgroup valid n is not printed beside these selected figures. An overall report n is not a subgroup base. | Pew Research Center Published Older-adult analysis 2023-07-17; full report 2023-02-02; singles analysis 2023-02-08 Full report printed p.15, age chart; key-findings analysis Study methods and limits |
| F31 | 41% reported a fake profile or someone trying to scam them. Definition: Combined fake-profile or suspected-scam item. Qualification: Published dedicated-report values confirmed. Field date is reported as January 2026, but related AARP pages mention 2025; not reconciled. Recruitment/weighting and complete questionnaire unavailable. Not all adults 50+. | Adults 50+ who had used online dating in the previous three years United States reporting context; precise geographic eligibility not established Dedicated report states January 2026; related AARP reviews refer to 2025, unresolved provenance Exact item/subgroup valid n is not printed beside these selected figures. An overall report n is not a subgroup base. | AARP Smart Picks Published 2026-10-23 Dedicated report, takeaway 3 Study methods and limits |
| F33 | 16% said they or someone they knew had lost money to a romance scam. Definition: Personal-or-known-person experience, a combined measure. Qualification: Not a 16% personal loss prevalence. Exact selected question wording and intervals not available. | Adults ages 50+ United States Mid-November 2025 Exact item/subgroup valid n is not printed beside these selected figures. An overall report n is not a subgroup base. | AARP Research / NORC Published Web release 2026-02-02; suggested report citation January 2026 Original research release: losses Study methods and limits |
| F34 | 45% said they did not feel knowledgeable about romance-scam tactics. Definition: Self-rated knowledge, not a tested detection score. Qualification: Not proof of inability to detect a specific scam, and not an app-user-only estimate. | Adults ages 50+ United States Mid-November 2025 Exact item/subgroup valid n is not printed beside these selected figures. An overall report n is not a subgroup base. | AARP Research / NORC Published Web release 2026-02-02; suggested report citation January 2026 Original research release: knowledge Study methods and limits |
| F35 | 62% viewed victims as targets of crime; 60% considered them naïve or too trusting. Definition: Different attitude statements about victims. Qualification: Opinions can overlap; do not add percentages, infer individual inconsistency or blame victims. Full item wording not accessible. | Adults ages 50+ United States Mid-November 2025 Exact item/subgroup valid n is not printed beside these selected figures. An overall report n is not a subgroup base. | AARP Research / NORC Published Web release 2026-02-02; suggested report citation January 2026 Original research release: stigma Study methods and limits |
How does relationship status vary across later life?
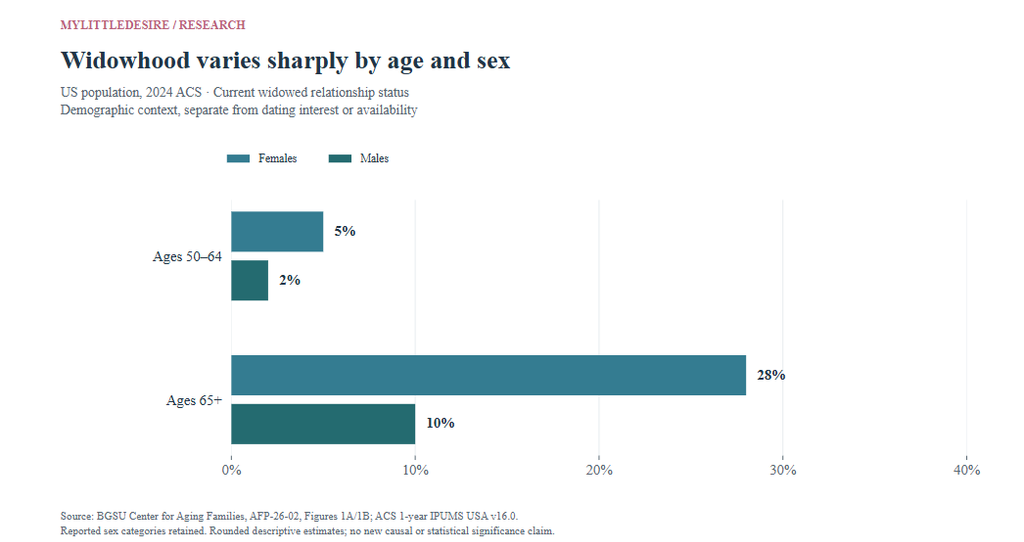
BGSU’s analysis of 2024 American Community Survey data provides population context. At 65+, 28% of females and 10% of males were widowed; at 50–64, the shares were 5% and 2%. These differences do not establish who is seeking a relationship. Current status, lifetime marriage counts and marital-transition events answer separate demographic questions.
| ID | Finding and qualification | Population, actual period and base | Original source and locator |
|---|---|---|---|
| F36 | In 2024 at ages 50–64, female shares married/cohabiting/divorced-or-separated/widowed/never-married were 61/5/19/5/10%; male shares were 66/6/14/2/12%. Definition: Five current relationship-status groups, by reported sex. Qualification: Population context, not who wants dates or is available to date. Rounded categories may not total 100%; cohabiters are classified separately. | US adults ages 50–64, by reported sex United States 2024 Exact item/subgroup valid n is not printed beside these selected figures. An overall report n is not a subgroup base. | Bowling Green State University Center for Aging Families Published 2026; page displays updated 05/12/2026 Figure 1A Study methods and limits |
| F37 | In 2024 at ages 65+, female shares married/cohabiting/divorced-or-separated/widowed/never-married were 46/2/17/28/6%; male shares were 68/3/13/10/7%. Definition: Five current relationship-status groups, by reported sex. Qualification: Population context, not who wants dates or is available to date. Rounded categories may not total 100%; cohabiters are classified separately. | US adults ages 65+, by reported sex United States 2024 Exact item/subgroup valid n is not printed beside these selected figures. An overall report n is not a subgroup base. | Bowling Green State University Center for Aging Families Published 2026; page displays updated 05/12/2026 Figure 1B Study methods and limits |
| F38 | About 2.8 million adults 50+ experienced a marital transition in the previous year. Definition: Source’s approximate count of adults experiencing marriage, divorce or widowhood. Qualification: Not the number entering the dating market. The following event mix uses transitions; some people experienced more than one. | Adults ages 50–64 and 65+, by reported sex; transition figures use events rather than every person United States 2024 ACS: marital transitions in previous 12 months Exact item/subgroup valid n is not printed beside these selected figures. An overall report n is not a subgroup base. | Bowling Green State University Center for Aging Families Published 2026; page displays updated 05/12/2026 Introductory paragraph and Figure 2 notes Study methods and limits |
| F39 | Among marital transitions at 50+, male events were 39% widowhood, 32% divorce and 29% marriage; female events were 62%, 22% and 16%. Definition: Composition of transition events, by sex. Qualification: Denominator is transitions, not all adults, all singles or a longitudinal chance of marrying. Some people had more than one transition. | Marital transitions among US adults 50+, by sex United States 2024 ACS: marital transitions in previous 12 months Exact item/subgroup valid n is not printed beside these selected figures. An overall report n is not a subgroup base. | Bowling Green State University Center for Aging Families Published 2026; page displays updated 05/12/2026 Figure 2 and notes Study methods and limits |
| F40 | At 50–64, females had married zero/one/two/three-plus times in shares of 12/63/20/6%; male shares were 14/62/19/5%. Definition: Lifetime number of marriages, separate from current relationship status. Qualification: Zero lifetime marriages can include cohabiters. Do not substitute these for Figure 1’s never-married noncohabiting status category or treat multiple marriages as current dating. Rounding retained. | US adults ages 50–64, by sex United States 2024 Exact item/subgroup valid n is not printed beside these selected figures. An overall report n is not a subgroup base. | Bowling Green State University Center for Aging Families Published 2026; page displays updated 05/12/2026 Figure 3A, visually checked Study methods and limits |
Do older couples always marry or live with a same-age partner?
In BGSU’s 2023 ACS couple analysis, 6% of couples with at least one partner 50+ were cohabiting and 94% married. Both partners need not be over 50. Published average age gaps were seven years for cohabiting couples and four for married couples. Those averages describe existing couples; they do not measure desired age gaps or the effects of living together.
| ID | Finding and qualification | Population, actual period and base | Original source and locator |
|---|---|---|---|
| F41 | 6% of couples with at least one partner 50+ were cohabiting and 94% married. Definition: Couple-level classification, not all older people. Qualification: Both partners need not be 50+. Couples with neither partner 50+ and unpartnered adults are outside this denominator. | Couples with at least ONE partner age 50+; unit is couple/household head, not all older adults United States 2023 American Community Survey Exact item/subgroup valid n is not printed beside these selected figures. An overall report n is not a subgroup base. | Bowling Green State University NCFMR Published 2025 PDF p.1, relationship status and definition Study methods and limits |
| F42 | Among those cohabiting couples, 55% had two previously married partners, 29% one and 16% neither. Definition: Previous marriage of partners in cohabiting couples with at least one partner 50+. Qualification: Not percentages of all older adults or a measure of their interest in remarriage. Married-couple comparison with a 19%/20% source conflict is withheld. | Couples with at least ONE partner age 50+; unit is couple/household head, not all older adults United States 2023 American Community Survey Exact item/subgroup valid n is not printed beside these selected figures. An overall report n is not a subgroup base. | Bowling Green State University NCFMR Published 2025 PDF p.1, marital-history chart Study methods and limits |
| F43 | Mean partner age difference was seven years for cohabiting couples and four for married couples. Definition: Published mean age gaps within couples with at least one partner 50+. Qualification: A cross-sectional couple characteristic, not a desired age gap, dating advice or causal effect of cohabitation. | Couples with at least ONE partner age 50+; unit is couple/household head, not all older adults United States 2023 American Community Survey Exact item/subgroup valid n is not printed beside these selected figures. An overall report n is not a subgroup base. | Bowling Green State University NCFMR Published 2025 PDF p.2, Age Differences Study methods and limits |
What can historical research tell us about living apart together?
Statistics Canada’s 2011 findings show that a later-life relationship can involve separate homes. They are historical context: 2.3% of adults 60+ were in living-apart-together relationships, while 37% of the older LAT group cited independence. These figures are not current Canadian dating estimates, and their age-60+ boundary cannot be silently replaced with 50+.
| ID | Finding and qualification | Population, actual period and base | Original source and locator |
|---|---|---|---|
| F44 | Among Canadians 60+, living apart together rose from 1.8% in 2001 to 2.3% in 2011. Definition: LAT: intimate couple living in separate homes; neither married nor common-law. Qualification: Historical age-60+ population estimate, not current 50+ dating or an international ranking. Married people living apart are classified separately. | Canadian adults ages 60+ Canada 2001 and 2011 Exact item/subgroup valid n is not printed beside these selected figures. An overall report n is not a subgroup base. | Statistics Canada Published 2013-03-05; archived historical article Table 2, ages 60+ Study methods and limits |
| F45 | For LAT respondents 60+, mean relationship duration was 7.5 years, compared with 2.3 years at 20–29. Definition: Duration so far of ongoing LAT relationships at interview. Qualification: Cross-sectional historical durations, not expected future length or a survival analysis. Do not claim older relationships last 7.5 years in general. | Canadian LAT respondents in the stated ages Canada 2011 Exact item/subgroup valid n is not printed beside these selected figures. An overall report n is not a subgroup base. | Statistics Canada Published 2013-03-05; archived historical article Relationship duration discussion Study methods and limits |
| F46 | 37% of LAT respondents 60+ lived apart to preserve independence; the shares were 46% among women and 30% among men. Definition: Reason for separate homes among people already in LAT relationships. Qualification: Not percentages of all older adults. Historical 2011 data; selected age/gender item bases unavailable. | Canadian LAT respondents ages 60+ Canada 2011 Exact item/subgroup valid n is not printed beside these selected figures. An overall report n is not a subgroup base. | Statistics Canada Published 2013-03-05; archived historical article Independence discussion and footnote 14 Study methods and limits |
| F47 | 42% of LAT respondents 60+ had a non-transitional LAT relationship, compared with 11% of LAT respondents overall. Definition: Source definition: living apart by choice and no intention to live together. Qualification: Not 42% of all older people or proof that every LAT couple rejects cohabitation. Historical 2011; all-adult group includes the older group. | Canadian LAT respondents: 60+ and all adults 20+ Canada 2011 Exact item/subgroup valid n is not printed beside these selected figures. An overall report n is not a subgroup base. | Statistics Canada Published 2013-03-05; archived historical article Non-transitional LAT section Study methods and limits |
What do interviews reveal about intimacy after 60?
A university-reported study interviewed 100 online-dating singles ages 60–83. It found 97 interviewees regarded sex as very important to a romantic relationship and 72 would not pursue one without sexual activity. These are counts within a recruited qualitative group. They cannot establish that 97% or 72% of all older adults share those views. The linked full journal paper was inaccessible during this review.
| ID | Finding and qualification | Population, actual period and base | Original source and locator |
|---|---|---|---|
| F48 | 97 of 100 interviewees said sex was very important in a romantic relationship. Definition: Count in a recruited group of online-dating singles ages 60–83. Qualification: Not a national 97% prevalence claim. Original university release verified; full journal paper, field dates and geographic eligibility not audited. | Online-dating singles ages 60–83; 50 men and 50 women Geographic eligibility not established from accessible original release Interview collection dates not established from accessible original university release Published eligible item/group base(s): 100. An overall report n is not a subgroup base. | University of New Hampshire / Harris and Melanson Published University release 2026-02-26 Original university release: intimacy and sample Study methods and limits |
| F49 | 72 of 100 would not pursue a relationship without sexual activity: 36 men and 36 women. Definition: Interview counts, not a representative population estimate. Qualification: The interview group contained 50 men and 50 women. This is evidence of views in that group, not a prescription, national prevalence or health advice. Full journal paper unavailable. | Online-dating singles ages 60–83; 50 men and 50 women Geographic eligibility not established from accessible original release Interview collection dates not established from accessible original university release Published eligible item/group base(s): 50, 100. An overall report n is not a subgroup base. | University of New Hampshire / Harris and Melanson Published University release 2026-02-26 Original university release: relationship expectations Study methods and limits |
What is verified outside the United States?
The corrected ONS bulletin documents people entering civil partnerships at 65+ in England and Wales in 2023. It does not measure the proportion of older people dating. Canada’s selected LAT figures remain historical. An Australian Institute of Family Studies review offers useful context on couple arrangements, but no directly comparable Australian 50+ dating-prevalence figure was selected. This evidence does not support a four-country dating league table.
| ID | Finding and qualification | Population, actual period and base | Original source and locator |
|---|---|---|---|
| F50 | In 2023, people 65+ entering opposite-sex civil partnerships included 1,723 males and 1,347 females; same-sex civil partnerships included 309 males and 180 females. Definition: Counts of people aged 65+ entering each legal union type. Qualification: People, not couples or a dating-to-partnership conversion rate. England and Wales, not all UK. Includes nonresidents registering there; excludes residents registering elsewhere. | People aged 65+ entering a civil partnership in England and Wales England and Wales 2023 registered events Exact item/subgroup valid n is not printed beside these selected figures. An overall report n is not a subgroup base. | Office for National Statistics Published 2025-11-18; corrected version same date Corrected bulletin, Age at forming a civil partnership Study methods and limits |
24 descriptive calculations with original inputs
These comparisons make published evidence easier to find, inspect and cite. Some differences were already visible in or discussed by the original researchers. They are not new scientific discoveries. Rounded category sums are percentages; differences between percentages are percentage points.
| ID | Calculation | Arithmetic and unit | Original inputs and qualification |
|---|---|---|---|
| C01 | Marquette 50s: non-never app use | 9 + 17 = 26.0 percent | F01 Sum of the two published non-never frequency categories, not a new monthly threshold. Same survey and age group; no subgroup n or new interval available. |
| C02 | Marquette 60s: non-never app use | 4 + 7 = 11.0 percent | F01 Sum of the two published non-never frequency categories, not a new monthly threshold. Same survey and age group; no subgroup n or new interval available. |
| C03 | Marquette 70s: non-never app use | 4 + 3 = 7.0 percent | F01 Sum of the two published non-never frequency categories, not a new monthly threshold. Same survey and age group; no subgroup n or new interval available. |
| C04 | Marquette 50s: non-never going on dates | 24 + 28 = 52.0 percent | F02 Sum of the two published non-never frequency categories, not a new monthly threshold. Same survey and age group; no subgroup n or new interval available. |
| C05 | Marquette 60s: non-never going on dates | 22 + 18 = 40.0 percent | F02 Sum of the two published non-never frequency categories, not a new monthly threshold. Same survey and age group; no subgroup n or new interval available. |
| C06 | Marquette 70s: non-never going on dates | 8 + 13 = 21.0 percent | F02 Sum of the two published non-never frequency categories, not a new monthly threshold. Same survey and age group; no subgroup n or new interval available. |
| C07 | Marquette 50s: going-on-dates minus app-use non-never share | 74 − 48 = 26.0 percentage points | F01 / F02 Difference between separate marginal distributions. Algebraically equals the gap in their non-never sums; not the share of people who dated without apps or an offline-meeting estimate. |
| C08 | Marquette 60s: going-on-dates minus app-use non-never share | 89 − 60 = 29.0 percentage points | F01 / F02 Difference between separate marginal distributions. Algebraically equals the gap in their non-never sums; not the share of people who dated without apps or an offline-meeting estimate. |
| C09 | Marquette 70s: going-on-dates minus app-use non-never share | 93 − 79 = 14.0 percentage points | F01 / F02 Difference between separate marginal distributions. Algebraically equals the gap in their non-never sums; not the share of people who dated without apps or an offline-meeting estimate. |
| C10 | Pew negative experience: women minus men 50+ | 57 − 38 = 19.0 percentage points | F09 Descriptive within-source comparison using rounded published estimates. Preserve populations, age boundaries, period and source limitations; no new significance test, causal effect or individual overlap inferred. |
| C11 | Pew negative experience: women minus men 18–49 | 48 − 43 = 5.0 percentage points | F09 Descriptive within-source comparison using rounded published estimates. Preserve populations, age boundaries, period and source limitations; no new significance test, causal effect or individual overlap inferred. |
| C12 | Pew lifetime adoption: 50s minus 70+ | 23 − 12 = 11.0 percentage points | F03 Descriptive within-source comparison using rounded published estimates. Preserve populations, age boundaries, period and source limitations; no new significance test, causal effect or individual overlap inferred. |
| C13 | Pew Tinder history: 50s minus 70+ | 19 − 1 = 18.0 percentage points | F07 Descriptive within-source comparison using rounded published estimates. Preserve populations, age boundaries, period and source limitations; no new significance test, causal effect or individual overlap inferred. |
| C14 | Pew Match history: 50+ minus under 50 | 50 − 24 = 26.0 percentage points | F06 Descriptive within-source comparison using rounded published estimates. Preserve populations, age boundaries, period and source limitations; no new significance test, causal effect or individual overlap inferred. |
| C15 | Pew Tinder history: under 50 minus 50+ | 59 − 11 = 48.0 percentage points | F06 Descriptive within-source comparison using rounded published estimates. Preserve populations, age boundaries, period and source limitations; no new significance test, causal effect or individual overlap inferred. |
| C16 | Pew paid use at 50–64: men minus women | 51 − 38 = 13.0 percentage points | F10 Descriptive within-source comparison using rounded published estimates. Preserve populations, age boundaries, period and source limitations; no new significance test, causal effect or individual overlap inferred. |
| C17 | Pew paid use at 65+: men minus women | 57 − 35 = 22.0 percentage points | F10 Descriptive within-source comparison using rounded published estimates. Preserve populations, age boundaries, period and source limitations; no new significance test, causal effect or individual overlap inferred. |
| C18 | Pew suspected scam: 50–64 minus 65+ | 52 − 39 = 13.0 percentage points | F11 Descriptive within-source comparison using rounded published estimates. Preserve populations, age boundaries, period and source limitations; no new significance test, causal effect or individual overlap inferred. |
| C19 | Historical non-seekers feeling too old: 50+ minus under 50 | 25 − 4 = 21.0 percentage points | F17 Descriptive within-source comparison using rounded published estimates. Preserve populations, age boundaries, period and source limitations; no new significance test, causal effect or individual overlap inferred. |
| C20 | Senior List interest: men minus women | 43 − 27 = 16.0 percentage points | F21 Descriptive within-source comparison using rounded published estimates. Preserve populations, age boundaries, period and source limitations; no new significance test, causal effect or individual overlap inferred. |
| C21 | ACS widowhood at 65+: females minus males | 28 − 10 = 18.0 percentage points | F37 Descriptive within-source comparison using rounded published estimates. Preserve populations, age boundaries, period and source limitations; no new significance test, causal effect or individual overlap inferred. |
| C22 | ACS widowhood at 50–64: females minus males | 5 − 2 = 3.0 percentage points | F36 Descriptive within-source comparison using rounded published estimates. Preserve populations, age boundaries, period and source limitations; no new significance test, causal effect or individual overlap inferred. |
| C23 | ACS mean age gap: cohabiting minus married couples | 7 − 4 = 3.0 years | F43 At least one partner 50+. Difference of published mean age gaps, not a preferred gap or effect of relationship type. |
| C24 | Canada historical LAT 60+: 2011 minus 2001 | 2.3 − 1.8 = 0.5 percentage points | F44 Historical same-source trend. Not a 2026/2027 rate, a dating success measure or a country ranking. |
Two comparisons across gaps
Pew’s negative-experience gender gap is (57 − 38) − (48 − 43) = 14 percentage points wider at 50+ than at 18–49. The ACS widowhood sex gap is (28 − 10) − (5 − 2) = 15 points wider at 65+ than at 50–64. These descriptive contrasts use rounded published figures; neither is a newly tested interaction or a causal explanation. Pew original research; BGSU original analysis.
Common questions about dating over 50
What percentage of people over 50 use dating apps?
SSRS found 20% had ever used dating sites/apps and 2% were currently using them in January 2026. The reference windows differ; neither is the share of older singles who are dating. Original research source.
Are single people over 50 usually looking for a partner?
That cannot be assumed. Pew’s October 2019 figures show 50% of singles 50–64 and 75% at 65+ were not looking. These are historical seeking preferences, not current activity or a prediction for an individual. Original research source.
How do dating habits differ in the 50s, 60s and 70s?
In Marquette’s June 2026 study-defined singles, summed non-never dating shares were 52%, 40% and 21%, while app-use shares were 26%, 11% and 7%. The separate margins do not identify who dated without apps. Original research source.
Do older online daters only want marriage?
No such conclusion follows. Pew’s 2022 major motives include long-term partnership, casual dates, casual sex and friendship, with more than one motive allowed. A long-term partnership is not necessarily marriage. Original research source.
What is the success rate of dating apps after 50?
The selected evidence does not establish one universal success rate. Meeting a current partner online, satisfaction and the AARP routed mixed current/prior outcomes have different populations and definitions. Original research source.
Do romance-scam statistics measure verified losses?
Not always. Pew asks about suspected scam encounters, and AARP’s 16% combines personal loss with knowing someone who lost money. Neither can be presented as a verified personal-loss rate for all older app users. Original research source.
Do older couples have to live together?
The historical Canadian LAT study documents committed partners in separate homes, including respondents who prioritized independence. Its 2011 prevalence and age-60+ boundary must remain visible. Original research source.
Are these statistics measured in 2027?
No. The title denotes the 2027 editorial edition reviewed November 2, 2026. Each finding states its actual observation period; current releases and historical data are not relabeled as new 2027 measurements. Original research source.
Methodology and limitations
Scope and original contribution
This resource contains 50 grouped findings with 172 numeric inputs, 24 reproducible descriptive calculations and four chart designs. Twelve numbered source records come from nine organizations; a thirteenth bibliography record is Australian context only. Related source records are not automatically independent surveys: the Pew waves share an organization and the BGSU profiles analyze different ACS years. MyLittleDesire provides synthesis, convenient comparisons and graphics, without claiming original survey fieldwork, a systematic review or new scientific discoveries.
Edition and actual dates
2027 is the editorial edition. Sources were reviewed on November 2, 2026. No 2027 observations are claimed. Selected observations range from the 2001/2011 historical Canadian LAT analysis to January/June 2026 survey fieldwork. A release or page-update date does not change the date respondents answered. Older findings remain useful for clearly labeled context, not as present-day prevalence.
Original-source verification
Selected original releases, tables, toplines, methodological descriptions, PDFs and chart images were checked. Marquette’s original archive supplied tables when a direct request failed; accessible original public retrieval supplied the AARP and SSRS releases when direct HTTP was restricted. Relevant Pew and BGSU chart labels were inspected visually. This is verification of selected published results, not every respondent record or every report item. UNH’s university release was read, but its linked journal full text was inaccessible. AARP’s full romance-scam questionnaire was also inaccessible.
Sampling and valid bases
Pew and SSRS use weighted probability panels, and Marquette identifies the SSRS Opinion Panel as its source. AARP/NORC describes its 50+ omnibus as nationally representative. BGSU analyzes ACS data and ONS reports registrations. The Senior List’s recruitment, weighting and item-to-wave mapping are not established. AARP Smart Picks covers recent users with insufficient recruitment details for a representative all-older-adult claim. UNH’s 100 interviews are a recruited qualitative group. Full study sample sizes are preserved in the bibliography and research database; unknown selected item or subgroup bases stay blank rather than inheriting the overall n.
AARP provenance and routed outcomes
The dedicated Smart Picks report, published October 23, 2026, states that 300 recent users 50+ were surveyed in January 2026. Related AARP reviews refer to a 2025 300-person survey. Whether these refer to the same survey could not be reconciled. Published dedicated-report values are retained with the field-year conflict visible. Its long-term-seeker outcome subset has no printed exact valid n, and the outcome wording mixes current and past relationships. No general population adoption rate or longitudinal success rate is inferred.
Comparable calculations and precision
Calculations use only within-source compatible inputs. Marquette’s app/date sums combine the two non-never categories because the highest-frequency table heading differs from the narrative monthly wording. The resulting gaps compare separate margins, not individual overlap. Percentages and percentage-point differences are distinguished from years. Results are rounded to one decimal place in the CSV/workbook, avoiding binary floating-point artifacts. No new confidence intervals, age-by-gender interaction tests or causal effects were estimated; an overall survey margin is never assigned to a subgroup.
Definitions and demographic context
Singlehood, willingness to date, dating activity, app use and legal partnership are kept distinct. BGSU current-status and lifetime-marriage categories have different boundaries, and its transition composition counts events. Its couple analysis requires only one partner 50+. Mean age gaps are not preferences. ONS counts individual people entering civil partnerships in England and Wales; this is not all UK and not a dating-to-union conversion rate. The original sex/gender labels are retained without inventing unreported categories.
Country and historical limits
The US evidence is deeper than the selected evidence for other countries. Canada’s 2001/2011 LAT findings are historical and use 60+, not 50+. ONS supplies England/Wales registration context, not directly comparable dating prevalence. The Australian institute review is context only. These sources cannot support a pooled international rate, a country ranking or a universal size of the available dating pool. LAT duration is duration so far of an ongoing relationship, not a survival forecast.
Holdouts and future updates
The research inventory separates withheld, uncertain, rejected and unmeasured claims. Withheld items include the BGSU married-couple 19%/20% contradiction, inadequately routed AARP scam-platform and nonreporting figures, and unsupported AARP general-population app adoption. Before an update, check original wording, actual field period, eligibility, valid bases and source corrections. Rebuild affected calculations, text and graphics together and record substantive changes. Preserve the evergreen URL and change review dates only after real checking.
Related MyLittleDesire research
Online Dating Statistics covers broader adoption. Singles and Singlehood Statistics covers single life. Marriage and Divorce Statistics and Cohabitation Statistics cover legal and living arrangements. Romance Scam Statistics covers fraud, and Dating Intentions Statistics covers relationship goals. This resource focuses on older age groups, denominators and later-life comparisons.
Complete original-source bibliography
- S01 · Marquette University Law School Poll. Dating-app use and going on dates by age, Tables 13–14.
Published 2026-07-07.
Actual data: 2026-06-09 to 2026-06-15
Population: Study-defined single adults: never married, separated, divorced or widowed; excludes unmarried co-resident partners
Overall report sample: 1,514
Method: Original university tables verified through its public archive/index when direct HTTP failed. The June 25 methods release identifies the same field period, n=1,514 adults and online SSRS Opinion Panel probability sampling. Exact unweighted age-by-single item bases were not supplied.
Limits: The full 1,514 is not the single/age subgroup n; do not infer raw n from weighted frequencies or percentages. The table highest-frequency heading says more than once a month while narrative says at least once; sums of the two non-never categories avoid claiming a precise monthly threshold. Single here can include a committed non-cohabiting relationship, unlike Pew’s single definition.
Supporting document 1 · Supporting document 2 · Supporting document 3 - S02 · Pew Research Center. Dating at 50 and up: Older Americans’ experiences with online dating.
Published Older-adult analysis 2023-07-17; full report 2023-02-02; singles analysis 2023-02-08.
Actual data: 2022-07-05 to 2022-07-17
Population: Adults 18+ overall; selected figures use 50+, decade, gender, ever-user, past-year-user or partnered subsets
Overall report sample: 6,034
Method: Weighted probability-based American Trends Panel (4,996) plus KnowledgePanel LGB oversample (1,038). Original older-adult analysis, four-page topline, methodology and full report inspected; relevant original chart images visually checked.
Limits: Historical 2022 data. Full-report n and all-age item n are not the selected older subgroup n. Ever-use, past-year use, current use, motives, perceived safety and unwanted experiences have different bases/windows. Published NETs retained despite component rounding; not every age difference is statistically significant.
Supporting document 1 · Supporting document 2 · Supporting document 3 · Supporting document 4 - S03 · Pew Research Center. A profile of single Americans.
Published 2020-08-20.
Actual data: 2019-10-16 to 2019-10-28
Population: Adults 18+; selected age groups and single/non-looking subsets
Overall report sample: 4,860
Method: Weighted probability-based American Trends Panel; original report, topline and analysis inspected. Single excludes marriage, cohabitation and committed romantic relationships.
Limits: Historical context, not current or 2027 figures. Exact selected older subgroup n not printed. All-age singles n=1,918 and non-looking n=787 must not be substituted for age-specific bases.
Supporting document 1 · Supporting document 2 - S04 · SSRS. The Public and Online Dating 2026.
Published 2026-02-02.
Actual data: 2026-01-02 to 2026-01-04 and 2026-01-16 to 2026-01-20
Population: Adults 18+ overall; selected all-50+ and 50+ ever-user groups
Overall report sample: 2,012
Method: Probability-based Opinion Panel Omnibus, online/phone, English/Spanish; overall design effect 1.27 and 95% margin ±2.5 points. Original release and nine-page topline checked.
Limits: Exact 50+ subgroup/item n unavailable in selected release. Overall margin is not applied to subgroups. Ever-user brand adoption does not measure current brand market share, relationship outcomes or which app is best.
Supporting document 1 - S05 · The Senior List. Why Are Only 1 in 3 Older Singles Open to Dating?.
Published 2025-02-10.
Actual data: November 2024 initial poll; December 2024 follow-up
Population: Survey-defined unmarried singles 50+; initial n=1,232; follow-up n=488
Overall report sample: Not a selected item-valid n; see methods
Method: Original questions, published results and methods read. Two online surveys; initial 58% ages 50–59, 31% ages 60–69, 10% 70+, 1% age withheld. Follow-up ages 50–84, median 59.
Limits: Recruitment, weighting, overlap between waves and exact stage/item bases for selected results not established. Do not add n=1,232 and 488 into a unique national sample or call it probability representative. Advice themes are coded self-reports, not proven recommendations. Unknown bases remain blank. - S06 · AARP Smart Picks. 4 Key Takeaways From Our Online Dating Survey.
Published 2026-10-23.
Actual data: Dedicated report states January 2026; related AARP reviews refer to 2025, unresolved provenance
Population: Adults 50+ who had used online dating in the previous three years
Overall report sample: 300
Method: Original dedicated report verified through accessible public original-source retrieval after direct HTTP 403. Report explicitly states n=300 and January 2026. Selected goals, outcomes, satisfaction, suspected fake/scam experience and paid-feature findings inspected.
Limits: Not a prevalence survey of all adults 50+. Recruitment, weighting, complete questionnaire and long-term-seeker valid n unavailable. Related reviews describe a 2025 300-person survey; whether these are the same survey is unresolved. Published values are retained with that date conflict visible. Outcomes mix current and prior relationship wording.
Supporting document 1 · Supporting document 2 - S07 · AARP Research / NORC. Adults 50+ Perspectives on Romance Scams.
Published Web release 2026-02-02; suggested report citation January 2026.
Actual data: Mid-November 2025
Population: Adults ages 50+
Overall report sample: 1,008
Method: Original release and methods verified through public original-source retrieval. AARP fielded questions on NORC’s Foresight 50+ Omnibus, described as nationally representative. Full annotated questionnaire was not accessible through the retrieved DOI route.
Limits: Knowing a victim differs from personally losing money. Stigma opinions can overlap. Exact question wording, subgroup n and selected intervals not supplied in accessible release. Platform percentages and unreported-incident rate withheld because routed bases could not be established.
Supporting document 1 - S08 · Bowling Green State University Center for Aging Families. Relationship Status by Age Among U.S. Adults Aged 50+, 2024 (AFP-26-02).
Published 2026; page displays updated 05/12/2026.
Actual data: 2024 American Community Survey
Population: Adults ages 50–64 and 65+, by reported sex; transition figures use events rather than every person
Overall report sample: Not a selected item-valid n; see methods
Method: Original university analysis of ACS 1-year data via IPUMS USA v16.0. Figures 1A/1B/2/3A and their source descriptions inspected; selected figures visually checked.
Limits: Relationship-status categories are not dating activity. Never-married status categories and lifetime number-of-marriages categories differ because cohabiting adults can have zero marriages. Rounded shares may not sum to 100%. Transitions are events; some people had more than one. Exact unweighted analytic n and intervals not printed.
Supporting document 1 - S09 · Bowling Green State University NCFMR. Older Adult Cohabiting and Married Couples, 2023 (FP-25-08).
Published 2025.
Actual data: 2023 American Community Survey
Population: Couples with at least ONE partner age 50+; unit is couple/household head, not all older adults
Overall report sample: Not a selected item-valid n; see methods
Method: Original two-page profile by Christopher A. Julian, ACS 1-year IPUMS USA v15.0 analysis. Selected charts/definitions inspected.
Limits: Both partners need not be 50+. Age gaps are published group averages, not partner preferences or individual predictions. Married-couple both-previously-married value conflicts: narrative 20%, chart 19%; that value withheld. No dating-to-marriage conversion or success effect inferred.
Supporting document 1 - S10 · Statistics Canada. Living apart together.
Published 2013-03-05; archived historical article.
Actual data: 2011; selected comparison with 2001
Population: People 20+ overall; selected figures concern adults 60+ or LAT respondents 60+
Overall report sample: Not a selected item-valid n; see methods
Method: Original government article, Table 2, duration and independence discussion, non-transitional definition and methods inspected. Based on 2001/2011 General Social Survey family cycles.
Limits: Historical illustration, not a 2026/2027 prevalence claim or an age-50+ estimate. LAT excludes married/common-law respondents, whose separate homes are classified differently. Exact older item n and intervals not retrieved. Age-specific results cannot be generalized to all older daters.
Supporting document 1 - S11 · University of New Hampshire / Harris and Melanson. Love, Dating, and Intimacy Don’t End with Age.
Published University release 2026-02-26.
Actual data: Interview collection dates not established from accessible original university release
Population: Online-dating singles ages 60–83; 50 men and 50 women
Overall report sample: 100
Method: Original researcher-university release reports in-depth phone interviews and exact respondent counts. Linked Journal of Sex Research full paper returned 403 and was not audited.
Limits: Qualitative recruited interview group, not national prevalence. Count 97 or 72 interviewees, not 97% or 72% of all older adults. Recruitment details, country eligibility, collection dates and complete coding methods unavailable from release. No causal or medical advice inferred.
Supporting document 1 - S12 · Office for National Statistics. Marriages and civil partnerships in England and Wales: 2023.
Published 2025-11-18; corrected version same date.
Actual data: 2023 registered events
Population: People aged 65+ entering a civil partnership in England and Wales
Overall report sample: Not a selected item-valid n; see methods
Method: Original current corrected bulletin inspected; age section gives people entering opposite-sex and same-sex civil partnerships. Civil-registration data, not a sample of daters.
Limits: Counts are people by age/sex/partnership type, not numbers of couples or dating success rates. Includes nonresidents registering there and excludes residents registering elsewhere. Do not extend England/Wales to all UK or combine people counts as partnership counts. The correction concerns chart year labels; source states tables unaffected. - S13 · Australian Institute of Family Studies. Couple relationships in Australia today.
Published 2026 source; exact publication day not established.
Actual data: Review context; no selected dating-prevalence observation
Population: Review of couple arrangements, not a selected over-50 dating sample
Overall report sample: Not a selected item-valid n; see methods
Method: Original institute review inspected for relationship-arrangement context, including living apart together.
Limits: No comparable Australian age-50+ dating-prevalence estimate was selected. The review does not establish a country ranking. Legal descriptions are not reproduced as personalized legal advice.
How to cite this resource
MyLittleDesire. Dating Over 50 Statistics 2027 https://mylittledesire.com/dating-over-50-statistics/