
Dating after divorce follows different paths. Some people want dates, some remain single, and others move into cohabitation or remarriage. This resource brings original studies together with their actual dates, populations and definitions, then explains which comparisons the evidence supports.
What does a dating-after-divorce statistic measure?
Check the population, legal status, outcome, starting event, reference period and denominator before quoting a percentage.
| Term | Measure | Interpretation |
|---|---|---|
| Dating / cohabitation / remarriage | Non-co-residential romance, living together unmarried, and a legal marriage. | Research measuring the latter two does not count every dating relationship. |
| Divorced / separated / widowed | Different marital histories and legal/residential states. | A combined DSW figure must not be relabeled as divorced-only. |
| Single / looking | Relationship status versus interest in dates or commitment. | Pew single excludes a committed romance as well as marriage/cohabitation. |
| Ever divorced / currently divorced | Lifetime experience versus current marital status. | Ever-divorced people can now be remarried. Do not add incompatible groups. |
| First route / later transition | The first move-in union after marital breakup versus what later happens to it. | First cohabitation can lead to marriage later; direct remarriage is only one route. |
| Time origin | Separation, filing, legal finalization, first date or moving in. | A ten-year follow-up has different meaning depending on its starting event. |
| Cumulative incidence / observed share | Censoring-aware transition estimates versus a simple sample proportion. | An event-history estimate cannot be reproduced by dividing raw observed events by total n. |
| Conditional mean / duration so far | Average interval among current repartnered people versus how long an existing union has lasted. | Neither supplies an expected wait for everyone or predicts future longevity. |
| Percent / percentage points / rate per 1,000 | Shares, differences between shares, and event rates. | 100.4 events per 1,000 is not 100.4%; rate differences retain their unit. |
| Hazard ratio | Adjusted relative event hazard compared with a stated reference group. | Not a percentage, a percentage-point change, a causal effect or personal advice. |
Key dating-after-divorce findings
56%
25%
First repartnering routes within ten years: cohabitation / direct remarriage.NSFG 2011–17 selected women; unweighted life tables, not all dating
Haoming Song / Population Research and Policy Review ·
Post-dissolution cohabitors married / dissolved the cohabitation within ten years.NSFG subset n=968; clock starts at cohabitation entry
Haoming Song / Population Research and Policy Review ·
36%
32%
Ever-divorced adults had ever remarried by the reference year.Pew analysis of 2023 SIPP reference data; age 15+
Pew Research Center / US Census SIPP ·
DSW singles already on the dating market sought casual dates only.
62% / 13%
54% / 41%
First repartnering routes within ten years: cohabitation / direct remarriage.NSFG 2011–17 selected women; unweighted life tables, not all dating
Haoming Song / Population Research and Policy Review ·
Post-dissolution cohabitors married / dissolved the cohabitation within ten years.NSFG subset n=968; clock starts at cohabitation entry
Haoming Song / Population Research and Policy Review ·
66%
19% / 15%
Ever-divorced adults had ever remarried by the reference year.Pew analysis of 2023 SIPP reference data; age 15+
Pew Research Center / US Census SIPP
Currently divorced men / women lived with an unmarried partner.2023 SIPP reference data; current-status denominator
Pew Research Center / US Census SIPP ·
22% / 37%
7% / 11%
Women / men formed a new co-residential union within ten years after divorce at 50+.1998–2014 HRS; approximate historical estimates
Brown, Lin, Hammersmith and Wright / Demography ·
Women / men reconciled within ten years after separation at 50+.1998–2018 HRS; separation-origin clock
Brown and colleagues / Journal of Marriage and Family
4.8 / 4.5 years
7% / 9%
Women / men in a current subsequent union averaged this interval after separation/divorce.Canada 2017; conditional mean, not a rule for when to date
Statistics Canada ·
Formerly married / cohabiting couples reunited within five years after separation.Australia 2001–23 HILDA; published 2026; no significant type difference
Gray, Evans and Reimondos / Australian National University ·
Does being divorced mean someone is looking for a date?
No. Pew’s October 2019 survey found 56% of divorced singles were not looking for dates or a relationship. The separate finding that 25% wanted casual dates only uses a narrower combined divorced/separated/widowed population already on the dating market. Both are historical preferences, and they cannot be combined into a percentage of all divorced adults.
| ID | Finding and qualification | Population, actual period and base | Original source and locator |
|---|---|---|---|
| F01 | In 2019, 56% of divorced singles and 74% of widowed singles were not looking for dates or a relationship; 62% of never-married singles were looking. Definition: Current seeking preferences within study-defined singles. Qualification: Divorced here excludes separated people. Never-married uses the positive looking category, not the not-looking category. Historical, not a current rate. | Adults 18+; selected single, divorced-only and divorced/separated/widowed dating-market subsets United States 2019-10-16 to 2019-10-28 Exact item/subgroup valid n is not printed beside these selected figures. An overall report n is not a subgroup base. | Pew Research Center Published 2020-08-20 Original profile: many singles not looking; footnote on divorced Study methods and limits |
| F02 | 25% of divorced, separated or widowed singles on the dating market sought casual dates only, versus 17% of never-married daters. Definition: Conditional on looking for dates or a relationship; combined marital-history category. Qualification: Not 25% of all divorced adults. Pew says age/gender largely explain these differences; no marital-history cause inferred. | Adults 18+; selected single, divorced-only and divorced/separated/widowed dating-market subsets United States 2019-10-16 to 2019-10-28 Exact item/subgroup valid n is not printed beside these selected figures. An overall report n is not a subgroup base. | Pew Research Center Published 2020-08-20 Original profile: dating-market goals Study methods and limits |
How common is online dating among divorced adults?
Pew’s July 2022 figure is 36% ever-use among a combined divorced, separated and widowed group. It does not isolate divorce or establish that platform use began after a divorce. Among that group’s platform ever-users, 15% were current users and 17% last used one within the past year. Changing the denominator changes what a percentage can mean.
| ID | Finding and qualification | Population, actual period and base | Original source and locator |
|---|---|---|---|
| F03 | In July 2022, lifetime dating-platform use was 36% of divorced/separated/widowed adults, 52% of never-married adults, 46% of cohabiters and 16% of married adults. The combined DSW share was 35% in 2019. Definition: Current marital status crossed with lifetime app/site use. Qualification: Not divorced-only or proof use occurred after divorce. Pew reports no statistically significant marital-status trend from 2019; the one-point rounded DSW difference is not established growth. | Adults 18+ overall; recency figures concern platform ever-users within current marital-status groups United States 2022-07-05 to 2022-07-17; selected 2019 comparison Exact item/subgroup valid n is not printed beside these selected figures. An overall report n is not a subgroup base. | Pew Research Center Published 2023-02-24 Original chart 1, visually checked Study methods and limits |
| F04 | Among DSW platform ever-users, 15% currently used one, 17% last used one within the past year, 30% one to five years ago and 38% more than five years ago. Definition: Four recency categories among the combined divorced/separated/widowed ever-user group. Qualification: Not percentages of all divorced adults. Current and past-year-only are separate mutually exclusive source categories. Exact group n unavailable. | Adults 18+ overall; recency figures concern platform ever-users within current marital-status groups United States 2022-07-05 to 2022-07-17 Exact item/subgroup valid n is not printed beside these selected figures. An overall report n is not a subgroup base. | Pew Research Center Published 2023-02-24 Original chart 2, visually checked Study methods and limits |
Is the first new partnership usually cohabitation or direct remarriage?
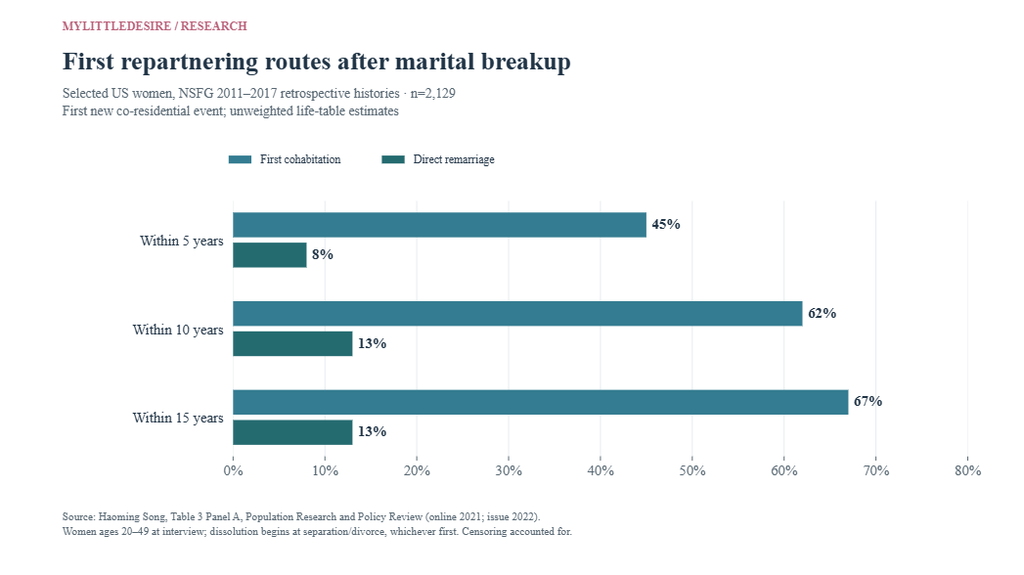
In one historical NSFG analysis of women ages 20–49 at interview, first cohabitation was more common than direct remarriage after first marital dissolution. At ten years, the published life tables estimate 62% entered cohabitation first and 13% directly remarried. These are unweighted, censoring-adjusted retrospective estimates, not current national dating rates. A later marriage to a cohabiting partner belongs to the next transition.
| ID | Finding and qualification | Population, actual period and base | Original source and locator |
|---|---|---|---|
| F18 | Within 5 years of first marital dissolution, the published life table estimates 52% repartnered: 45% first cohabited and 8% directly remarried. Definition: First new co-residential event; cohabitation and direct remarriage are competing routes. Qualification: Unweighted, censored retrospective life-table estimates; not all women/current 2027 prevalence. Rounded route components may not exactly sum to the published total. Later remarriage after cohabitation is a different transition. | Women ages 20–49 at interview whose first marriage dissolved within 15 years; cohabitation-exit subset United States 2011–2017 NSFG retrospective union histories; most selected transitions after 2000 Published eligible item/group base(s): 2,129. An overall report n is not a subgroup base. | Haoming Song / Population Research and Policy Review Published First online 2021-08-25; journal issue June 2022 Table 3, Panel A, year 5 Study methods and limits |
| F19 | Within 10 years of first marital dissolution, the published life table estimates 74% repartnered: 62% first cohabited and 13% directly remarried. Definition: First new co-residential event; cohabitation and direct remarriage are competing routes. Qualification: Unweighted, censored retrospective life-table estimates; not all women/current 2027 prevalence. Rounded route components may not exactly sum to the published total. Later remarriage after cohabitation is a different transition. | Women ages 20–49 at interview whose first marriage dissolved within 15 years; cohabitation-exit subset United States 2011–2017 NSFG retrospective union histories; most selected transitions after 2000 Published eligible item/group base(s): 2,129. An overall report n is not a subgroup base. | Haoming Song / Population Research and Policy Review Published First online 2021-08-25; journal issue June 2022 Table 3, Panel A, year 10 Study methods and limits |
| F20 | Within 15 years of first marital dissolution, the published life table estimates 80% repartnered: 67% first cohabited and 13% directly remarried. Definition: First new co-residential event; cohabitation and direct remarriage are competing routes. Qualification: Unweighted, censored retrospective life-table estimates; not all women/current 2027 prevalence. Rounded route components may not exactly sum to the published total. Later remarriage after cohabitation is a different transition. | Women ages 20–49 at interview whose first marriage dissolved within 15 years; cohabitation-exit subset United States 2011–2017 NSFG retrospective union histories; most selected transitions after 2000 Published eligible item/group base(s): 2,129. An overall report n is not a subgroup base. | Haoming Song / Population Research and Policy Review Published First online 2021-08-25; journal issue June 2022 Table 3, Panel A, year 15 Study methods and limits |
What happens after a post-divorce cohabiting relationship begins?
Some cohabitations become marriages. In the same study’s 968-woman cohabitation subset, 54% were estimated to marry and 41% to dissolve the cohabitation within ten years of moving in. The total 95% exit estimate includes both outcomes. It cannot be described as a 95% breakup rate. This clock starts at cohabitation entry, rather than the original marital breakup.
| ID | Finding and qualification | Population, actual period and base | Original source and locator |
|---|---|---|---|
| F21 | Within 2 years of post-dissolution cohabitation entry, 39% had exited that cohabitation: 25% through remarriage and 14% through dissolution. Definition: Next transition among women entering the first post-dissolution cohabitation, not all divorced women. Qualification: The clock resets at cohabitation entry. Unweighted life tables account for censoring; rounded cumulative estimates are not raw observed fractions, and exits include marriage rather than only breakups. | NSFG selected post-dissolution cohabitors, n=968 women ages 20–49 at interview United States 2011–2017 NSFG retrospective union histories; most selected transitions after 2000 Published eligible item/group base(s): 968. An overall report n is not a subgroup base. | Haoming Song / Population Research and Policy Review Published First online 2021-08-25; journal issue June 2022 Table 3, Panel B, year 2 Study methods and limits |
| F22 | Within 5 years of post-dissolution cohabitation entry, 74% had exited that cohabitation: 42% through remarriage and 32% through dissolution. Definition: Next transition among women entering the first post-dissolution cohabitation, not all divorced women. Qualification: The clock resets at cohabitation entry. Unweighted life tables account for censoring; rounded cumulative estimates are not raw observed fractions, and exits include marriage rather than only breakups. | NSFG selected post-dissolution cohabitors, n=968 women ages 20–49 at interview United States 2011–2017 NSFG retrospective union histories; most selected transitions after 2000 Published eligible item/group base(s): 968. An overall report n is not a subgroup base. | Haoming Song / Population Research and Policy Review Published First online 2021-08-25; journal issue June 2022 Table 3, Panel B, year 5 Study methods and limits |
| F23 | Within 10 years of post-dissolution cohabitation entry, 95% had exited that cohabitation: 54% through remarriage and 41% through dissolution. Definition: Next transition among women entering the first post-dissolution cohabitation, not all divorced women. Qualification: The clock resets at cohabitation entry. Unweighted life tables account for censoring; rounded cumulative estimates are not raw observed fractions, and exits include marriage rather than only breakups. | NSFG selected post-dissolution cohabitors, n=968 women ages 20–49 at interview United States 2011–2017 NSFG retrospective union histories; most selected transitions after 2000 Published eligible item/group base(s): 968. An overall report n is not a subgroup base. | Haoming Song / Population Research and Policy Review Published First online 2021-08-25; journal issue June 2022 Table 3, Panel B, year 10 Study methods and limits |
How many divorced people have remarried or currently cohabit?
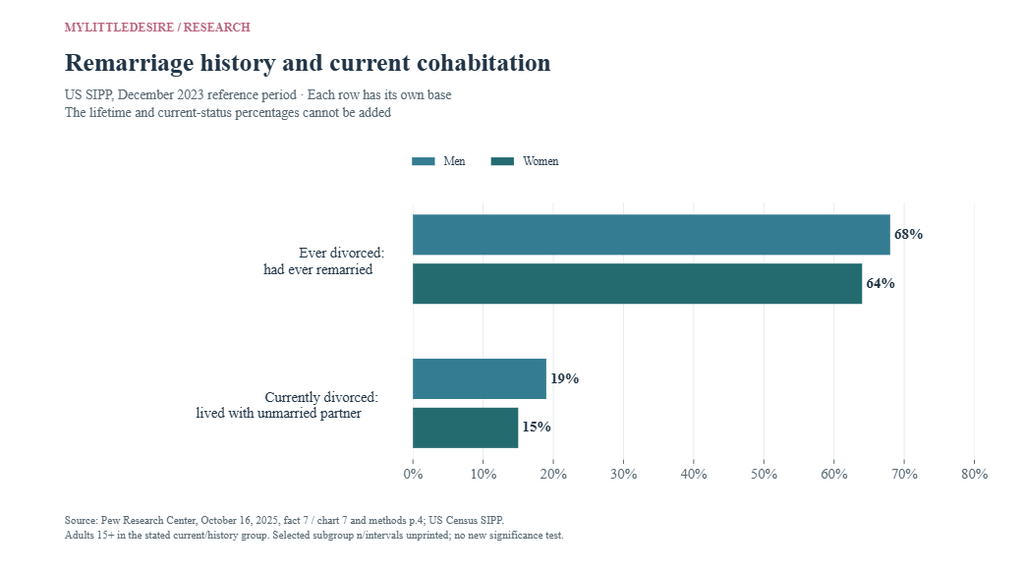
Pew’s analysis of 2023 SIPP reference data found 66% of ever-divorced adults had ever remarried, including remarriages that subsequently ended. It separately found cohabitation among 19% of currently divorced men and 15% of currently divorced women. Ever-divorced and currently divorced are different populations, so these cannot be added into one partnership-success percentage.
| ID | Finding and qualification | Population, actual period and base | Original source and locator |
|---|---|---|---|
| F05 | 66% of ever-divorced Americans had ever remarried by 2023: 68% of men and 64% of women. Definition: Lifetime remarriage after divorce among adults 15+, including remarriages that later ended. Qualification: Not a current-couple share, annual rate, forecast for a new divorce or probability of a lasting relationship. | Ever-divorced adults 15+; education 25+; current-divorced or currently-remarried subsets as stated United States December 2023 reference period; 2024 SIPP collection Exact item/subgroup valid n is not printed beside these selected figures. An overall report n is not a subgroup base. | Pew Research Center / US Census SIPP Published 2025-10-16 Fact 7 and original chart 7, visually checked Study methods and limits |
| F08 | 19% of currently divorced men and 15% of currently divorced women lived with an unmarried partner in 2023. Definition: Current divorced marital status and co-resident unmarried partner. Qualification: This denominator differs from all ever-divorced people, who can include currently remarried adults. Do not add it to the 66% lifetime figure. | US currently divorced adults 15+, by sex United States December 2023 reference period; 2024 SIPP collection Exact item/subgroup valid n is not printed beside these selected figures. An overall report n is not a subgroup base. | Pew Research Center / US Census SIPP Published 2025-10-16 Fact 7; methods p.4 Study methods and limits |
How do children feature in subsequent partnerships?
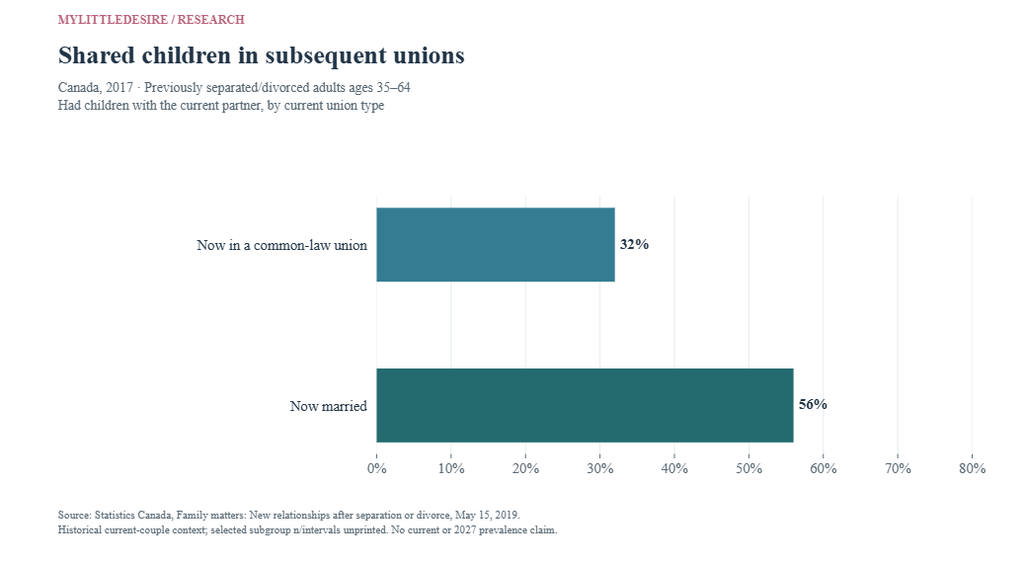
Having children together and living with stepchildren are different family measures. Among ever-divorced Americans currently remarried, 46% had a biological child with their current spouse. A historical Canadian analysis separately compares shared children among current subsequent marriages and common-law unions. These observations describe family histories and arrangements; they do not establish the effects of marriage, dating or children on relationship success.
| ID | Finding and qualification | Population, actual period and base | Original source and locator |
|---|---|---|---|
| F09 | 46% of ever-divorced people who were currently remarried had biological children with their current spouse: 48% of men and 44% of women. Definition: Current remarried union’s shared biological children, of any age. Qualification: The male/female difference was not statistically significant. Children need not live in the household; not all ever-divorced adults. | US ever-divorced adults 15+ who are currently remarried United States December 2023 reference period; 2024 SIPP collection Exact item/subgroup valid n is not printed beside these selected figures. An overall report n is not a subgroup base. | Pew Research Center / US Census SIPP Published 2025-10-16 Intro and fact 8 / original chart 8, visually checked Study methods and limits |
| F10 | 9% of currently remarried ever-divorced men and 4% of comparable women lived with a stepchild. Definition: Resident stepchildren of any age. Qualification: Not all stepchildren, all parents or all divorced adults; resident stepchildren and shared biological children can coexist. | US ever-divorced adults 15+ who are currently remarried United States December 2023 reference period; 2024 SIPP collection Exact item/subgroup valid n is not printed beside these selected figures. An overall report n is not a subgroup base. | Pew Research Center / US Census SIPP Published 2025-10-16 Fact 8 / original chart 8, visually checked Study methods and limits |
| F17 | 32% of those now in a subsequent common-law union and 56% now married had children with their current partner. Definition: Shared children within the current subsequent union. Qualification: Historical 2017 (or stated 2006 comparison), current-couple/subsequent-union denominators; not a current dating or population success rate. Selected valid n unavailable. | Previously separated/divorced Canadians 35–64 in the stated current subsequent-union type Canada 2017 General Social Survey; selected 2006 comparison Exact item/subgroup valid n is not printed beside these selected figures. An overall report n is not a subgroup base. | Statistics Canada Published 2019-05-15; archived Release: subsequent unions and children Study methods and limits |
How does repartnering after 50 differ from reconciliation?
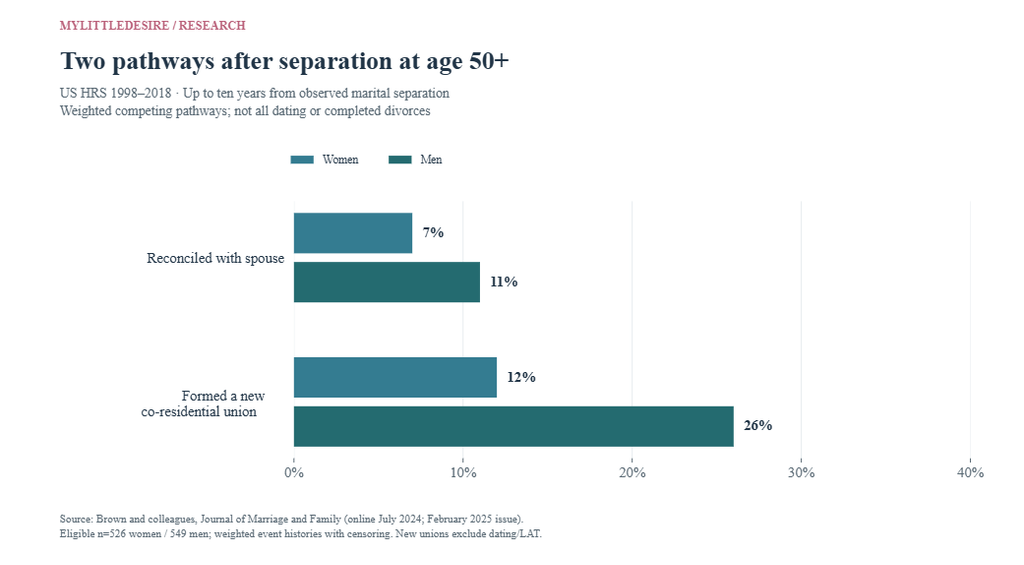
The original starting event matters. A 1998–2014 HRS analysis reports roughly 22% of women and 37% of men formed new co-residential unions within ten years after divorce at 50+. A later HRS analysis begins instead at marital separation, including people who may not have completed a divorce. It estimates both reconciliation and new unions. These shared-program studies have different eligibility and clocks, so their percentages do not establish a trend.
| ID | Finding and qualification | Population, actual period and base | Original source and locator |
|---|---|---|---|
| F24 | About 22% of women and 37% of men repartnered through cohabitation/remarriage within ten years after gray divorce. Definition: Divorce at 50+; only new co-residential unions counted. Qualification: Historical 1998–2014 HRS, not all dating or a current forecast. The sample and divorce-origin clock differ from the separation-origin S07 study. | Adults experiencing divorce at age 50+ during observation United States 1998–2014 Health and Retirement Study Exact item/subgroup valid n is not printed beside these selected figures. An overall report n is not a subgroup base. | Brown, Lin, Hammersmith and Wright / Demography Published April 2019; author manuscript in PMC April 2020 Abstract and results; Figures 1–2 Study methods and limits |
| F25 | Women who remarried had a reported mean 4.3 years since gray divorce, compared with 2.9 years for women who cohabited. Definition: Conditional descriptive time-since-divorce means by observed repartnering route. Qualification: Not everyone’s expected wait, a survival median or a recommended waiting period. People who never repartnered are not part of either pathway mean. Selected historical weighted/imputed results. | Adults experiencing divorce at age 50+ during observation United States 1998–2014 Health and Retirement Study Exact item/subgroup valid n is not printed beside these selected figures. An overall report n is not a subgroup base. | Brown, Lin, Hammersmith and Wright / Demography Published April 2019; author manuscript in PMC April 2020 Results discussion and Table 1 Study methods and limits |
| F26 | Within ten years after separation at 50+, roughly 7% of women and 11% of men reconciled; 12% of women and 26% of men formed a new co-residential union. Definition: Competing pathways after first observed later-life marital separation, not after every completed divorce. Qualification: Weighted event-history estimates with censoring, not raw counts divided by n. Non-co-residential dating is excluded. Shared HRS program with S06; different eligibility/time origin prevents a trend claim. | First observed marital separation at 50+; 526 women and 549 men in different-sex marriages United States 1998–2018 Health and Retirement Study Published eligible item/group base(s): 526, 549. An overall report n is not a subgroup base. | Brown and colleagues / Journal of Marriage and Family Published First online 2024-07-09; February 2025 issue Abstract, methods and Figures 1–2 Study methods and limits |
| F27 | Among men who repartnered after separation, 60% formed a cohabitation and 40% remarried. Definition: Pathway mix conditional on observed repartnering among men. Qualification: Not all separated men. Women’s corresponding narrative totals 46% plus 56% and is withheld pending clarification. Do not pool with S06 as independent data. | HRS men 50+ who formed a new co-residential union after observed separation; 171 men United States 1998–2018 Health and Retirement Study Published eligible item/group base(s): 171. An overall report n is not a subgroup base. | Brown and colleagues / Journal of Marriage and Family Published First online 2024-07-09; February 2025 issue Methods: analytic sample paragraph Study methods and limits |
What does Canadian research show about repartnering timelines?
Statistics Canada’s 2017 findings concern people ages 35–64 who were currently married or common-law. Among those in a subsequent union, women had spent an average 4.8 years separated/divorced before that current union and men 4.5 years. These conditional means exclude people without a current subsequent union. The separate median duration of 12 years measures how long the current partnership had lasted so far.
| ID | Finding and qualification | Population, actual period and base | Original source and locator |
|---|---|---|---|
| F11 | 26% of coupled Canadians ages 35–64 were in a second or subsequent marriage/common-law union in 2017, up from 23% in 2006. Definition: Current partnered people with more than one co-residential union. Qualification: Historical 2017 (or stated 2006 comparison), current-couple/subsequent-union denominators; not a current dating or population success rate. Selected valid n unavailable. | People ages 35–64 currently married or common-law; selected second/subsequent-union groups Canada 2006 and 2017 Exact item/subgroup valid n is not printed beside these selected figures. An overall report n is not a subgroup base. | Statistics Canada Published 2019-05-15; archived Release section: more than one in four Study methods and limits |
| F12 | In the coupled age-35–64 population, 25% of women and 26% of men had married or lived common law more than once. Definition: Subsequent current union, not the fraction of all divorced men/women who repartnered. Qualification: Historical 2017 (or stated 2006 comparison), current-couple/subsequent-union denominators; not a current dating or population success rate. Selected valid n unavailable. | People ages 35–64 currently married or common-law; selected second/subsequent-union groups Canada 2017 General Social Survey; selected 2006 comparison Exact item/subgroup valid n is not printed beside these selected figures. An overall report n is not a subgroup base. | Statistics Canada Published 2019-05-15; archived Release: gender paragraph Study methods and limits |
| F13 | 31% of Canadian-born coupled adults 35–64 were in a subsequent union, compared with 13% of foreign-born coupled adults. Definition: Nativity among people currently married or common-law. Qualification: Historical 2017 (or stated 2006 comparison), current-couple/subsequent-union denominators; not a current dating or population success rate. Selected valid n unavailable. | People ages 35–64 currently married or common-law; selected second/subsequent-union groups Canada 2017 General Social Survey; selected 2006 comparison Exact item/subgroup valid n is not printed beside these selected figures. An overall report n is not a subgroup base. | Statistics Canada Published 2019-05-15; archived Release: Canadian-born section Study methods and limits |
| F14 | Subsequent-union shares among coupled adults 35–64 were Quebec 36%, British Columbia 28%, Atlantic Canada 27%, Prairies 25% and Ontario 19%. Definition: Regions of residence within one historical government survey. Qualification: Historical 2017 (or stated 2006 comparison), current-couple/subsequent-union denominators; not a current dating or population success rate. Selected valid n unavailable. | People ages 35–64 currently married or common-law; selected second/subsequent-union groups Canada 2017 General Social Survey; selected 2006 comparison Exact item/subgroup valid n is not printed beside these selected figures. An overall report n is not a subgroup base. | Statistics Canada Published 2019-05-15; archived Release: Quebec section Study methods and limits |
| F15 | Repartnered women had spent an average 4.8 years separated/divorced before their current marriage/common-law union; men averaged 4.5 years. Definition: Conditional mean interval among those currently in a subsequent union. Qualification: Historical 2017 (or stated 2006 comparison), current-couple/subsequent-union denominators; not a current dating or population success rate. Selected valid n unavailable. | Repartnered Canadians ages 35–64 currently married or common-law Canada 2017 General Social Survey; selected 2006 comparison Exact item/subgroup valid n is not printed beside these selected figures. An overall report n is not a subgroup base. | Statistics Canada Published 2019-05-15; archived Release: almost five years Study methods and limits |
| F16 | Half of repartnered adults 35–64 had been with their current partner for at least 12 years by 2017. Definition: Median duration so far of the current subsequent union. Qualification: Historical 2017 (or stated 2006 comparison), current-couple/subsequent-union denominators; not a current dating or population success rate. Selected valid n unavailable. | Previously separated/divorced Canadians 35–64 in a current subsequent union Canada 2017 General Social Survey; selected 2006 comparison Exact item/subgroup valid n is not printed beside these selected figures. An overall report n is not a subgroup base. | Statistics Canada Published 2019-05-15; archived Release: subsequent unions last more than a decade Study methods and limits |
How often do separated Australian couples reunite?
A study published in July 2026 uses 2001–2023 HILDA data. Approximately 7% of formerly married couples and 9% of formerly cohabiting couples had returned to a shared household by five years after separation; the authors report no significant relationship-type difference. Its adjusted hazard ratios describe associations with reuniting, not probabilities, causes or advice to resume a relationship.
| ID | Finding and qualification | Population, actual period and base | Original source and locator |
|---|---|---|---|
| F28 | Five years after separation, about 7% of formerly married couples and 9% of formerly cohabiting couples had reunited. Definition: Couple-level cumulative incidence of returning to a shared household. Qualification: Not all divorces or emotional reconciliation. Authors report the relationship-type difference was not statistically significant. Includes competing risks and censoring; source n=1,117 married/2,205 cohabiting couples. | Previously co-residential couples; 3,382 separated couples with follow-up, including 1,117 married and 2,205 cohabiting Australia 2001–2023 HILDA, Waves 1–23 Published eligible item/group base(s): 1,117, 2,205. An overall report n is not a subgroup base. | Gray, Evans and Reimondos / Australian National University Published 2026-07-16 Abstract, results and Figure 1 Study methods and limits |
| F29 | The adjusted reuniting hazard ratio for cohabiting versus married couples was 1.15 and was not statistically significant. Definition: Hazard ratio from the combined reuniting model; married is reference. Qualification: Not a 15-percentage-point gap or evidence that union type causes reuniting. Numeric confidence interval/SE not printed in selected table. | Previously co-residential couples; 3,382 separated couples with follow-up, including 1,117 married and 2,205 cohabiting Australia 2001–2023 HILDA, Waves 1–23 Published eligible item/group base(s): 3,382. An overall report n is not a subgroup base. | Gray, Evans and Reimondos / Australian National University Published 2026-07-16 Table 2, Reuniting Total, relationship characteristics Study methods and limits |
| F30 | When both partners were dissatisfied before separation, reuniting hazard ratios versus both satisfied were 0.50 overall, 0.34 for married couples and 0.53 for cohabiting couples. Definition: Adjusted within-model hazard ratios, not probabilities. Qualification: Overall/married p<.01, cohabiting p<.05 under source’s star legend. Observational association, not an intervention effect or recommendation to reunite; numeric intervals unavailable. | Previously co-residential couples; 3,382 separated couples with follow-up, including 1,117 married and 2,205 cohabiting Australia 2001–2023 HILDA, Waves 1–23 Published eligible item/group base(s): 1,117, 2,205, 3,382. An overall report n is not a subgroup base. | Gray, Evans and Reimondos / Australian National University Published 2026-07-16 Table 2, Reuniting columns, both not satisfied Study methods and limits |
| F31 | Couples with joint resident children had a reuniting hazard ratio of 1.58 versus couples with no children in the combined model. Definition: Adjusted hazard ratio, combined reuniting model. Qualification: Source p<.05. Association is not proof children cause reunions or advice to stay together; not a 58-point prevalence increase. | Previously co-residential couples; 3,382 separated couples with follow-up, including 1,117 married and 2,205 cohabiting Australia 2001–2023 HILDA, Waves 1–23 Published eligible item/group base(s): 3,382. An overall report n is not a subgroup base. | Gray, Evans and Reimondos / Australian National University Published 2026-07-16 Table 2, Reuniting Total, joint resident children Study methods and limits |
What do studies of mothers’ post-divorce dating actually measure?
A regional US study recruited mothers filing for divorce in 2004–2006 and followed them for up to two years. At baseline, 44.5% were already in a new relationship, 26.5% were interested in dating and 29% were not interested. This describes the selected cohort at that assessment, not when every relationship began, a current national rate or a recommended timetable for parents.
| ID | Finding and qualification | Population, actual period and base | Original source and locator |
|---|---|---|---|
| F32 | At baseline, 44.5% of the recruited mothers were in a new relationship, 26.5% were interested in dating and 29% were not interested. Definition: Current status at an early assessment after filing, not the date dating first began. Qualification: Regional mothers with elementary-age children; recruitment 2004–06, not today’s national prevalence. Legal finalization could occur later and separation could have begun much earlier. | Mothers filing for divorce with an elementary-age child living with them at least half each week One large metropolitan area in the southwestern United States Recruitment spring 2004–spring 2006; monthly follow-up for 24 months Published eligible item/group base(s): 316. An overall report n is not a subgroup base. | Langlais and colleagues / Journal of Child and Family Studies Published First online 2021-10-08; June 2022 issue Methods, Procedures: baseline relationship paragraph Study methods and limits |
| F33 | During the two-year study, 27 mothers remarried and 109 entered a cohabiting relationship. Definition: Published counts of transitions within the regional recruited cohort. Qualification: Counts may overlap and monthly participation was incomplete. Do not add them into a unique repartnering count, generalize nationally or infer effects on children. Breakup/end-status contradictions are withheld. | Mothers filing for divorce with an elementary-age child living with them at least half each week One large metropolitan area in the southwestern United States Recruitment spring 2004–spring 2006; monthly follow-up for 24 months Published eligible item/group base(s): 316. An overall report n is not a subgroup base. | Langlais and colleagues / Journal of Child and Family Studies Published First online 2021-10-08; June 2022 issue Methods, Procedures: transition counts Study methods and limits |
How do remarriage histories and annual rates vary?
Lifetime remarriage history and an annual remarriage rate answer different questions. Pew’s divorced-only lifetime chart uses age 15+ overall and 25+ for education. BGSU’s annual ACS rates use source-defined previously married at-risk adults 18+, including widowhood. Their patterns should not be read as conflicting measures of dating success. Rates per 1,000 also must retain that unit.
| ID | Finding and qualification | Population, actual period and base | Original source and locator |
|---|---|---|---|
| F06 | Ever-remarried shares among ever-divorced adults were 68% White, 56% Black, 63% Hispanic and 65% Asian. Definition: Source race/ethnicity groups among ever-divorced adults 15+. Qualification: Historical 2023 composition, not a causal racial characteristic or a personal forecast. White/Black/Asian are single-race non-Hispanic; Hispanic any race. | Ever-divorced adults 15+; education 25+; current-divorced or currently-remarried subsets as stated United States December 2023 reference period; 2024 SIPP collection Exact item/subgroup valid n is not printed beside these selected figures. An overall report n is not a subgroup base. | Pew Research Center / US Census SIPP Published 2025-10-16 Original chart 7, visually checked Study methods and limits |
| F07 | Among ever-divorced adults 25+, 67% with high school or less, 66% with some college and 64% with a bachelor’s degree or more had ever remarried. Definition: Education uses 25+ rather than the other chart’s 15+ population. Qualification: Pew describes no strong education link. These are not evidence that education causes or prevents remarriage; some college includes associate degrees. | US ever-divorced adults ages 25+, by education United States December 2023 reference period; 2024 SIPP collection Exact item/subgroup valid n is not printed beside these selected figures. An overall report n is not a subgroup base. | Pew Research Center / US Census SIPP Published 2025-10-16 Original chart 7, visually checked Study methods and limits |
| F34 | The annual remarriage rate fell from 48.9 to 34.4 per 1,000 previously married males and from 25.2 to 18.5 for females between 2008 and 2023. Definition: Annual rates within source-defined previously married at-risk groups 18+, including widowhood. Qualification: Not percentages of divorced adults, lifetime probabilities or dating activity. Source-specific denominators retained. | Source-defined previously married at-risk adults 18+; includes widowhood, not divorced-only United States 2008 and 2023 ACS Exact item/subgroup valid n is not printed beside these selected figures. An overall report n is not a subgroup base. | Natalie Bankey / BGSU NCFMR Published 2025 profile; page updated 07/08/2026 Trends section; Figure 1 Study methods and limits |
| F35 | An estimated 556,951 males and 532,504 females experienced a remarriage in 2023. Definition: Estimated counts of individual people, not couples. Qualification: Includes widowhood and potentially same-sex unions; male/female counts need not match. Do not add as unique couple count or call this new dating prevalence. | Source-defined previously married at-risk adults 18+; includes widowhood, not divorced-only United States 2023 ACS Exact item/subgroup valid n is not printed beside these selected figures. An overall report n is not a subgroup base. | Natalie Bankey / BGSU NCFMR Published 2025 profile; page updated 07/08/2026 Trends section: counts not shown in figure Study methods and limits |
| F36 | The female rate peaked at ages 18–29 at 100.4 per 1,000; the male peak was 73.2 at 30–44. At 75+, rates were 7.9 for males and 1.5 for females. Definition: Age-specific annual rates per source-defined previously married people. Qualification: 100.4 per 1,000 is not 100.4%. Figure 2 was visually checked; it contradicts the narrative that male rates exceed female rates at every age, so that blanket claim is excluded. | Source-defined previously married at-risk adults 18+; includes widowhood, not divorced-only United States 2023 ACS Exact item/subgroup valid n is not printed beside these selected figures. An overall report n is not a subgroup base. | Natalie Bankey / BGSU NCFMR Published 2025 profile; page updated 07/08/2026 Age section and Figure 2, visually checked Study methods and limits |
| F37 | Rates for males/females with less than high school/GED were 25.6/10.6 per 1,000; for a master’s degree or more they were 47.0/24.6. Definition: Education-specific annual rates among previously married adults 18+. Qualification: Widowhood included; association is not an education effect or comparable to Pew’s lifetime divorced-only education chart with age 25+ boundary. | Source-defined previously married at-risk adults 18+; includes widowhood, not divorced-only United States 2023 ACS Exact item/subgroup valid n is not printed beside these selected figures. An overall report n is not a subgroup base. | Natalie Bankey / BGSU NCFMR Published 2025 profile; page updated 07/08/2026 Education section and Figure 5, visually checked Study methods and limits |
24 descriptive comparisons with original inputs
These comparisons make existing evidence easier to verify and quote. Some were already visible in or discussed by the original researchers. They are convenient synthesis and arithmetic, without a claim of new scientific discoveries.
| ID | Comparison | Arithmetic and unit | Original inputs and qualification |
|---|---|---|---|
| C01 | Historical non-looking: widowed minus divorced singles | 74 − 56 = 18.0 percentage points | F01 Within-source descriptive contrast, retaining current-status and eligible subset definitions. No new significance test or individual prediction. |
| C02 | Historical casual-only: DSW minus never-married daters | 25 − 17 = 8.0 percentage points | F02 Within-source descriptive contrast, retaining current-status and eligible subset definitions. No new significance test or individual prediction. |
| C03 | Lifetime app use: never-married minus DSW | 52 − 36 = 16.0 percentage points | F03 Within-source descriptive contrast, retaining current-status and eligible subset definitions. No new significance test or individual prediction. |
| C04 | Lifetime app use: cohabiting minus DSW | 46 − 36 = 10.0 percentage points | F03 Within-source descriptive contrast, retaining current-status and eligible subset definitions. No new significance test or individual prediction. |
| C05 | DSW ever-users: current plus past-year-only app use | 15 + 17 = 32.0 percent | F04 Sum of rounded mutually exclusive categories among DSW EVER-users, not all divorced adults. |
| C06 | DSW ever-users: last use at least one year ago | 30 + 38 = 68.0 percent | F04 Sum of rounded mutually exclusive categories among DSW ever-users. Reference windows retained. |
| C07 | Ever remarried after divorce: men minus women | 68 − 64 = 4.0 percentage points | F05 Descriptive within-source comparison, with population/time boundaries retained. No causal inference or new test. |
| C08 | Current divorced cohabitation: men minus women | 19 − 15 = 4.0 percentage points | F08 Descriptive within-source comparison, with population/time boundaries retained. No causal inference or new test. |
| C09 | Resident stepchild among currently remarried: men minus women | 9 − 4 = 5.0 percentage points | F10 Descriptive within-source comparison, with population/time boundaries retained. No causal inference or new test. |
| C10 | Shared biological child among currently remarried: men minus women | 48 − 44 = 4.0 percentage points | F09 Descriptive within-source comparison, with population/time boundaries retained. No causal inference or new test. The original shared-biological-child sex difference was not significant. |
| C11 | Canada subsequent-union share: 2017 minus 2006 | 26 − 23 = 3.0 percentage points | F11 Descriptive within-source comparison, with population/time boundaries retained. No causal inference or new test. |
| C12 | Canada subsequent-union share: Canadian-born minus foreign-born | 31 − 13 = 18.0 percentage points | F13 Descriptive within-source comparison, with population/time boundaries retained. No causal inference or new test. |
| C13 | Australia five-year reuniting: cohabiting minus married | 9 − 7 = 2.0 percentage points | F28 Approximate same-study cumulative incidence. Authors report no significant relationship-type difference. Not a cross-country comparison. |
| C14 | Canada conditional mean interval: women minus men | 4.8 − 4.5 = 0.3 years | F15 Historical mean among people with a current subsequent union, not everyone’s expected wait or a recommended delay. |
| C15 | Canada shared children: subsequent marriage minus common-law | 56 − 32 = 24.0 percentage points | F17 Same survey but different current union groups; no causal effect of marriage or compatible pool to add together. |
| C16 | NSFG first repartnering by year 5: cohabitation minus direct remarriage | 45 − 8 = 37.0 percentage points | F18 First competing routes, unweighted censored life tables. Later remarriage after cohabitation is not counted in direct-remarriage entry. |
| C17 | NSFG first repartnering by year 10: cohabitation minus direct remarriage | 62 − 13 = 49.0 percentage points | F19 First competing routes, unweighted censored life tables. Later remarriage after cohabitation is not counted in direct-remarriage entry. |
| C18 | NSFG first repartnering by year 15: cohabitation minus direct remarriage | 67 − 13 = 54.0 percentage points | F20 First competing routes, unweighted censored life tables. Later remarriage after cohabitation is not counted in direct-remarriage entry. |
| C19 | NSFG ten-year cohabitation exits: remarriage minus dissolution | 54 − 41 = 13.0 percentage points | F23 Clock starts at post-dissolution cohabitation entry, subset n=968, not original marital breakup or all divorced women. |
| C20 | HRS decade after gray divorce: men minus women new unions | 37 − 22 = 15.0 percentage points | F24 Approximate historical within-study estimates, not dating interest or all non-co-residential relationships. |
| C21 | HRS women conditional years since divorce: remarriage minus cohabitation | 4.3 − 2.9 = 1.4 years | F25 Difference of pathway-specific descriptive means, not recommended waiting or a mean for those who never repartnered. |
| C22 | HRS decade after separation: men minus women new unions | 26 − 12 = 14.0 percentage points | F26 Historical separation-origin study, same source; do not compare directly as a trend with divorce-origin S06. |
| C23 | HRS decade after separation: men minus women reconciliation | 11 − 7 = 4.0 percentage points | F26 Historical weighted competing pathways; no new significance or causal claim. |
| C24 | ACS annual remarriage rate: males minus females, 2023 | 34.4 − 18.5 = 15.9 remarriages per 1,000 previously married | F34 Rate difference, not percentage points; includes widowhood and differs from lifetime divorced-only remarriage history. |
Different clocks explain apparently conflicting percentages
The NSFG ten-year first-route estimates of 62% cohabiting and 13% directly remarrying begin at marital dissolution. Its later 54% remarriage estimate begins at cohabitation entry among a smaller selected subset. Pew’s 66% lifetime remarriage history is a different population and design again. These numbers cannot be subtracted across sources to infer how many divorced people will marry, how long they should wait or whether their relationships will last.
Common questions about dating after divorce
How long do divorced people wait to date?
The selected evidence does not establish a universal current average for a first date. Canada’s 4.8-year female and 4.5-year male means concern time to a current subsequent co-residential union in 2017, not first dates. They are conditional on having repartnered. Original source.
What percentage of divorced adults use dating apps?
Pew’s July 2022 estimate is 36% lifetime use in a combined divorced, separated and widowed category. It cannot be reported as divorced-only use or proof that someone used an app after a divorce. Original source.
Do most divorced singles want a new relationship?
Not necessarily. In Pew’s October 2019 research, 56% of divorced singles were not looking for dates or commitment. This is a historical preference among study-defined singles, not a current national activity measure. Original source.
Does only 13% directly remarry mean few people marry again?
No. In the selected NSFG life tables, direct remarriage is only the first repartnering route. Many first cohabit; marriage after that cohabitation is a separate later transition. The sample, age range and clock also differ from lifetime remarriage histories. Original source.
Does 95% exiting a cohabitation mean 95% broke up?
No. The ten-year exit estimate includes 54% marrying and 41% dissolving the cohabitation in the selected NSFG cohort. It is an unweighted, censoring-aware estimate among cohabitors, not all divorced adults. Original source.
What share of divorced Americans have remarried?
Pew’s SIPP analysis puts lifetime remarriage at 66% among ever-divorced adults 15+ by the 2023 reference period. It includes remarriages that later ended and is not a prospective probability for someone newly divorced. Original source.
How common is reconciliation after separation at 50+?
The HRS separation-origin analysis estimates roughly 7% of women and 11% of men reconciled within ten years. It begins at separation, not legal divorce, and is distinct from the Australian couple-level reuniting measure. Original source.
Are these findings measured in 2027?
No. The title identifies the 2027 editorial edition reviewed November 2, 2026. Every finding retains its actual survey/reference period, with historical and publication dates distinguished. Original source.
Methodology and limitations
Coverage and contribution
MyLittleDesire compiled 101 source-linked numeric observations, organized into 37 grouped findings, from ten contributing original-source records. These include related categories, groups and time points; they are not 101 independent studies. The underlying programs include Pew’s ATP, SIPP, Canadian GSS, NSFG, HRS, HILDA, a regional maternal cohort and ACS. Two HRS analyses share the same survey infrastructure, and Pew’s ATP findings come from different waves. The contribution is accessible synthesis, compatible descriptive comparisons, four chart designs and 24 reproducible calculations, without claiming new survey fieldwork or a complete systematic review.
Edition and actual observation dates
2027 is the editorial edition. Source review was completed November 2, 2026. No 2027 observations are claimed. A 2026 publication can analyze older data, as the Australian HILDA study does. The regional mothers’ study recruited in 2004–2006, Canadian results use 2017 GSS, and the US sources retain their actual historical survey/reference periods. No old observation is relabeled as a new measurement.
Verification scope
Original web analyses, selected methodological descriptions, questionnaires/toplines, original chart labels and journal tables were checked. Relevant Pew and BGSU images were inspected visually. Original journal content retrieved through public indexing supplied methods and selected tables when direct HTTP requests returned a challenge. This verifies selected published values; it is not an audit of every respondent record or every report item. Missing selected subgroup n and uncertainty remain explicitly unavailable.
Survey populations and denominators
Pew’s 2019 divorced-only non-looking figure excludes separated people, whereas its casual-only and 2022 app figures combine divorced, separated and widowed groups. App recency is conditional on lifetime use. The 2025 Pew remarriage/children findings use SIPP with a 2023 reference period, not the ACS source used for other parts of that report. Education uses 25+ rather than 15+. Full report n is recorded separately from selected subgroup valid n and is not silently substituted for it.
First routes, later transitions and life tables
Song’s NSFG analysis selects women ages 20–49 at interview whose first marriage dissolved within the preceding fifteen years. The clock begins with separation or legal divorce, whichever was earlier. Panel A describes the first new co-residential route. Panel B starts a new clock at cohabitation entry among 968 cohabitors and measures marriage or dissolution. Published multiple-decrement life tables are unweighted and account for censoring. Rounded route components may differ from the rounded total by a point. The first direct-remarriage share does not include later marriage following cohabitation.
Older-adult and Australian comparisons
The HRS divorce-origin study and separation-origin study have different eligibility and starting events; both measure co-residential unions and exclude dating/LAT. Their similar program does not make their results a time trend or independent replication. Australian reuniting is a couple-level return to a shared household, with repartnering/death treated as competing outcomes. It covers more than legal divorce and does not measure emotional reconciliation. Adjusted hazard ratios retain their references and reported significance thresholds; no probability conversion or new tests were performed.
Conditional timelines and parenting findings
Canada’s mean interval before the current subsequent union applies only to those with that current union. Its median duration is time already accumulated, not how long a future partnership lasts. The regional mothers’ sample covers one US metro and incomplete monthly observation, averaging 14.58 out of 24 assessments. Baseline relationship status is not a dating-onset date after legal finalization. Cohabitation/remarriage counts may overlap; no unique combined total or causal effect on children is inferred.
Source discrepancies and exclusions
A commercial 2026 dating-timing survey was withheld because its linked data and published chronology/weighting could not be reconciled. Further details are in the owner audit. Other withheld items include conflicting maternal breakup/end-status descriptions and women’s pathway percentages totaling 102% in the HRS separation paper. BGSU Figure 2 contradicts a blanket narrative claim that male annual remarriage rates exceed female rates at every age; the chart-verified selected values are retained. The Australian methods/Table 2 sample is consistent at 3,382 while one continued table header differs; the conflicting header is not used.
Precision, uncertainty and causality
Calculation results use one decimal place in the downloadable tables and workbook. Compatible category sums are percentages; percentage gaps use percentage points, time differences use years and annual-rate gaps retain events per 1,000. We do not pool incompatible surveys, invent subgroup intervals or assign overall margins to subgroups. The original studies’ caveats and stated nonsignificant differences remain visible. Descriptive contrasts and adjusted associations do not establish causes or a recommended dating timetable.
Country coverage and updates
US evidence is the most detailed in this selection. Canada and Australia supply differently defined historical/currently published research. An ONS registration bulletin provides England/Wales context, but no comparable UK divorce-only dating-start rate was established. There is no country league table. Recheck source corrections, actual periods, definitions and bases before changing data; rebuild affected calculations, charts and text together. Preserve the evergreen URL and use honest publication/review dates.
Related MyLittleDesire research
Marriage and Divorce Statistics covers broader legal/demographic patterns. Cohabitation Statistics covers living arrangements. Online Dating Statistics covers platforms, Singles and Singlehood Statistics covers single life, and Dating Intentions Statistics covers goals. Romance Scam Statistics covers fraud. This hub focuses on post-divorce/separation transitions and their measurement.
Original-source bibliography
- S01 · Pew Research Center. A profile of single Americans.
Role: Original research or original survey analysis
Published: 2020-08-20
Actual data: 2019-10-16 to 2019-10-28
Population: Adults 18+; selected single, divorced-only and divorced/separated/widowed dating-market subsets
Overall study n: 4,860
Method: Original weighted probability-based American Trends Panel analysis, report and topline. Single excludes marriage, cohabitation and committed romantic relationships.
Limits: Historical, not current/2027. The divorced-only non-looking figure excludes separated people; the casual-only figure combines divorced, separated and widowed daters. Selected valid subgroup n/intervals not printed.
Supporting document 1 · Supporting document 2
Reviewed November 2, 2026. - S02 · Pew Research Center. About half of never-married Americans have used an online dating site or app.
Role: Original research or original survey analysis
Published: 2023-02-24
Actual data: 2022-07-05 to 2022-07-17; selected 2019 comparison
Population: Adults 18+ overall; recency figures concern platform ever-users within current marital-status groups
Overall study n: 6,034
Method: Original release, two original charts, topline and methods verified. ATP 4,996 plus KnowledgePanel LGB oversample 1,038, weighted to US adults. Internet-user question is combined back to all adults in the published adoption chart.
Limits: Divorced, separated and widowed are combined, not divorced-only. Lifetime platform use may predate the divorce. Current/recent figures have ever-user denominators. Selected subgroup n unavailable; overall margin not applied.
Supporting document 1 · Supporting document 2
Reviewed November 2, 2026. - S03 · Pew Research Center / US Census SIPP. 8 facts about divorce in the United States: remarriage, cohabitation and children.
Role: Original research or original survey analysis
Published: 2025-10-16
Actual data: December 2023 reference period; 2024 SIPP collection
Population: Ever-divorced adults 15+; education 25+; current-divorced or currently-remarried subsets as stated
Overall study n: Not supplied for the selected analysis; see methods
Method: Original analysis, original remarriage/children charts and four-page methods checked. Selected facts 7–8 use the 2024 Survey of Income and Program Participation, December reference values and replicate weights; they do not use ACS simply because other parts of the report do.
Limits: Ever remarried includes remarriages that later ended. A cross-sectional lifetime history is not an annual rate, a follow-up probability after a new divorce or current partnership prevalence. Cohabitation and child figures have different current-status denominators. Selected unweighted n not printed.
Supporting document 1
Reviewed November 2, 2026. - S04 · Statistics Canada. Family matters: New relationships after separation or divorce.
Role: Original research or original survey analysis
Published: 2019-05-15; archived
Actual data: 2017 General Social Survey; selected 2006 comparison
Population: People ages 35–64 currently married or common-law; selected second/subsequent-union groups
Overall study n: Not supplied for the selected analysis; see methods
Method: Original government release and linked infographic record checked. Repartnering means entering a new marriage or common-law union after separation/divorce.
Limits: Historical, not a 2026/2027 dating measure. Current-couple denominator excludes people not currently co-residing with a partner. Waits are conditional means among those in a current subsequent union; duration is duration so far, not expected survival. Exact selected subgroup n/intervals not retrieved.
Supporting document 1
Reviewed November 2, 2026. - S05 · Haoming Song / Population Research and Policy Review. Women’s Divergent Union Transitions After Marital Dissolution in the United States.
Role: Original research or original survey analysis
Published: First online 2021-08-25; journal issue June 2022
Actual data: 2011–2017 NSFG retrospective union histories; most selected transitions after 2000
Population: Women ages 20–49 at interview whose first marriage dissolved within 15 years; cohabitation-exit subset
Overall study n: 2,129
Method: Original full methods and Table 3 verified through indexed original manuscript retrieval when direct HTTP returned a challenge. National Survey of Family Growth 2011–13, 2013–15, 2015–17 pooled; cycles initially 15–44, last cycle 15–49, analytical women 20–49. Multiple-decrement life tables account for censoring; published life-table estimates are UNWEIGHTED. Exit sample n=968.
Limits: Dissolution starts at separation or legal divorce, whichever first. Retrospective histories, not prospective 2027 follow-up. First repartnering event is cohabitation or direct remarriage; later marriage to a cohabiting partner is a different transition. Rounded component estimates need not exactly sum to the rounded total. Not all ages or men; no causal effects.
Supporting document 1 · Supporting document 2
Reviewed November 2, 2026. - S06 · Brown, Lin, Hammersmith and Wright / Demography. Repartnering Following Gray Divorce: The Roles of Resources and Constraints for Women and Men.
Role: Original research or original survey analysis
Published: April 2019; author manuscript in PMC April 2020
Actual data: 1998–2014 Health and Retirement Study
Population: Adults experiencing divorce at age 50+ during observation
Overall study n: 1,131
Method: Original abstract, methods and selected results verified through indexed original manuscript/publisher retrieval. Prospective HRS with discrete-time competing-risk models, baseline weights and multiple imputation. Final analytic n=1,131, 352 observed repartnerings.
Limits: Coresidential cohabitation/remarriage, not all dating or LAT. Historical cohort; not a current individual success forecast. Conditional descriptive time-since-divorce means by observed pathway are not everyone’s waiting time or a survival median. Shared HRS program with S07.
Supporting document 1 · Supporting document 2
Reviewed November 2, 2026. - S07 · Brown and colleagues / Journal of Marriage and Family. Marital separation, reconciliation, and repartnering in later life.
Role: Original research or original survey analysis
Published: First online 2024-07-09; February 2025 issue
Actual data: 1998–2018 Health and Retirement Study
Population: First observed marital separation at 50+; 526 women and 549 men in different-sex marriages
Overall study n: 1,075
Method: Original publisher full methods and selected results inspected. Baseline-weighted prospective event histories, up to ten years, censoring and ten multiply imputed datasets. New unions identified using partner IDs; non-co-residential dating not measured.
Limits: Separation is the clock origin, not completed divorce. Some remain legally separated; shared HRS infrastructure with S06 means these are not independent replications. Overall/sex counts are eligible analytical groups, not ten-year uncensored raw denominators. Women’s reported pathway shares 46% cohabitation plus 56% remarriage conflict and are withheld.
Supporting document 1 · Supporting document 2
Reviewed November 2, 2026. - S08 · Gray, Evans and Reimondos / Australian National University. Trying Again: Reuniting After Cohabitation or Marriage Separation.
Role: Original research or original survey analysis
Published: 2026-07-16
Actual data: 2001–2023 HILDA, Waves 1–23
Population: Previously co-residential couples; 3,382 separated couples with follow-up, including 1,117 married and 2,205 cohabiting
Overall study n: 3,382
Method: Original open-access full methods, cumulative-incidence discussion and Table 2 inspected via public original retrieval. Couple-level competing-risk/event-history analyses treat new partnerships/death as competing outcomes; follow-up up to ten years, average 3.6.
Limits: Reuniting means sharing a household again, not emotional reconciliation or legal remarriage. Includes cohabitation separations, not divorce-only. Mean couple age/observed eligibility differs from US older-adult studies. Hazard ratios are adjusted associations, not probabilities or treatment effects. One continued Table 1 header says 3,385 versus methods/Table 2 3,382; latter consistent counts retained, conflicting header not used.
Supporting document 1
Reviewed November 2, 2026. - S09 · Langlais and colleagues / Journal of Child and Family Studies. Is It OK If Mommy Dates? The Influence of Mother’s Post-Divorce Dating Transitions for Children’s Behaviors.
Role: Original research or original survey analysis
Published: First online 2021-10-08; June 2022 issue
Actual data: Recruitment spring 2004–spring 2006; monthly follow-up for 24 months
Population: Mothers filing for divorce with an elementary-age child living with them at least half each week
Overall study n: 316
Method: Original manuscript methods/procedures and selected counts inspected through public retrieval. Court-petition recruitment, monthly relationship records up to two years; average completion 14.58/24 surveys, not complete observation for every mother.
Limits: Regional recruited mothers, not national all-divorce prevalence or all parents. Baseline relationship status is not onset after legal finalization; separation could predate filing. Counts of cohabitation/remarriage may overlap. Breakup narrative 24% versus 160 mothers is inconsistent and withheld; end-study 86% relationship wording/routing not relied on. No causal child-wellbeing claim.
Supporting document 1
Reviewed November 2, 2026. - S10 · Natalie Bankey / BGSU NCFMR. Remarriage Rate, 2023 (FP-25-03).
Role: Original research or original survey analysis
Published: 2025 profile; page updated 07/08/2026
Actual data: 2023 ACS; 2008 comparison
Population: Source-defined previously married at-risk adults 18+; includes widowhood, not divorced-only
Overall study n: Not supplied for the selected analysis; see methods
Method: Original university text and Figures 2/5 visually inspected; ACS 1-year IPUMS USA v15.0 analysis. Rates are remarriages per 1,000 source-defined previously married adults, not percentages.
Limits: Annual rate differs from lifetime remarriage history and dating behavior. Current at-risk previously married pool includes widowhood; selected unweighted n/intervals not supplied. Figure 2 confirms an 18–29 female rate above the male rate, contradicting the prose claim that males are higher across every age; blanket claim excluded.
Supporting document 1 · Supporting document 2
Reviewed November 2, 2026. - S11 · Office for National Statistics. Marriages and civil partnerships in England and Wales: 2023.
Role: Context only; zero numbered findings
Published: 2025-11-18 corrected bulletin
Actual data: 2023 registered events
Population: Legal marriage/civil-partnership registrations, not a sample of daters
Overall study n: Not supplied for the selected analysis; see methods
Method: Original corrected bulletin read for geographic/definition context. No numbered quantitative findings selected.
Limits: No comparable UK divorce-only dating-start measure established. A registry is not dating activity, England/Wales is not all UK, and previously partnered categories can include widowhood.
Reviewed November 2, 2026.
How to cite this resource
MyLittleDesire. Dating After Divorce Statistics 2027 (2027 editorial edition; source review November 2, 2026). https://mylittledesire.com/dating-after-divorce-statistics/. Accessed [your actual access date].