Relationship arguments can be measured by their frequency, subject, behavior and outcome. A survey about feeling stressed over money answers a different question from one about raising a voice or resolving a difficult discussion. This guide keeps those definitions attached to the evidence.
The statistics describe groups of respondents. They do not establish a universal healthy number of arguments or diagnose any individual relationship. Threats, coercion and violence should not be reframed as ordinary disagreements. The practical guidance below is attributed separately from the survey findings.
What are the key relationship-conflict findings?
36%
22%
selected tone or attitude as a subject they sometimes argue about.US current relationships · Jan.–Feb. 2026 · n=674. Source [S01]
said arguments or disagreements typically happen a few times a month.US current relationships · Jan.–Feb. 2026 · n=673. Source [S01]
50%
34%
rated their argument style as very or somewhat healthy.US serious relationships · Apr.–May 2022 · Self-assessment. Source [S02]
agreed that spending is often a source of relationship conflict.US partnered item base · January 2024 · n=1,371. Source [S05]
32%
45%
agreed with the spending-conflict statement in the Canadian survey.Canada married/cohabiting base · January 2024 · n=1,472. Source [S04]
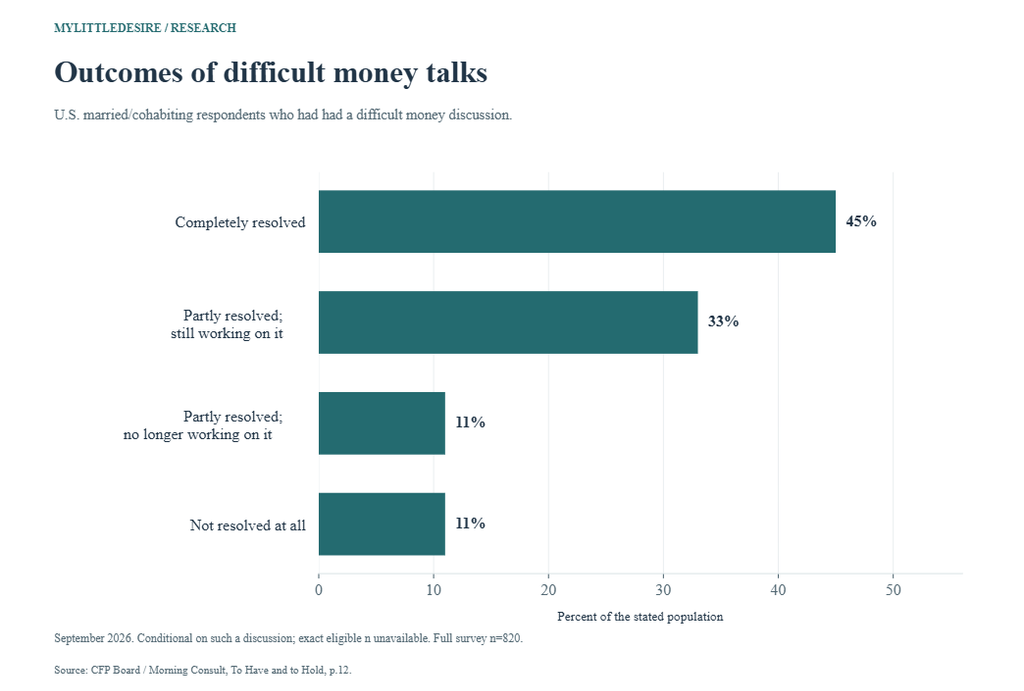
said their most recent difficult money discussion was completely resolved.US conditional group who had had such a discussion · September 2026. Source [S03]
What does a relationship-conflict statistic measure?
| Measure | What is being reported | Interpretation to avoid |
|---|---|---|
| Frequency | How often respondents typically argue or disagree | A recommended number of arguments or a clinical threshold. |
| Topic selection | Subjects respondents say they sometimes argue about | A percentage breakdown of every argument that occurs. |
| Behavior | How often respondents say they do something during disagreements | An independently observed or diagnosed relationship pattern. |
| Perceived style | Whether people consider their arguing style healthy | A professional assessment or proof of safety. |
| Stress or tension | Subjects or circumstances respondents find stressful | The proportion who had a specific argument in a stated period. |
| Discussion outcome | How a respondent describes their most recent difficult conversation | The probability that counseling, a financial product or a communication technique works. |
For related measures of satisfaction and communication, see our relationship satisfaction, trust and communication statistics. Satisfaction, stress and disagreement can coexist; the questions do not measure the same outcome.
ALSO READ:-
First Date Safety Statistics 2027
How Couples Meet Statistics 2027
Dating After Divorce Statistics 2027
Dating Over 50 Statistics 2027
What do couples most often say they argue about?
In the same poll, tone or attitude led the listed subjects, followed by communication styles and money. The table shows the eight leading topics among the 22 asked about. Respondents could select several subjects, so the percentages are shares of people answering, rather than shares of all arguments.
F02 Q18 asks which subjects respondents and their partner sometimes argue about; multiple selections allowed. Selected leading eight of 22 listed topics. Percentages are shares of eligible respondents, not shares of all arguments; do not add them.
| Measure / group | Published result | Population and actual period | Original source |
|---|---|---|---|
| Tone or attitude | 36% | US adult citizens currently in a romantic or sexual relationship Eligible n=674. 2026-01-29 to 2026-02-01 | Original source [S01] Original results PDF Q18, physical pp.5 and 49–50; unweighted total base n=674 printed on p.50 |
| Communication styles | 29% | US adult citizens currently in a romantic or sexual relationship Eligible n=674. 2026-01-29 to 2026-02-01 | Original source [S01] Original results PDF Q18, physical pp.5 and 49–50; unweighted total base n=674 printed on p.50 |
| Money | 26% | US adult citizens currently in a romantic or sexual relationship Eligible n=674. 2026-01-29 to 2026-02-01 | Original source [S01] Original results PDF Q18, physical pp.5 and 49–50; unweighted total base n=674 printed on p.50 |
| Emotional needs | 23% | US adult citizens currently in a romantic or sexual relationship Eligible n=674. 2026-01-29 to 2026-02-01 | Original source [S01] Original results PDF Q18, physical pp.5 and 49–50; unweighted total base n=674 printed on p.50 |
| Life decisions | 21% | US adult citizens currently in a romantic or sexual relationship Eligible n=674. 2026-01-29 to 2026-02-01 | Original source [S01] Original results PDF Q18, physical pp.5 and 49–50; unweighted total base n=674 printed on p.50 |
| Household chores | 21% | US adult citizens currently in a romantic or sexual relationship Eligible n=674. 2026-01-29 to 2026-02-01 | Original source [S01] Original results PDF Q18, physical pp.5 and 49–50; unweighted total base n=674 printed on p.50 |
| Quality time together | 17% | US adult citizens currently in a romantic or sexual relationship Eligible n=674. 2026-01-29 to 2026-02-01 | Original source [S01] Original results PDF Q18, physical pp.5 and 49–50; unweighted total base n=674 printed on p.50 |
| Immediate or extended family relationships | 15% | US adult citizens currently in a romantic or sexual relationship Eligible n=674. 2026-01-29 to 2026-02-01 | Original source [S01] Original results PDF Q18, physical pp.5 and 49–50; unweighted total base n=674 printed on p.50 |
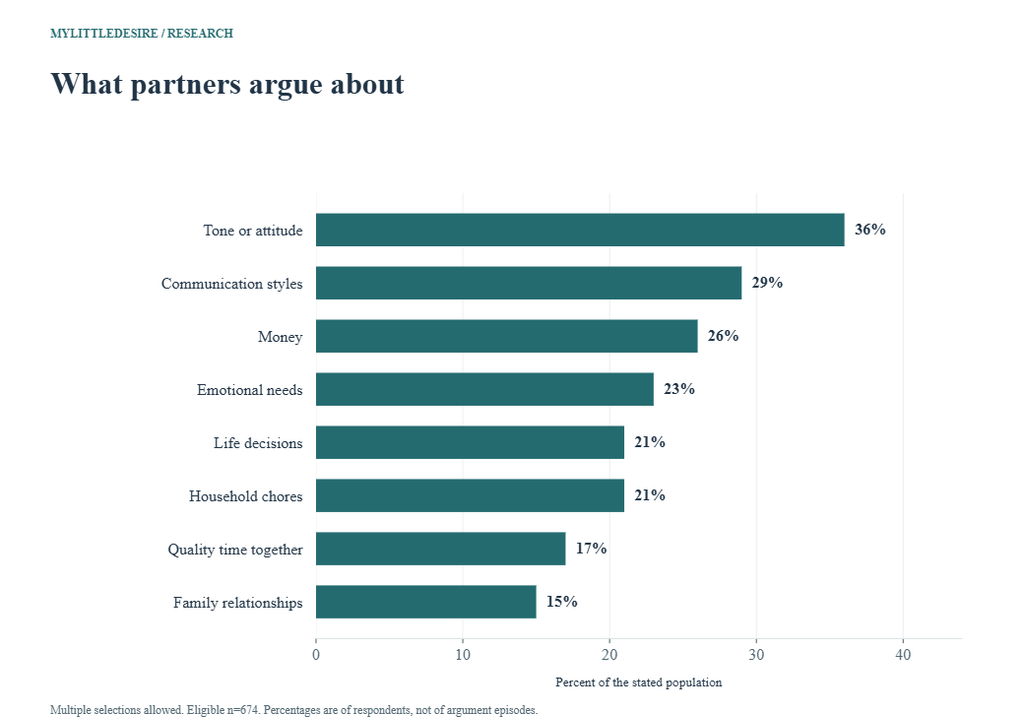
A topic is not an established cause. Someone may select chores and emotional needs when describing the same disagreement. The questionnaire does not identify how often each selected subject arises or which person initiated it.
How often do couples have arguments or disagreements?
YouGov’s early-2026 questionnaire asked people currently in a romantic or sexual relationship about their typical argument frequency. The full survey included 1,114 adult citizens; the answering base for this question was 673. The distribution below preserves every response category.
F01 Q17 asks how often respondents and their partner typically have arguments or disagreements. Weighted percentages; unweighted eligible n=673. Individual reports, not counted couple interactions. Categories total 100%.
| Measure / group | Published result | Population and actual period | Original source |
|---|---|---|---|
| Multiple times a day | 2% | US adult citizens currently in a romantic or sexual relationship Eligible n=673. 2026-01-29 to 2026-02-01 | Original source [S01] Original results PDF Q17, physical p.4; eligible base and total column p.47 (printed p.40) |
| Daily | 3% | US adult citizens currently in a romantic or sexual relationship Eligible n=673. 2026-01-29 to 2026-02-01 | Original source [S01] Original results PDF Q17, physical p.4; eligible base and total column p.47 (printed p.40) |
| A few times a week | 9% | US adult citizens currently in a romantic or sexual relationship Eligible n=673. 2026-01-29 to 2026-02-01 | Original source [S01] Original results PDF Q17, physical p.4; eligible base and total column p.47 (printed p.40) |
| Once a week | 7% | US adult citizens currently in a romantic or sexual relationship Eligible n=673. 2026-01-29 to 2026-02-01 | Original source [S01] Original results PDF Q17, physical p.4; eligible base and total column p.47 (printed p.40) |
| A few times a month | 22% | US adult citizens currently in a romantic or sexual relationship Eligible n=673. 2026-01-29 to 2026-02-01 | Original source [S01] Original results PDF Q17, physical p.4; eligible base and total column p.47 (printed p.40) |
| Once a month | 10% | US adult citizens currently in a romantic or sexual relationship Eligible n=673. 2026-01-29 to 2026-02-01 | Original source [S01] Original results PDF Q17, physical p.4; eligible base and total column p.47 (printed p.40) |
| A few times a year | 22% | US adult citizens currently in a romantic or sexual relationship Eligible n=673. 2026-01-29 to 2026-02-01 | Original source [S01] Original results PDF Q17, physical p.4; eligible base and total column p.47 (printed p.40) |
| Less often than a few times a year | 17% | US adult citizens currently in a romantic or sexual relationship Eligible n=673. 2026-01-29 to 2026-02-01 | Original source [S01] Original results PDF Q17, physical p.4; eligible base and total column p.47 (printed p.40) |
| Never | 5% | US adult citizens currently in a romantic or sexual relationship Eligible n=673. 2026-01-29 to 2026-02-01 | Original source [S01] Original results PDF Q17, physical p.4; eligible base and total column p.47 (printed p.40) |
| Prefer not to say | 3% | US adult citizens currently in a romantic or sexual relationship Eligible n=673. 2026-01-29 to 2026-02-01 | Original source [S01] Original results PDF Q17, physical p.4; eligible base and total column p.47 (printed p.40) |
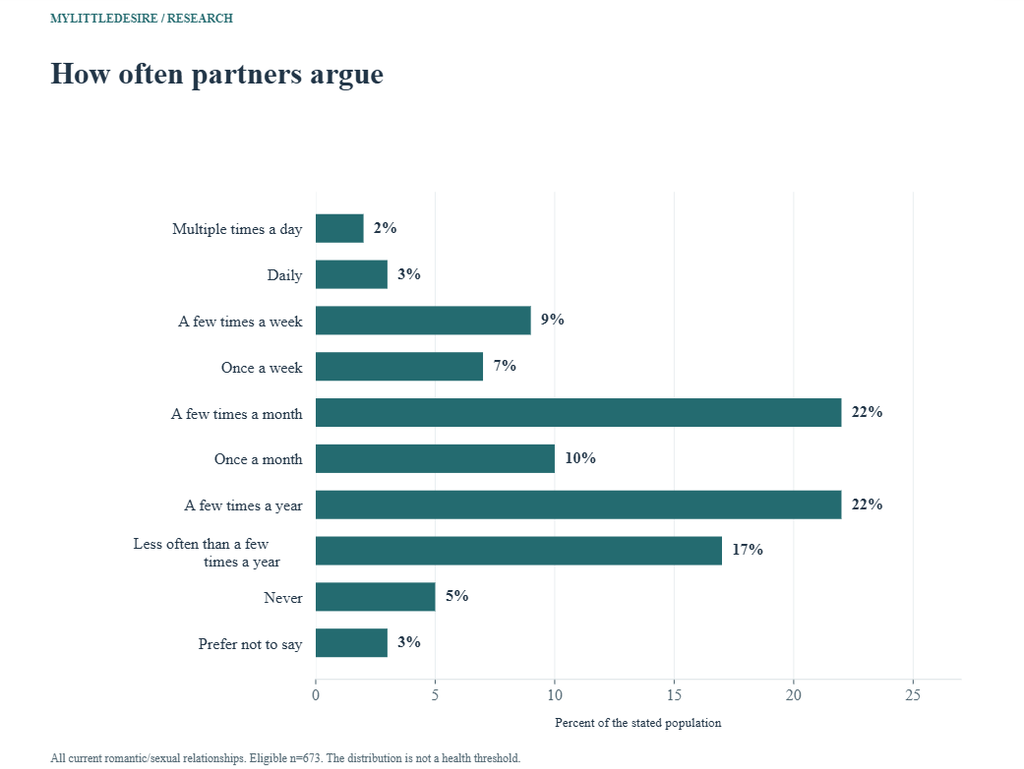
A response such as “a few times a month” is a broad frequency category. It cannot be converted into an exact annual count without inventing the number of arguments in each interval. The distribution also does not show whether those disagreements were respectful, frightening or resolved.
Do women and men report the same argument topics?
The 2026 gender columns differ on tone, chores and time together. These are separate respondents’ accounts. The survey does not compare both members of each couple, so it cannot establish which account is more accurate or who is responsible for a disagreement.
F03 Selected Q18 gender comparisons within the same 2026 poll. Respondent gender groups, not paired accounts from the same couple. Topics overlap. Descriptive differences do not establish a gender cause or individual relationship pattern.
| Measure / group | Published result | Population and actual period | Original source |
|---|---|---|---|
| Women: tone or attitude | 41% | US adult women citizens currently in a romantic or sexual relationship Eligible n=357. 2026-01-29 to 2026-02-01 | Original source [S01] Original Q18 gender columns, physical p.49; bases on p.50: women n=357, men n=317 |
| Men: tone or attitude | 29% | US adult men citizens currently in a romantic or sexual relationship Eligible n=317. 2026-01-29 to 2026-02-01 | Original source [S01] Original Q18 gender columns, physical p.49; bases on p.50: women n=357, men n=317 |
| Women: household chores | 27% | US adult women citizens currently in a romantic or sexual relationship Eligible n=357. 2026-01-29 to 2026-02-01 | Original source [S01] Original Q18 gender columns, physical p.49; bases on p.50: women n=357, men n=317 |
| Men: household chores | 15% | US adult men citizens currently in a romantic or sexual relationship Eligible n=317. 2026-01-29 to 2026-02-01 | Original source [S01] Original Q18 gender columns, physical p.49; bases on p.50: women n=357, men n=317 |
| Women: quality time together | 23% | US adult women citizens currently in a romantic or sexual relationship Eligible n=357. 2026-01-29 to 2026-02-01 | Original source [S01] Original Q18 gender columns, physical p.49; bases on p.50: women n=357, men n=317 |
| Men: quality time together | 11% | US adult men citizens currently in a romantic or sexual relationship Eligible n=317. 2026-01-29 to 2026-02-01 | Original source [S01] Original Q18 gender columns, physical p.49; bases on p.50: women n=357, men n=317 |
What do people report doing during arguments?
YouGov’s 2022 article uses a narrower group: people who were married, living together or in a serious relationship, with casual relationships excluded. It reports how often respondents said they raised their own voice, withdrew into silence, used swearing or name-calling, or cried.
F04 Article-published frequency of the respondent’s own behavior; not their report of their partner’s behavior. Selected categories only; not-sure and prefer-not-to-say responses are omitted from this display and retained in the original denominator. Exact eligible n is unavailable. Crying alone is not a clinical sign of unhealthy conflict.
| Measure / group | Published result | Population and actual period | Original source |
|---|---|---|---|
| Always or most of the time | 26% | US adult citizens in serious relationships, as defined in the accompanying YouGov article Exact eligible item/subgroup n unavailable. 2022-04-29 to 2022-05-05 | Original source [S02] Article “How do couples argue?”; original topline Q12, physical p.3 |
| Some of the time | 49% | US adult citizens in serious relationships, as defined in the accompanying YouGov article Exact eligible item/subgroup n unavailable. 2022-04-29 to 2022-05-05 | Original source [S02] Article “How do couples argue?”; original topline Q12, physical p.3 |
| Never | 19% | US adult citizens in serious relationships, as defined in the accompanying YouGov article Exact eligible item/subgroup n unavailable. 2022-04-29 to 2022-05-05 | Original source [S02] Article “How do couples argue?”; original topline Q12, physical p.3 |
F05 Article-published frequency of the respondent’s own behavior; not their report of their partner’s behavior. Selected categories only; not-sure and prefer-not-to-say responses are omitted from this display and retained in the original denominator. Exact eligible n is unavailable. Crying alone is not a clinical sign of unhealthy conflict.
| Measure / group | Published result | Population and actual period | Original source |
|---|---|---|---|
| Always or most of the time | 19% | US adult citizens in serious relationships, as defined in the accompanying YouGov article Exact eligible item/subgroup n unavailable. 2022-04-29 to 2022-05-05 | Original source [S02] Article “How do couples argue?”; original topline Q17, physical p.4 |
| Some of the time | 41% | US adult citizens in serious relationships, as defined in the accompanying YouGov article Exact eligible item/subgroup n unavailable. 2022-04-29 to 2022-05-05 | Original source [S02] Article “How do couples argue?”; original topline Q17, physical p.4 |
| Never | 31% | US adult citizens in serious relationships, as defined in the accompanying YouGov article Exact eligible item/subgroup n unavailable. 2022-04-29 to 2022-05-05 | Original source [S02] Article “How do couples argue?”; original topline Q17, physical p.4 |
F06 Article-published frequency of the respondent’s own behavior; not their report of their partner’s behavior. Selected categories only; not-sure and prefer-not-to-say responses are omitted from this display and retained in the original denominator. Exact eligible n is unavailable. Crying alone is not a clinical sign of unhealthy conflict.
| Measure / group | Published result | Population and actual period | Original source |
|---|---|---|---|
| Always or most of the time | 12% | US adult citizens in serious relationships, as defined in the accompanying YouGov article Exact eligible item/subgroup n unavailable. 2022-04-29 to 2022-05-05 | Original source [S02] Article “How do couples argue?”; original topline Q14, physical p.4 |
| Some of the time | 27% | US adult citizens in serious relationships, as defined in the accompanying YouGov article Exact eligible item/subgroup n unavailable. 2022-04-29 to 2022-05-05 | Original source [S02] Article “How do couples argue?”; original topline Q14, physical p.4 |
| Never | 53% | US adult citizens in serious relationships, as defined in the accompanying YouGov article Exact eligible item/subgroup n unavailable. 2022-04-29 to 2022-05-05 | Original source [S02] Article “How do couples argue?”; original topline Q14, physical p.4 |
F07 Article-published frequency of the respondent’s own behavior; not their report of their partner’s behavior. Selected categories only; not-sure and prefer-not-to-say responses are omitted from this display and retained in the original denominator. Exact eligible n is unavailable. Crying alone is not a clinical sign of unhealthy conflict.
| Measure / group | Published result | Population and actual period | Original source |
|---|---|---|---|
| Always or most of the time | 14% | US adult citizens in serious relationships, as defined in the accompanying YouGov article Exact eligible item/subgroup n unavailable. 2022-04-29 to 2022-05-05 | Original source [S02] Article “How do couples argue?”; original topline Q10, physical p.3 |
| Some of the time | 29% | US adult citizens in serious relationships, as defined in the accompanying YouGov article Exact eligible item/subgroup n unavailable. 2022-04-29 to 2022-05-05 | Original source [S02] Article “How do couples argue?”; original topline Q10, physical p.3 |
| Never | 51% | US adult citizens in serious relationships, as defined in the accompanying YouGov article Exact eligible item/subgroup n unavailable. 2022-04-29 to 2022-05-05 | Original source [S02] Article “How do couples argue?”; original topline Q10, physical p.3 |
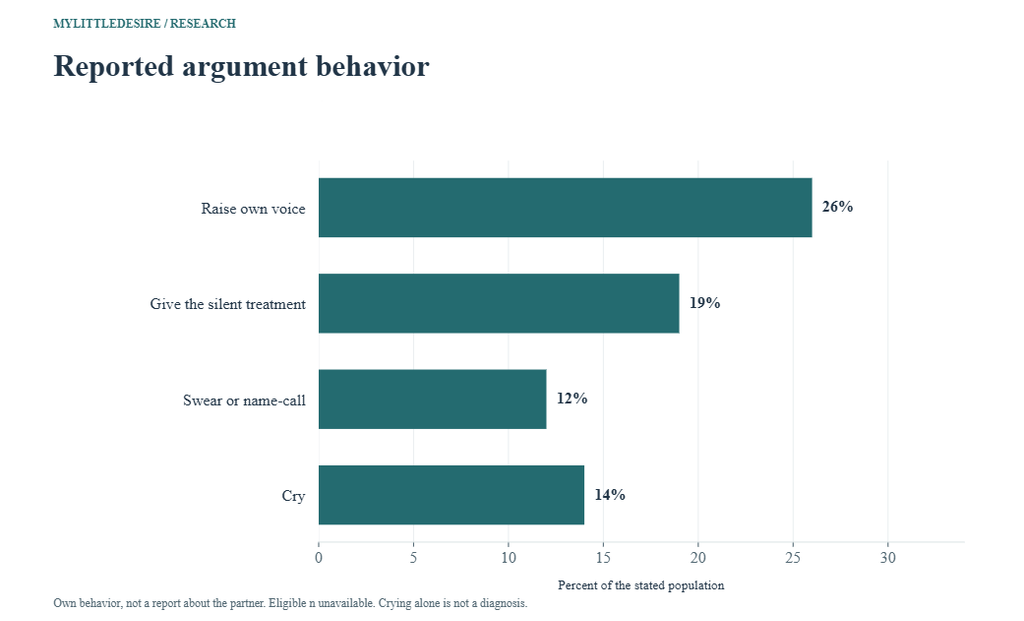
The selected categories leave out uncertainty and non-disclosure responses, so each displayed trio need not total 100%. The “always or most of the time” values are the combined figures published by YouGov. The figures refer to the respondent’s own behavior, not the separate questions about their partner’s behavior.
Crying can reflect many emotions and is not, by itself, evidence of abuse or an unhealthy relationship. Survey labels such as the silent treatment also lack the context needed to distinguish a harmful pattern from other forms of withdrawal. A clearly explained break with an intention to return to the discussion is a separate practical strategy described by Relate.
How do people assess the health of their argument style?
The 2022 poll also asked respondents to judge their own and their partner’s style of arguing. This records perception. It does not show that a professional observed or assessed the relationship.
F08 Very/somewhat healthy versus very/somewhat unhealthy, as published in the article. Self-assessment, not a professional diagnosis or observed outcome. Other response categories are not shown; the two values are not complements.
| Measure / group | Published result | Population and actual period | Original source |
|---|---|---|---|
| Very or somewhat healthy | 50% | US adult citizens in serious relationships, as defined in the accompanying YouGov article Exact eligible item/subgroup n unavailable. 2022-04-29 to 2022-05-05 | Original source [S02] Article “How do couples argue?”; original topline Q19, physical p.5 |
| Very or somewhat unhealthy | 30% | US adult citizens in serious relationships, as defined in the accompanying YouGov article Exact eligible item/subgroup n unavailable. 2022-04-29 to 2022-05-05 | Original source [S02] Article “How do couples argue?”; original topline Q19, physical p.5 |
The healthy and unhealthy totals are not complements because the source also allows uncertainty and non-disclosure. No cross-tabulation here establishes which of the behavior responses belongs to either style group.
Which issues were reported as relationship stressors in 2026?
A September 2026 CFP Board/Morning Consult survey asked married or cohabiting US adults to rank relationship stressors. This is a distinct measure from YouGov’s argument-topic question, and the populations and fieldwork dates differ. The table selects the leading seven of the nine reported subjects.
F09 Share placing each subject among their top three relationship stressors. Stress is not the same as having an argument. Top-three selections overlap; these are seven of the report’s nine categories. Full n=820; no causal conclusion.
| Measure / group | Published result | Population and actual period | Original source |
|---|---|---|---|
| Money among top three stressors | 65% | US adults married or living with a partner Eligible n=820. 2026-09-02 to 2026-09-04 | Original source [S03] Original CFP Board report physical/printed p.5, top-three stressor series |
| Health among top three | 46% | US adults married or living with a partner Eligible n=820. 2026-09-02 to 2026-09-04 | Original source [S03] Original CFP Board report physical/printed p.5, top-three stressor series |
| Work-life balance among top three | 36% | US adults married or living with a partner Eligible n=820. 2026-09-02 to 2026-09-04 | Original source [S03] Original CFP Board report physical/printed p.5, top-three stressor series |
| Household chores among top three | 35% | US adults married or living with a partner Eligible n=820. 2026-09-02 to 2026-09-04 | Original source [S03] Original CFP Board report physical/printed p.5, top-three stressor series |
| Job stress or insecurity among top three | 33% | US adults married or living with a partner Eligible n=820. 2026-09-02 to 2026-09-04 | Original source [S03] Original CFP Board report physical/printed p.5, top-three stressor series |
| Intimacy among top three | 30% | US adults married or living with a partner Eligible n=820. 2026-09-02 to 2026-09-04 | Original source [S03] Original CFP Board report physical/printed p.5, top-three stressor series |
| Parenting among top three | 27% | US adults married or living with a partner Eligible n=820. 2026-09-02 to 2026-09-04 | Original source [S03] Original CFP Board report physical/printed p.5, top-three stressor series |
F10 Two different questions about relationship stress and the most uncomfortable discussion subject. Different measures may overlap in respondents. Neither counts argument episodes or proves why conflict occurs.
| Measure / group | Published result | Population and actual period | Original source |
|---|---|---|---|
| Money ranked number-one relationship stressor | 34% | US adults married or living with a partner Eligible n=820. 2026-09-02 to 2026-09-04 | Original source [S03] Original CFP Board report physical/printed p.5, number-one series |
| Money identified as most uncomfortable discussion subject | 46% | US adults married or living with a partner Eligible n=820. 2026-09-02 to 2026-09-04 | Original source [S03] Original CFP Board report physical/printed pp.6–7; October 5 release |
Placing money among the top three stressors is broader than naming it the number-one stressor. A person can find a subject stressful without arguing about it. The survey does not test whether a financial adviser or an account arrangement changes relationship outcomes.
How often were difficult money discussions reported as resolved?
The CFP Board release reports whether people had experienced a difficult money discussion. Its report then describes the most recent discussion among those who had had one. The second result uses a conditional group with an exact sample size that is not printed.
F11 Share who had had a difficult money discussion with their spouse or partner. An ever-experience measure, not annual argument frequency. The release gives 83%; the report describes five in six. Do not infer the exact conditional respondent count by multiplying a rounded percentage by n=820.
| Measure / group | Published result | Population and actual period | Original source |
|---|---|---|---|
| Had a difficult money discussion | 83% | US adults married or living with a partner Eligible n=820. 2026-09-02 to 2026-09-04 | Original source [S03] Original October 5, 2026 release, Affordability section; report physical p.12 uses “five in six” |
F12 Distribution for the most recent difficult financial discussion, conditional on having had such a discussion. The chart subtitle supplies the conditional population. Exact eligible n is not printed. These are respondent-reported outcomes, not independently evaluated resolutions or effects of counseling.
| Measure / group | Published result | Population and actual period | Original source |
|---|---|---|---|
| Completely resolved | 45% | US married/cohabiting respondents who had had a difficult money conversation with their spouse or partner Exact eligible item/subgroup n unavailable. 2026-09-02 to 2026-09-04 | Original source [S03] Original CFP Board report physical/printed p.12, resolution chart and explicit conditional subtitle |
| Partially resolved; still working on it | 33% | US married/cohabiting respondents who had had a difficult money conversation with their spouse or partner Exact eligible item/subgroup n unavailable. 2026-09-02 to 2026-09-04 | Original source [S03] Original CFP Board report physical/printed p.12, resolution chart and explicit conditional subtitle |
| Partially resolved; no longer working on it | 11% | US married/cohabiting respondents who had had a difficult money conversation with their spouse or partner Exact eligible item/subgroup n unavailable. 2026-09-02 to 2026-09-04 | Original source [S03] Original CFP Board report physical/printed p.12, resolution chart and explicit conditional subtitle |
| Not resolved at all | 11% | US married/cohabiting respondents who had had a difficult money conversation with their spouse or partner Exact eligible item/subgroup n unavailable. 2026-09-02 to 2026-09-04 | Original source [S03] Original CFP Board report physical/printed p.12, resolution chart and explicit conditional subtitle |
What do US and Canadian surveys show about spending conflict?
Ipsos’s January 2024 studies for BMO provide spending-specific statements. The original US topline supplies the 1,371-person answering base behind the headline. Its question refers to spending being a frequent source of conflict; the broader phrase money conflict would lose that detail.
F15 Strongly/somewhat agree with two financial-relationship statements. Answering base n=1,371, not the full n=2,500. The release’s generic money-conflict headline is qualified by the original spending-specific item. No age subgroup estimate is used without its base.
| Measure / group | Published result | Population and actual period | Original source |
|---|---|---|---|
| Spending is often a source of relationship conflict | 34% | US partnered adults in the source’s W13Q9 financial-relationship items Eligible n=1,371. 2024-01-02 to 2024-01-19 | Original source [S05] Original linked US topline W13Q9, physical p.9, NET |
| Partner/spouse spends too much | 37% | US partnered adults in the source’s W13Q9 financial-relationship items Eligible n=1,371. 2024-01-02 to 2024-01-19 | Original source [S05] Original linked US topline W13Q9, physical p.10, NET |
The Canadian tables identify different eligible bases for the spending and income-tension items. The smaller income-tension base is kept beside its percentage. Perceived partner overspending is shown as a related financial perception, rather than treated as another direct count of arguments.
F13 Strongly/somewhat agree with two W13Q9 statements. Unweighted eligible n=1,472, weighted base 1,480. A perception of partner overspending is a different measure from reporting spending conflict; individual overlap is not supplied.
| Measure / group | Published result | Population and actual period | Original source |
|---|---|---|---|
| Spending is often a source of relationship conflict | 32% | Canadian adults married or living with a partner; item-specific bases apply Eligible n=1,472. 2024-01-02 to 2024-01-19 | Original source [S04] Original Canadian data Table 136, W13Q9, physical p.26 |
| Partner/spouse spends too much | 35% | Canadian adults married or living with a partner; item-specific bases apply Eligible n=1,472. 2024-01-02 to 2024-01-19 | Original source [S04] Original Canadian data Table 143, W13Q9, physical p.34 |
F14 Strongly/somewhat agree that different income levels are creating relationship tension. This item’s unweighted n=1,195 (weighted 1,202) is smaller than the spending-conflict base. The public table does not explain the entire base reduction. Do not relabel it as a result for all Canadian couples.
| Measure / group | Published result | Population and actual period | Original source |
|---|---|---|---|
| Different income levels create relationship tension | 24% | Canadian married/cohabiting respondents in the income-tension item’s published eligible base Eligible n=1,195. 2024-01-02 to 2024-01-19 | Original source [S04] Original Canadian data Table 139, W13Q9, physical p.30; published NET, not sum of rounded components |
These figures are not a country league table and no new statistical-significance test was performed. For account structures, shared responsibilities and financial conversations, see our couples’ money management statistics.
Which quarrel subjects did the UK commissioned survey report?
Starling’s April 2023 release reports money, family and children as leading couple-quarrel subjects. Censuswide conducted the omnibus in February 2023 among 4,000 people over 16. The release does not publish the exact partnered base or full question wording, so those limitations accompany the results.
F17 The commissioned release describes these as leading causes of couple arguments. The release supplies total n=4,000 over-16s, not the eligible couple/item base. Full question and response design are unavailable. These are reported subjects, not experimentally established causes or national incidence.
| Measure / group | Published result | Population and actual period | Original source |
|---|---|---|---|
| Money | 29% | Couples as described in Starling’s UK commissioned release; exact eligible item base unavailable Exact eligible item/subgroup n unavailable. 2023-02-15 to 2023-02-20 | Original source [S07] Starling original April 27, 2023 release, headline bullets; Censuswide methods in Notes to Editors |
| Each other’s families | 20% | Couples as described in Starling’s UK commissioned release; exact eligible item base unavailable Exact eligible item/subgroup n unavailable. 2023-02-15 to 2023-02-20 | Original source [S07] Starling original April 27, 2023 release, headline bullets; Censuswide methods in Notes to Editors |
| Children | 17% | Couples as described in Starling’s UK commissioned release; exact eligible item base unavailable Exact eligible item/subgroup n unavailable. 2023-02-15 to 2023-02-20 | Original source [S07] Starling original April 27, 2023 release, headline bullets; Censuswide methods in Notes to Editors |
The source’s use of “cause” describes reported subjects, rather than an experimental causal finding. Its separate association between shared finances and disagreements does not establish that opening a joint account prevents arguments.
How did Australian respondents answer a frequent-arguing statement?
AIFS asked respondents with a spouse or partner how much they agreed that they argue quite a lot. This is a subjective agreement scale, rather than a count of arguments per week. The survey was open and nonprobability; AIFS explicitly says it is not representative of the Australian population.
F16 Five agreement categories for “we argue quite a lot”. Weighted nonprobability sample, explicitly not nationally representative. Relationship-item n=3,262. Rounded values total 101%; the item measures subjective agreement, not a weekly argument count.
| Measure / group | Published result | Population and actual period | Original source |
|---|---|---|---|
| Strongly agree | 5% | Respondents with a spouse or partner in the AIFS relationship-quality items Eligible n=3,262. 2021-05-19 to 2021-06-30 | Original source [S06] AIFS original report Figure 2, frequent-arguing row; original figure visually checked |
| Agree | 11% | Respondents with a spouse or partner in the AIFS relationship-quality items Eligible n=3,262. 2021-05-19 to 2021-06-30 | Original source [S06] AIFS original report Figure 2, frequent-arguing row; original figure visually checked |
| Neither agree nor disagree | 20% | Respondents with a spouse or partner in the AIFS relationship-quality items Eligible n=3,262. 2021-05-19 to 2021-06-30 | Original source [S06] AIFS original report Figure 2, frequent-arguing row; original figure visually checked |
| Disagree | 40% | Respondents with a spouse or partner in the AIFS relationship-quality items Eligible n=3,262. 2021-05-19 to 2021-06-30 | Original source [S06] AIFS original report Figure 2, frequent-arguing row; original figure visually checked |
| Strongly disagree | 25% | Respondents with a spouse or partner in the AIFS relationship-quality items Eligible n=3,262. 2021-05-19 to 2021-06-30 | Original source [S06] AIFS original report Figure 2, frequent-arguing row; original figure visually checked |
The whole-number categories total 101% because of rounding. The distribution is left as published. It reflects May–June 2021 conditions and cannot be presented as a national 2027 prevalence estimate.
What communication approaches do specialist sources suggest?
Relate and the Victorian Government’s Better Health Channel offer practical communication guidance. These suggestions are separate from the survey results and are not assigned a success rate in this report.
- Choose a time when both people can focus on one issue.
- Describe the specific event, its effect and what you need, using your own perspective.
- Listen to the other person’s account and check that you understood it.
- If the conversation becomes heated, explain a pause and arrange to return when calmer.
- Look at whether a recurring topic also involves feeling unsupported, time pressure or another concern.
- Consider suitable relationship support if difficulties persist.
See Relate’s recurring-argument guidance [G01] and Better Health Channel’s communication guide [G02]. Relate also distinguishes abusive control from an ordinary argument. Abuse is not a shared communication failure, and the person causing harm remains responsible for it.
Which comparisons can readers reproduce?
The following arithmetic subtracts compatible published percentages within each source. Results are percentage-point differences, not relative percentage changes, new significance tests or evidence of cause. Categories from multiple-response questions can overlap.
| Comparison | First value | Second value | Difference | Qualification |
|---|---|---|---|---|
| US 2026 topics: tone minus money | 36% | 26% | +10 percentage points | Within one multiple-response question; categories overlap. A difference in reported topics, not a share of argument episodes. |
| US 2026 tone: women minus men | 41% | 29% | +12 percentage points | Different respondent groups, not paired partners. Descriptive difference, not a causal or significance test. |
| US 2026 chores: women minus men | 27% | 15% | +12 percentage points | Different respondent groups, not paired partners. Descriptive difference, not a causal or significance test. |
| US 2026 quality time: women minus men | 23% | 11% | +12 percentage points | Different respondent groups, not paired partners. Descriptive difference, not a causal or significance test. |
| US 2022 style: healthy minus unhealthy | 50% | 30% | +20 percentage points | Perceived argument style. Other response categories exist; no clinical interpretation. |
| US 2026 stress: money minus health in top three | 65% | 46% | +19 percentage points | Within one ranked-stressor item; respondent selections overlap. Stress is not argument incidence. |
| US 2026 difficult money talks: fully resolved minus unresolved | 45% | 11% | +34 percentage points | Conditional on having had a difficult money conversation; exact conditional n unknown. |
| UK 2023 reported quarrels: money minus families | 29% | 20% | +9 percentage points | Sponsor-reported categories; exact eligible base and full questionnaire unavailable. No causal interpretation. |
Common questions about relationship arguments and conflict
What do couples argue about most?
In YouGov’s early-2026 US topic question, tone or attitude led the listed responses. That result concerns a specified set of choices and a particular relationship population. Other questions, such as ranking stressors, can produce a different order.
How many arguments are normal in a relationship?
These sources do not establish a universal healthy quota. Frequency, conduct, fear, coercion and the ability to address problems are different considerations. A typical survey category is not a diagnosis.
Does arguing mean a relationship will end?
The selected cross-sectional surveys do not follow couples to establish an individual breakup probability. They cannot predict a particular couple’s future from one frequency or topic response.
Is money the leading cause of every couple’s conflict?
No universal claim follows from these data. One poll asks about argument topics, another ranks stressors, and another measures agreement with a spending-conflict statement. Keep each question and population attached to its answer.
Does the resolution percentage describe all couples?
The CFP Board outcome chart covers respondents who had had a difficult money discussion. The conditional group’s exact n is unavailable. It is not a resolution percentage for everyone surveyed.
Why does the title say 2027 when some data are older?
The year identifies the editorial edition prepared in November 2026. Each observation keeps its actual survey period. No future fieldwork or new original survey is claimed.
How was this resource researched, and what are its limits?
MyLittleDesire compiled selected published aggregates from original questionnaires, tables, research reports and first-party releases. Original methods and selected numerical passages were checked. AI assisted retrieval, organization and drafting. No new survey, respondent-level reanalysis, clinical assessment or hypothesis test was conducted.
The 65 observations form 17 grouped findings from seven contributing source records. All 65 numeric observations are percentages. Several are response categories or subgroups within the same survey, so they are not independent studies or independent samples. The key cards, four charts and eight calculations repeat selected inputs and do not increase the observation count.
- Coverage: the evidence concerns the US, Canada, the UK and a nonrepresentative Australian sample. It does not supply one comparable 2027 estimate across those countries.
- People and couples: most results describe individual respondents’ accounts; paired partners were not independently reconciled.
- Sampling: opt-in panels, demographic quotas, commissioned online surveys and an open nonprobability sample carry selection, nonresponse and self-report limitations. Weighting alone does not establish probability recruitment.
- Eligibility: serious relationships, current romantic/sexual relationships and married/cohabiting adults are distinct populations. They are not combined into a time trend.
- Missing bases: unavailable eligible and subgroup counts remain unknown. Overall study n is not substituted for the resolution subgroup or UK couple items.
- Question design: topic selections, top-three stressor rankings, agreement scales and most-recent discussion outcomes are separate measures.
- Precision: published NET values and rounded distributions are preserved. No respondent counts are reconstructed from rounded percentages.
Original sources and research notes
- S01. YouGov. Relationships and Valentine’s Day, January–February 2026: Q17 and Q18. Publication: 2026-02-12 (accompanying article). Actual period: 2026-01-29 to 2026-02-01. Overall study n=1,114. Eligible base: Q17 frequency: unweighted n=673. Q18 topics: unweighted n=674; men n=317, women n=357. Method: Web survey of YouGov opt-in panel, weighted for demographic and political variables. Original PDF physical p.7 methods; Q17 physical pp.4 and 47; Q18 physical pp.5 and 49–51. People in casual relationships are not excluded by Q1’s romantic-or-sexual relationship definition. Self-report by individuals, not independently observed arguments or matched couple reports. Topic selections overlap. No clinical threshold, causal effect or universal argument count. Overall sample n=1,114 is not the eligible base of Q17 or Q18. This population differs from the 2022 article’s serious-relationship definition. Supporting records: record 1.
- S02. YouGov. How and why do American couples argue? / Relationship Arguments survey. Publication: 2022-06-01. Actual period: 2022-04-29 to 2022-05-05. Overall study n=1,000. Eligible base: Exact serious-relationship and selected item n unavailable in the checked publication. Method: YouGov opt-in Internet panel, sample matching and weighting. Article defines serious relationships as married, living together or serious, excluding casual relationships. Article-published behavior and style figures are used; selected response components corroborated in original topline Q10, Q12, Q14, Q17 and Q19, physical pp.3–5. Original methods physical p.6. Self-reported behavior and perceived style are not clinical diagnoses. Crying alone is not evidence of unhealthy behavior or abuse. The topline has a generic relationship filter, so its raw frequency distribution and child-argument base are not substituted for article-specific figures. Missing item/subgroup n remains unavailable. No 2022–2026 trend is inferred. Supporting records: record 1.
- S03. CFP Board / Morning Consult. To Have and to Hold: Couples Navigating Money and Commitment. Publication: 2026-10-05. Actual period: 2026-09-02 to 2026-09-04. Overall study n=820. Eligible base: Overall n=820; resolution distribution is conditional on having had a difficult money conversation, with exact conditional n not supplied. Method: Online 10-question Morning Consult survey commissioned and analyzed by CFP Board. Original report physical pp.3 and 14 describes nationwide random selection; panel recruitment and detailed weighting are not established in the report. Stress chart physical p.5; discomfort p.7; resolution p.12. Publisher reports ±3.4 points for the full survey. Relationship stress and discomfort are not argument incidence. The stress chart permits top-three rankings, not a mutually exclusive distribution. Resolution chart explicitly covers those who have had a difficult money conversation. No reconstructed subgroup n or effectiveness claim about financial advice. Sponsor is a professional body for financial planners; its promotional conclusions are not treated as tested causal findings. Supporting records: record 1, record 2.
- S04. Ipsos / BMO, Canada. Relationship Wars / Real Financial Progress 2024 Canadian tables. Publication: 2024-02-09 (Ipsos release). Actual period: 2024-01-02 to 2024-01-19. Overall study n=2,500. Eligible base: Spending-conflict and partner-overspending items: unweighted n=1,472 (weighted 1,480). Income-tension item: unweighted n=1,195 (weighted 1,202). Method: Ipsos online panel survey commissioned by BMO, quotas and demographic weighting. Original W13Q9 Table 136 physical p.26, Table 139 p.30, Table 143 p.34; publication supplies top-two agreement NETs. Overall full survey n=2,500. Agreement with a conflict statement differs from counting arguments. Perceived overspending is not independently measured spending. Income-tension item has a smaller answering base; its 24% is not rebased to all 1,472 partnered respondents. No inferred cause, pooled estimate or country ranking. Panel recruitment is not established as probability sampling. Supporting records: record 1.
- S05. Ipsos / BMO, United States. Money Fights / BMO Financial Group–Ipsos US topline. Publication: 2024-02-09 (Ipsos release; linked topline stored in May directory). Actual period: 2024-01-02 to 2024-01-19. Overall study n=2,500. Eligible base: Selected W13Q9 items n=1,371; full adult sample n=2,500. Method: Ipsos panel survey commissioned by BMO, quotas and demographic weighting. Original linked US topline W13Q9 spending-conflict NET physical p.9, perceived partner overspending NET p.10. Fieldwork and methods p.1. The release’s broad money-conflict wording is narrowed here to the actual spending-conflict questionnaire item. The selected answering base is 1,371, not 2,500. Perceptions and self-reports are not observed transactions or clinical relationship assessments. Panel recruitment is not established as probability sampling. Supporting records: record 1.
- S06. Australian Institute of Family Studies. Relationships within the family: Families in Australia Survey 3. Publication: 2021-12-02. Actual period: 2021-05-19 to 2021-06-30. Overall study n=5,985. Eligible base: Figure 2 relationship-quality items n=3,262. Method: Open nonprobability Families in Australia Survey 3, age 18+. Post-stratification weights address selected demographic imbalances. Figure 2 shows five agreement categories for the frequent-arguing statement. Overall 5,985 participants; about 4,000 answered relationship questions. AIFS explicitly says the sample is not representative of the Australian population. Agreement with “we argue quite a lot” is subjective and not a standardized frequency count. Rounded five-category distribution totals 101%; no normalization. Data were collected during 2021 pandemic conditions. Supporting records: record 1.
- S07. Starling Bank / Censuswide. Money matters cause the most quarrels between couples. Publication: 2023-04-27. Actual period: 2023-02-15 to 2023-02-20. Overall study n=4,000. Eligible base: Overall survey of 4,000 people over 16; exact partnered/item n unavailable. Method: Censuswide omnibus commissioned by Starling; field dates and total sample reported in Notes to Editors. Selected headline argument categories appear in the release. Full questionnaire, sampling frame, weights, response options and eligible bases are not published on the checked page. Commercial sponsor release with limited methodological detail. Retain its description of reported leading quarrel topics; do not generalize to all UK adults or turn “cause” into a causal finding. Full n=4,000 is not the base of each couple finding. Joint-account correlations are not evidence that account sharing reduces arguments.
Practical guidance sources
- G01. Relate: We can’t stop arguing. Reviewed November 3, 2026. Practical relationship-communication guidance; no numeric observations counted.
- G02. Better Health Channel, Victorian Government: Relationships and communication. Reviewed November 3, 2026. Practical communication guidance; no numeric observations counted.
How to cite this resource
MyLittleDesire. Relationship Arguments & Conflict Statistics 2027. https://mylittledesire.com/relationship-conflict-statistics/.