Relationship privacy statistics describe several different things: what people consider acceptable, how comfortable they feel stating a need, whether they have shared account access, and whether someone used a device without their knowledge. A useful statistic keeps those distinctions visible.
In YouGov’s July 2023 US poll, 63% considered it acceptable to tell a partner they wanted to remain private on social media. In Pew’s October 2019 survey, 34% of partnered adults reported ever looking through their current partner’s phone without that person’s knowledge. One is an attitude; the other is a reported behavior. YouGov [S01]; Pew Research Center [S02].
This resource brings together 64 published percentage observations in 14 grouped findings from four research records, with four charts and original-source links. Two additional organizations supply practical guidance. The observations include response categories and subgroups within the same surveys, rather than 64 independent studies.
57%
63%
Rated setting personal boundaries very important.US adult citizens; July 2023; item n=1,998. YouGov [S01]
Considered stating a preference for social-media privacy acceptable.US adult citizens; July 2023; item n=1,993. YouGov [S01]
34%
23.3%
Reported looking through the current partner’s phone without their knowledge.US all-partnered report universe; October 2019; n=2,932. Pew Research Center [S02]
Agreed that expecting personal-device passwords/codes was reasonable.Australian adults; 2024 attitudes study; n=2,046. eSafety Commissioner / Social Research Centre [S03]
What do relationship privacy and boundary statistics measure?
| Measure | What it describes | What it does not establish |
|---|---|---|
| Boundary attitude | Approval of an offered definition or scenario. | That the respondent sets or respects the boundary. |
| Comfort or frequency | How respondents describe their own boundary-setting. | Observed compliance, effectiveness or relationship health. |
| Credentials given | A respondent reports giving access to an account/device. | Reciprocal access or permission for every use. |
| Without-knowledge phone access | Respondent reports looking through a current partner’s phone without their knowledge. | Proof of infidelity or an individual diagnosis. |
| Reasonable/caring expectation | Agreement about a hypothetical partner behavior. | The number doing it, experiencing it or using coercive control. |
| Sharing-rule discussion | A respondent reports a discussion within a defined applicable subgroup. | Complete informed consent, agreement or later compliance. |
For broader relationship-quality measures, see our relationship satisfaction, trust and communication statistics. Privacy preferences and trust ratings answer different questions.
Also Read:-
Relationship Arguments And Conflict Statistics 2027
First Date Safety Statistics 2027
How Couples Meet Statistics 2027
Dating After Divorce Statistics 2027
Dating Over 50 Statistics 2027
How do people understand relationship boundaries?
YouGov offered two statements about boundaries and an unsure option. The results describe which wording people preferred. They do not settle a clinical definition or make every request for a partner to change inherently controlling. YouGov [S01].
F01 Which of two offered boundary statements came closest to the respondent’s view. Unweighted item n=1,996. Opinions about offered wording, not a therapeutic definition or proof that requests for change are coercive.
| Measure / group | Published result | Population and actual period | Original source |
|---|---|---|---|
| Boundaries concern one’s own behavior rather than a partner’s | 42% | US adult citizens Eligible/reporting n=1,996. 2023-07-11 to 2023-07-18 | Original source [S01] Q3, PDF physical pp.1 and 7 |
| It is fine to ask a partner to change behavior according to one’s boundaries | 36% | US adult citizens Eligible/reporting n=1,996. 2023-07-11 to 2023-07-18 | Original source [S01] Q3, PDF physical pp.1 and 7 |
| Not sure | 22% | US adult citizens Eligible/reporting n=1,996. 2023-07-11 to 2023-07-18 | Original source [S01] Q3, PDF physical pp.1 and 7 |
How important are personal boundaries?
Calling boundaries important differs from reporting that they are easy to set or consistently respected. The importance item was asked of adult citizens, regardless of current relationship status. YouGov [S01].
F02 How important respondents consider setting personal boundaries. Unweighted n=1,998. Importance is not successful implementation; original distribution totals 100%.
| Measure / group | Published result | Population and actual period | Original source |
|---|---|---|---|
| Very important | 57% | US adult citizens Eligible/reporting n=1,998. 2023-07-11 to 2023-07-18 | Original source [S01] Q4, PDF physical pp.1 and 8 |
| Somewhat important | 32% | US adult citizens Eligible/reporting n=1,998. 2023-07-11 to 2023-07-18 | Original source [S01] Q4, PDF physical pp.1 and 8 |
| Not very important | 3% | US adult citizens Eligible/reporting n=1,998. 2023-07-11 to 2023-07-18 | Original source [S01] Q4, PDF physical pp.1 and 8 |
| Not at all important | 1% | US adult citizens Eligible/reporting n=1,998. 2023-07-11 to 2023-07-18 | Original source [S01] Q4, PDF physical pp.1 and 8 |
| Not sure | 7% | US adult citizens Eligible/reporting n=1,998. 2023-07-11 to 2023-07-18 | Original source [S01] Q4, PDF physical pp.1 and 8 |
How comfortable are people setting boundaries?
The comfort question narrows the population to people who have been in a romantic relationship. Its eligible base differs from the importance question and from the frequency question that follows. YouGov [S01].
F03 How comfortable relationship-experienced respondents feel setting boundaries. Eligible unweighted n=1,812; current or past relationship experience, not only current couples. Rounded distribution totals 99%; no normalization.
| Measure / group | Published result | Population and actual period | Original source |
|---|---|---|---|
| Very comfortable | 40% | US adult citizens who have ever been in a romantic relationship Eligible/reporting n=1,812. 2023-07-11 to 2023-07-18 | Original source [S01] Q5, PDF physical pp.1 and 9 |
| Somewhat comfortable | 42% | US adult citizens who have ever been in a romantic relationship Eligible/reporting n=1,812. 2023-07-11 to 2023-07-18 | Original source [S01] Q5, PDF physical pp.1 and 9 |
| Not very comfortable | 9% | US adult citizens who have ever been in a romantic relationship Eligible/reporting n=1,812. 2023-07-11 to 2023-07-18 | Original source [S01] Q5, PDF physical pp.1 and 9 |
| Not at all comfortable | 1% | US adult citizens who have ever been in a romantic relationship Eligible/reporting n=1,812. 2023-07-11 to 2023-07-18 | Original source [S01] Q5, PDF physical pp.1 and 9 |
| Not sure | 7% | US adult citizens who have ever been in a romantic relationship Eligible/reporting n=1,812. 2023-07-11 to 2023-07-18 | Original source [S01] Q5, PDF physical pp.1 and 9 |
How often do people set boundaries?
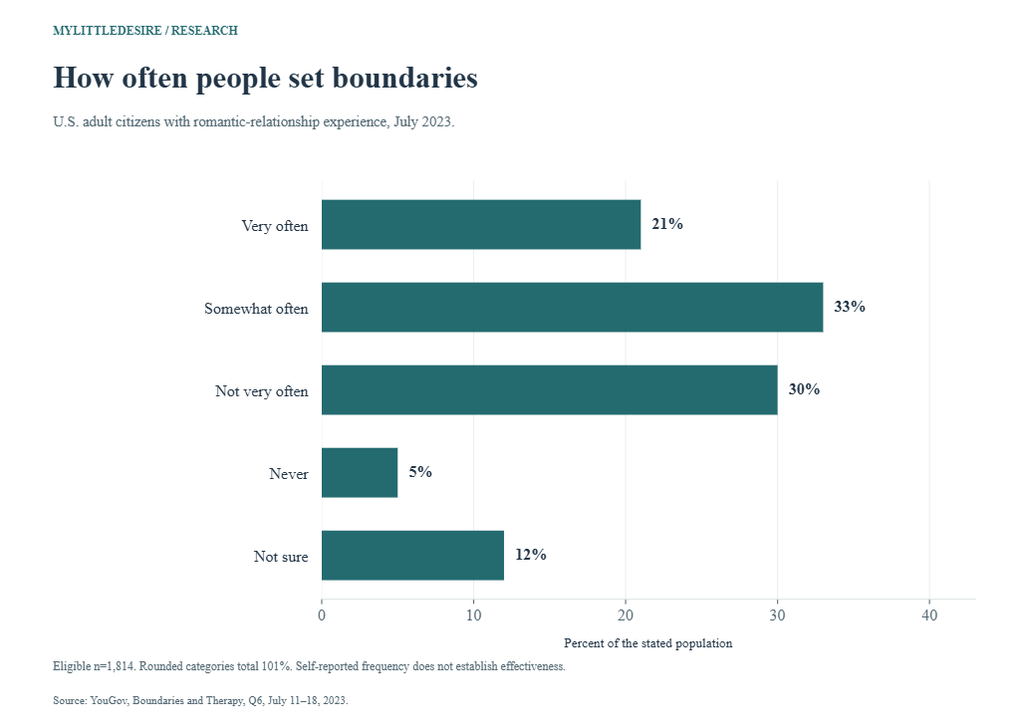
These are subjective frequency categories without a specified count of incidents. Setting a boundary often does not by itself show whether it is needed, welcomed or respected. YouGov [S01].
F04 Frequency of setting boundaries in romantic relationships, without a fixed incident-count window. Eligible unweighted n=1,814. Subjective frequency does not establish effectiveness. Rounded categories total 101%; no normalization.
| Measure / group | Published result | Population and actual period | Original source |
|---|---|---|---|
| Very often | 21% | US adult citizens who have ever been in a romantic relationship Eligible/reporting n=1,814. 2023-07-11 to 2023-07-18 | Original source [S01] Q6, PDF physical pp.1 and 10 |
| Somewhat often | 33% | US adult citizens who have ever been in a romantic relationship Eligible/reporting n=1,814. 2023-07-11 to 2023-07-18 | Original source [S01] Q6, PDF physical pp.1 and 10 |
| Not very often | 30% | US adult citizens who have ever been in a romantic relationship Eligible/reporting n=1,814. 2023-07-11 to 2023-07-18 | Original source [S01] Q6, PDF physical pp.1 and 10 |
| Never | 5% | US adult citizens who have ever been in a romantic relationship Eligible/reporting n=1,814. 2023-07-11 to 2023-07-18 | Original source [S01] Q6, PDF physical pp.1 and 10 |
| Not sure | 12% | US adult citizens who have ever been in a romantic relationship Eligible/reporting n=1,814. 2023-07-11 to 2023-07-18 | Original source [S01] Q6, PDF physical pp.1 and 10 |
Which proposed boundaries do people accept or reject?
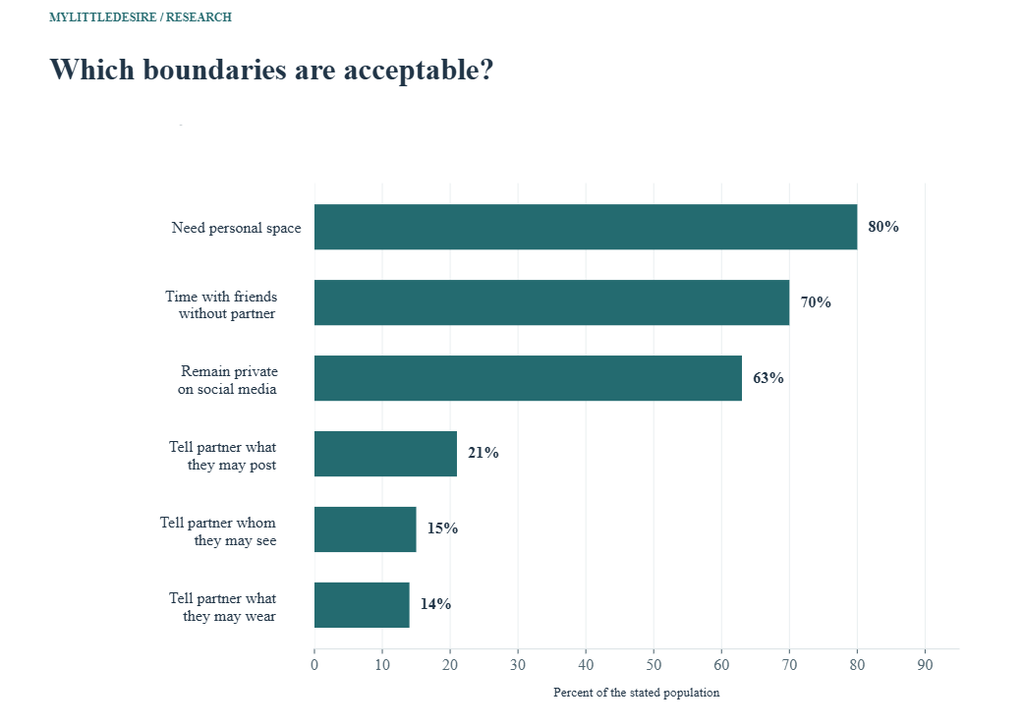
The scenario wording matters. Saying one needs personal space, time with friends or online privacy differs from telling a partner what they may wear, whom they may see or what they may post. Acceptable and unacceptable responses are shown separately; the source also includes not-sure answers. YouGov [S01].
F05 The same Q8 scenarios, preserving the wording distinction between stating one’s needs and directing a partner’s behavior. All adult citizens, not only partnered people. Six separate items can overlap. Item-specific unweighted n retained; not-sure responses omitted from this selected display. Acceptable and unacceptable are not exact complements.
| Measure / group | Published result | Population and actual period | Original source |
|---|---|---|---|
| Saying one needs personal space | 80% | US adult citizens Eligible/reporting n=1,988. 2023-07-11 to 2023-07-18 | Original source [S01] Original Q8D, physical p.15 |
| Saying one needs time with friends without the partner | 70% | US adult citizens Eligible/reporting n=1,989. 2023-07-11 to 2023-07-18 | Original source [S01] Original Q8E, physical p.16 |
| Saying one wants to remain private on social media | 63% | US adult citizens Eligible/reporting n=1,993. 2023-07-11 to 2023-07-18 | Original source [S01] Original Q8F, physical p.17 |
| Telling a partner what they may post about themselves | 21% | US adult citizens Eligible/reporting n=1,986. 2023-07-11 to 2023-07-18 | Original source [S01] Original Q8C, physical p.14 |
| Telling a partner whom they may spend time with | 15% | US adult citizens Eligible/reporting n=1,986. 2023-07-11 to 2023-07-18 | Original source [S01] Original Q8A, physical p.12 |
| Telling a partner what they may wear | 14% | US adult citizens Eligible/reporting n=1,992. 2023-07-11 to 2023-07-18 | Original source [S01] Original Q8B, physical p.13 |
F06 The same Q8 scenarios, preserving the wording distinction between stating one’s needs and directing a partner’s behavior. All adult citizens, not only partnered people. Six separate items can overlap. Item-specific unweighted n retained; not-sure responses omitted from this selected display. Acceptable and unacceptable are not exact complements.
| Measure / group | Published result | Population and actual period | Original source |
|---|---|---|---|
| Saying one needs personal space | 8% | US adult citizens Eligible/reporting n=1,988. 2023-07-11 to 2023-07-18 | Original source [S01] Original Q8D, physical p.15 |
| Saying one needs time with friends without the partner | 15% | US adult citizens Eligible/reporting n=1,989. 2023-07-11 to 2023-07-18 | Original source [S01] Original Q8E, physical p.16 |
| Saying one wants to remain private on social media | 17% | US adult citizens Eligible/reporting n=1,993. 2023-07-11 to 2023-07-18 | Original source [S01] Original Q8F, physical p.17 |
| Telling a partner what they may post about themselves | 64% | US adult citizens Eligible/reporting n=1,986. 2023-07-11 to 2023-07-18 | Original source [S01] Original Q8C, physical p.14 |
| Telling a partner whom they may spend time with | 70% | US adult citizens Eligible/reporting n=1,986. 2023-07-11 to 2023-07-18 | Original source [S01] Original Q8A, physical p.12 |
| Telling a partner what they may wear | 74% | US adult citizens Eligible/reporting n=1,992. 2023-07-11 to 2023-07-18 | Original source [S01] Original Q8B, physical p.13 |
Is looking through a partner’s phone considered acceptable?
Pew asked all adults about looking through a partner’s cellphone without their knowledge. These responses record public judgments, rather than the respondent’s own behavior or a legal ruling. The official NETs repeat categories and should not be added to them. Pew Research Center [S02].
F07 TRACKPARTNER asks all adults about acceptability, regardless of their own relationship status. All-adult n=4,860. NETs repeat categories, rather than adding exclusive responses. Four rounded categories total 99%; official NETs retained.
| Measure / group | Published result | Population and actual period | Original source |
|---|---|---|---|
| Always acceptable | 8% | US adults aged 18+, regardless of relationship status Eligible/reporting n=4,860. 2019-10-16 to 2019-10-28 | Original source [S02] Report printed p.9; TRACKPARTNER questionnaire printed p.28 |
| Sometimes acceptable | 21% | US adults aged 18+, regardless of relationship status Eligible/reporting n=4,860. 2019-10-16 to 2019-10-28 | Original source [S02] Report printed p.9; TRACKPARTNER questionnaire printed p.28 |
| Rarely acceptable | 28% | US adults aged 18+, regardless of relationship status Eligible/reporting n=4,860. 2019-10-16 to 2019-10-28 | Original source [S02] Report printed p.9; TRACKPARTNER questionnaire printed p.28 |
| Never acceptable | 42% | US adults aged 18+, regardless of relationship status Eligible/reporting n=4,860. 2019-10-16 to 2019-10-28 | Original source [S02] Report printed p.9; TRACKPARTNER questionnaire printed p.28 |
| Always/sometimes acceptable — official NET | 29% | US adults aged 18+, regardless of relationship status Eligible/reporting n=4,860. 2019-10-16 to 2019-10-28 | Original source [S02] Report printed p.9; TRACKPARTNER questionnaire printed p.28 |
| Rarely/never acceptable — official NET | 70% | US adults aged 18+, regardless of relationship status Eligible/reporting n=4,860. 2019-10-16 to 2019-10-28 | Original source [S02] Report printed p.9; TRACKPARTNER questionnaire printed p.28 |
How many people report looking through a partner’s phone?
For behavior, use the published report’s all-partnered percentages consistently. The underlying phone-owning-partner answering base is different and produces a different raw topline. Gender and age refer to respondents, without matched-partner reports. Pew Research Center [S02].
F08 Report-universe ever-experience percentages; respondent gender/age groups. Report rebased to all partnered adults n=2,932; question answered by phone-owning-partner n=2,850. Do not substitute raw topline 36% for report 34%. Subgroup n unavailable; behavior alone does not establish infidelity or a diagnosis.
| Measure / group | Published result | Population and actual period | Original source |
|---|---|---|---|
| All partnered adults | 34% | US adults married, cohabiting or in a committed relationship Eligible/reporting n=2,932. 2019-10-16 to 2019-10-28 | Original source [S02] Report printed p.11 (physical p.12); PARTNERTRACK questionnaire printed p.32 |
| Women | 42% | US adults married, cohabiting or in a committed relationship Exact subgroup n unavailable. 2019-10-16 to 2019-10-28 | Original source [S02] Report printed p.11 (physical p.12); PARTNERTRACK questionnaire printed p.32 |
| Men | 25% | US adults married, cohabiting or in a committed relationship Exact subgroup n unavailable. 2019-10-16 to 2019-10-28 | Original source [S02] Report printed p.11 (physical p.12); PARTNERTRACK questionnaire printed p.32 |
| Ages 18–29 | 52% | US adults married, cohabiting or in a committed relationship Exact subgroup n unavailable. 2019-10-16 to 2019-10-28 | Original source [S02] Report printed p.11 (physical p.12); PARTNERTRACK questionnaire printed p.32 |
| Ages 30–49 | 41% | US adults married, cohabiting or in a committed relationship Exact subgroup n unavailable. 2019-10-16 to 2019-10-28 | Original source [S02] Report printed p.11 (physical p.12); PARTNERTRACK questionnaire printed p.32 |
| Ages 50–64 | 29% | US adults married, cohabiting or in a committed relationship Exact subgroup n unavailable. 2019-10-16 to 2019-10-28 | Original source [S02] Report printed p.11 (physical p.12); PARTNERTRACK questionnaire printed p.32 |
| Ages 65+ | 13% | US adults married, cohabiting or in a committed relationship Exact subgroup n unavailable. 2019-10-16 to 2019-10-28 | Original source [S02] Report printed p.11 (physical p.12); PARTNERTRACK questionnaire printed p.32 |
How common is giving passwords to a partner?
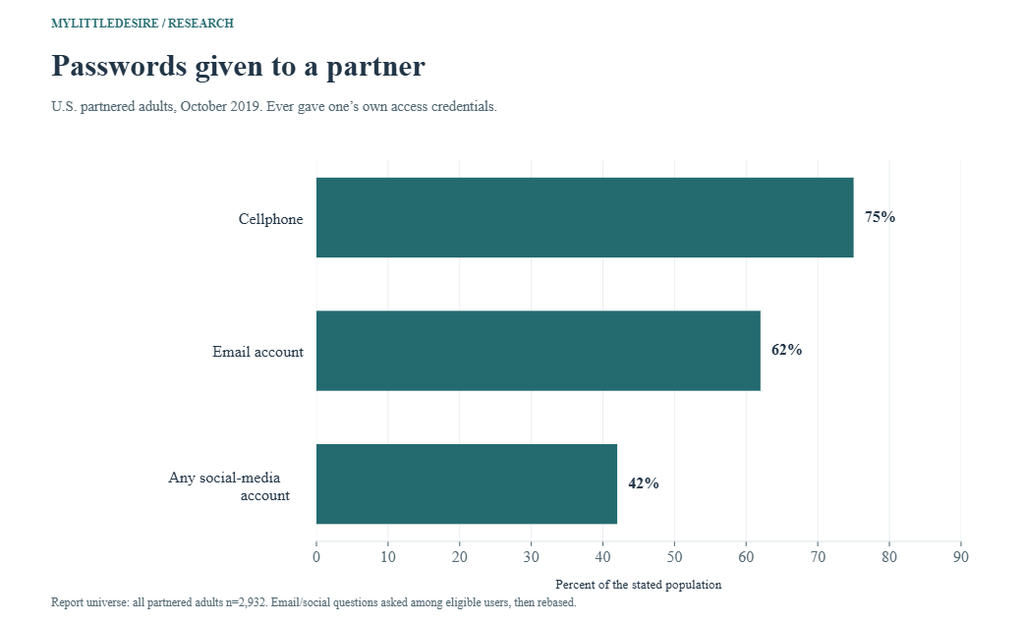
The password item asks whether respondents ever gave their own access credentials to a partner. It does not establish reciprocal sharing, current access, the reason for sharing or freely given consent in every case. Email and social-media questions were asked among eligible users and then reported among all partnered adults. Pew Research Center [S02].
F09 Report percentages for giving one’s own access credentials, not reciprocal sharing. All-partnered reporting universe n=2,932. Email/social items asked only among eligible users then rebased; their raw topline values differ. Giving credentials does not establish free consent, current access or permission for every use.
| Measure / group | Published result | Population and actual period | Original source |
|---|---|---|---|
| Own cellphone passcode/password | 75% | US adults married, cohabiting or in a committed relationship Eligible/reporting n=2,932. 2019-10-16 to 2019-10-28 | Original source [S02] Report printed p.13 (physical p.14); PARTNERPASS questionnaire printed p.31 |
| Own email password | 62% | US adults married, cohabiting or in a committed relationship Eligible/reporting n=2,932. 2019-10-16 to 2019-10-28 | Original source [S02] Report printed p.13 (physical p.14); PARTNERPASS questionnaire printed p.31 |
| Password to any own social-media account | 42% | US adults married, cohabiting or in a committed relationship Eligible/reporting n=2,932. 2019-10-16 to 2019-10-28 | Original source [S02] Report printed p.13 (physical p.14); PARTNERPASS questionnaire printed p.31 |
F10 Selected report-universe password-sharing comparisons by status. Subgroup n unavailable. Do not mix report values with conditional Internet-user toplines. Status groups differ in age and circumstances; no causal effect or universal trust rule follows.
| Measure / group | Published result | Population and actual period | Original source |
|---|---|---|---|
| Married: cellphone | 79% | US partnered adults, by current relationship status Exact subgroup n unavailable. 2019-10-16 to 2019-10-28 | Original source [S02] Report printed p.13, relationship-status table |
| Cohabiting: cellphone | 74% | US partnered adults, by current relationship status Exact subgroup n unavailable. 2019-10-16 to 2019-10-28 | Original source [S02] Report printed p.13, relationship-status table |
| Committed, not cohabiting: cellphone | 58% | US partnered adults, by current relationship status Exact subgroup n unavailable. 2019-10-16 to 2019-10-28 | Original source [S02] Report printed p.13, relationship-status table |
| Married: email | 70% | US partnered adults, by current relationship status Exact subgroup n unavailable. 2019-10-16 to 2019-10-28 | Original source [S02] Report printed p.13, relationship-status table |
| Cohabiting: email | 50% | US partnered adults, by current relationship status Exact subgroup n unavailable. 2019-10-16 to 2019-10-28 | Original source [S02] Report printed p.13, relationship-status table |
| Committed, not cohabiting: email | 22% | US partnered adults, by current relationship status Exact subgroup n unavailable. 2019-10-16 to 2019-10-28 | Original source [S02] Report printed p.13, relationship-status table |
Digital access also differs from ownership of money or joint accounts. For those separate questions, see our couples’ money management statistics.
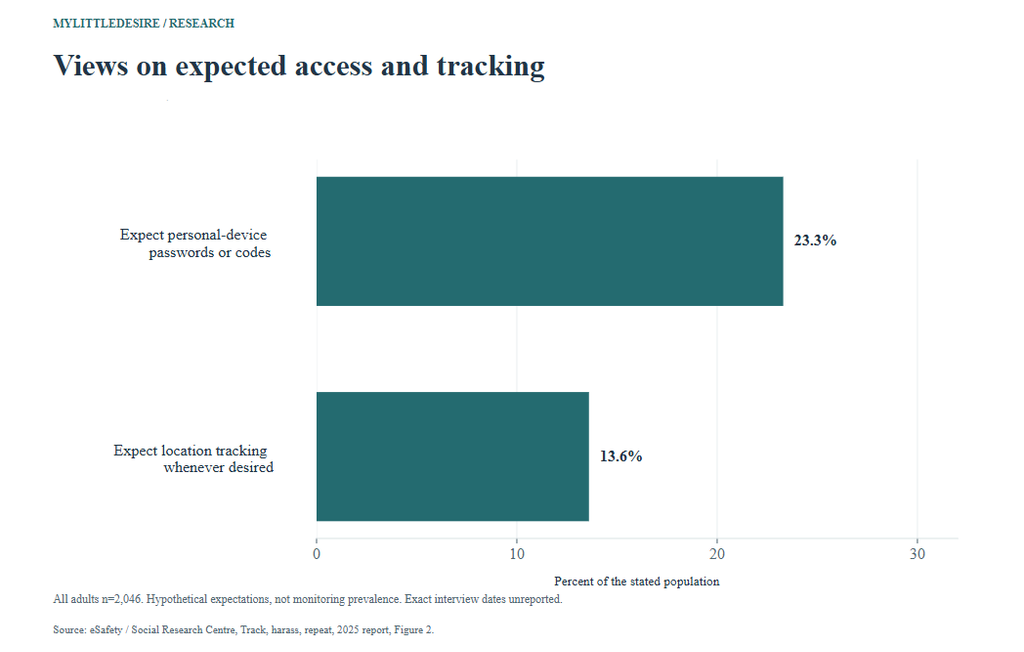
What do Australians think about expected access and tracking?
eSafety’s study asked whether described behaviors were usually caring or whether expectations were reasonable. It did not ask these respondents whether they had personally tracked a partner or experienced the behavior. The published any-item and both-item results are original overlapping aggregates. eSafety Commissioner / Social Research Centre [S03].
F11 Agreement that each described behavior is usually a sign of care from a partner. All-respondent n=2,046. Attitudes, not prevalence of experiencing or doing these behaviors. The published any-one result overlaps the three items; do not add them.
| Measure / group | Published result | Population and actual period | Original source |
|---|---|---|---|
| Constant texts asking who one is with or what one is doing while apart | 15.3% | Australian adults aged 18+ Eligible/reporting n=2,046. 2024 research, commissioned October 2024; exact fieldwork dates not stated in checked report | Original source [S03] Original report printed pp.10–11, Figure 1 and preceding narrative |
| Wanting constant availability for texts, calls or video chats | 19.1% | Australian adults aged 18+ Eligible/reporting n=2,046. 2024 research, commissioned October 2024; exact fieldwork dates not stated in checked report | Original source [S03] Original report printed pp.10–11, Figure 1 and preceding narrative |
| Insisting on checking how one looks in a photo before posting | 28.7% | Australian adults aged 18+ Eligible/reporting n=2,046. 2024 research, commissioned October 2024; exact fieldwork dates not stated in checked report | Original source [S03] Original report printed pp.10–11, Figure 1 and preceding narrative |
| Agreed with at least one of those three — published aggregate | 38.3% | Australian adults aged 18+ Eligible/reporting n=2,046. 2024 research, commissioned October 2024; exact fieldwork dates not stated in checked report | Original source [S03] Original report printed pp.10–11, Figure 1 and preceding narrative |
F12 Agreement that specified access/tracking expectations are reasonable from a partner. All-respondent n=2,046, not only people in relationships. These are hypothetical expectations, not monitoring behavior. The both-items result is an original joint estimate, not inferred from the marginal percentages.
| Measure / group | Published result | Population and actual period | Original source |
|---|---|---|---|
| Expecting one’s passwords/codes for personal devices | 23.3% | Australian adults aged 18+ Eligible/reporting n=2,046. 2024 research, commissioned October 2024; exact fieldwork dates not stated in checked report | Original source [S03] Original report printed pp.14–17, Figure 2 and joint-result narrative |
| Expecting to track one whenever desired via location-sharing apps | 13.6% | Australian adults aged 18+ Eligible/reporting n=2,046. 2024 research, commissioned October 2024; exact fieldwork dates not stated in checked report | Original source [S03] Original report printed pp.14–17, Figure 2 and joint-result narrative |
| Agreed with both expectations — published joint result | 9.7% | Australian adults aged 18+ Eligible/reporting n=2,046. 2024 research, commissioned October 2024; exact fieldwork dates not stated in checked report | Original source [S03] Original report printed pp.14–17, Figure 2 and joint-result narrative |
F13 Two overlapping measures: routine access sharing and whether a partner used the phone in the past year. Selected nonprobability separate-phone sample n=961, including current/recent relationships. Access sharing combines shared credentials or intentionally leaving a phone unlocked for partner use. Actual use is broader; neither alone measures coercion or national prevalence.
| Measure / group | Published result | Population and actual period | Original source |
|---|---|---|---|
| Classified as sharing phone access with partner | 70.9% | Volunteer Australian adults aged 18+ using mobile phones, in current or recent intimate relationships; recent ex-partners within three years included Eligible/reporting n=961. Recruitment May–September 2024; partner phone-use item refers to the past year | Original source [S04] Original article Table 1 and accompanying Findings text |
| Partner used the phone in the past year | 84.8% | Volunteer Australian adults aged 18+ using mobile phones, in current or recent intimate relationships; recent ex-partners within three years included Eligible/reporting n=961. Recruitment May–September 2024; partner phone-use item refers to the past year | Original source [S04] Original article Table 1 and accompanying Findings text |
Do people discuss phone-sharing rules?
The sharing-discussion result has a smaller applicable group. Keep its 632 respondents attached to every quotation rather than substituting the study’s full sample or its separate-phone sample. A reported discussion is itself different from the quality or continued observance of an agreement. Dragiewicz, Ackerman and Haaland [S04].
F14 Discussion-question responses among those for whom the question was applicable. Applicable n=632, not all 967 participants, 961 separate-phone participants or 681 classified sharers. The full reason for the smaller base is not explained beside the result. Reports of discussion do not prove consent or compliance.
| Measure / group | Published result | Population and actual period | Original source |
|---|---|---|---|
| Reported discussing rules or expectations | 11.4% | Volunteer Australian adults aged 18+ using mobile phones, in current or recent intimate relationships; recent ex-partners within three years included Eligible/reporting n=632. Recruitment May–September 2024; partner phone-use item refers to the past year | Original source [S04] Original article final Findings paragraph immediately before Discussion |
| Reported no discussion | 87.2% | Volunteer Australian adults aged 18+ using mobile phones, in current or recent intimate relationships; recent ex-partners within three years included Eligible/reporting n=632. Recruitment May–September 2024; partner phone-use item refers to the past year | Original source [S04] Original article final Findings paragraph immediately before Discussion |
| Unsure whether they discussed expectations | 1.4% | Volunteer Australian adults aged 18+ using mobile phones, in current or recent intimate relationships; recent ex-partners within three years included Eligible/reporting n=632. Recruitment May–September 2024; partner phone-use item refers to the past year | Original source [S04] Original article final Findings paragraph immediately before Discussion |
What privacy and boundary questions can partners discuss?
Love is respect recommends discussing digital terms, retaining privacy and recognizing that boundaries can change. Relationships Australia NSW recommends conversations about how technology affects connection and agreeing on focused time together. These are attributed practical suggestions, separate from the survey observations; no success rate is assigned.
- Which photos, tags and relationship details are each of you comfortable making public?
- Does permission to use a device for one task include any other access?
- What are your preferences about personal space, time with friends and response times?
- How can either person revisit an agreement or decline access without pressure?
Sources: love is respect, Digital boundaries [G01], its password-sharing guidance, and Relationships Australia NSW [G02]. Being in a relationship does not create an entitlement to account access.
Which differences can readers reproduce?
These eight calculations subtract published percentages within a source. They are descriptive percentage-point differences, not relative changes, causal effects or new significance tests. Distinct scenario responses can overlap, and item bases are preserved.
| Comparison | First value | Second value | Difference | Qualification |
|---|---|---|---|---|
| Acceptable: personal space minus directing social contacts | 80% | 15% | +65 percentage points | Separate Q8 items, n=1,988/1,986; overlapping opinions, not a behavioral deficit. |
| Acceptable: own online privacy minus directing partner posts | 63% | 21% | +42 percentage points | Separate Q8 items, n=1,993/1,986; describes wording-specific attitudes. |
| Boundary concept: own behavior minus asking for partner change | 42% | 36% | +6 percentage points | Forced-choice opinions within Q3; not a clinical definition. |
| Importance: very minus somewhat important | 57% | 32% | +25 percentage points | Response categories within Q4, n=1,998; not a measure of implementation. |
| Phone snooping attitude: rarely/never minus always/sometimes acceptable | 70% | 29% | +41 percentage points | Official NETs among all adults; retain original rounded values. |
| Reported phone snooping: women minus men | 42% | 25% | +17 percentage points | Respondent groups, not matched partners; report-universe values. |
| Passwords given: cellphone minus email | 75% | 62% | +13 percentage points | Both reported among all partnered adults; overlapping credential types, not mutually exclusive. |
| Sharing rules discussion: no minus yes | 87.2% | 11.4% | +75.8 percentage points | Selected applicable subgroup n=632; descriptive response difference, not national prevalence. |
Common questions
How many people think boundaries are important?
In YouGov’s July 2023 US adult-citizen poll, 57% rated setting personal boundaries very important and 32% somewhat important. These are attitudes, rather than evidence that boundaries are consistently set or respected.
Is wanting privacy on social media a common preference?
The selected poll measures acceptance of that preference: 63% considered it acceptable to tell a partner one wants to remain private on social media. It does not measure how many people personally choose that arrangement.
Does sharing a password mean a partner can read every message?
A survey report of credentials being given does not establish permission for every later use. Love is respect distinguishes freely agreed, revisable digital terms from pressure to give access.
How common is looking through a partner’s phone without their knowledge?
Pew’s report gives 34% among all partnered US adults in October 2019. The raw item was asked among a smaller phone-owning-partner group, so its 36% is a different reporting universe.
Do the Australian expectation figures measure actual tracking?
No. They record agreement that a described expectation is reasonable. They are not rates of tracking behavior, victimization or coercive control.
Can these surveys be used to rank countries or show a trend?
Their questions, populations, sampling and dates differ. This resource does not combine them into a country ranking, worldwide rate or clean time trend.
Research method and limitations
MyLittleDesire compiled selected published aggregates from original questionnaires, research reports and a peer-reviewed article. AI assisted retrieval, organization and drafting. No new survey, respondent-level reanalysis, hypothesis test, clinical assessment or legal interpretation was conducted. This is a source-based compilation, not an exhaustive systematic review.
The 64 percentage observations form 14 grouped findings: 30 come from YouGov’s 2023 US survey, 22 from Pew’s 2019 US survey, seven from eSafety’s Australian attitudes study and five from the selected Australian smartphone study. Two guidance records add no observations. Response categories, NETs and subgroups are not independent studies. Four charts and eight differences reuse selected observations.
- Measurement: judgments, comfort, frequency, credentials, unannounced access, hypothetical expectations and discussions answer different questions.
- Eligibility: all-adult, relationship-experienced, all-partnered and applicable sharing subgroups are kept separate. No overall n is substituted for a smaller item base.
- Reporting universe: Pew’s snooping and email/social sharing report values are rebased. Raw conditional toplines are not mixed into the article’s comparisons.
- Sampling: Pew and eSafety use probability-recruited panels; YouGov uses an opt-in matched/weighted panel; the smartphone paper uses self-selected online recruitment. Weighting or a publication’s headline does not make the samples interchangeable.
- Precision: original rounded values and official NETs are retained. Some response distributions total 99% or 101%. Unknown subgroup n remains unavailable.
- Verification: inconsistent unlock-credential and access-origin figures in the smartphone article are withheld. The selected access and discussion results have internally consistent counts/bases.
- Interpretation: access sharing does not itself establish coercion, while privacy preferences do not establish infidelity. No universal healthy-boundary quota or individual risk prediction is derived.
Original sources
- S01. YouGov. Boundaries and Therapy survey / What Americans think about boundaries and romantic relationships. Publication: 2023-09-18 (accompanying article). Actual period: 2023-07-11 to 2023-07-18. Overall study n=2,000. Eligible base: Q3 unweighted n=1,996; Q4 n=1,998; Q5 relationship-experienced n=1,812; Q6 n=1,814. Q8A–F n=1,986/1,992/1,986/1,988/1,989/1,993 respectively. Method: Opt-in Internet panel, sample matching and demographic/political weighting. Original PDF methods physical p.4; Q3–6 crosstabs physical pp.7–10; Q8A–F pp.12–17. Weighted percentages, item-specific unweighted bases. Attitudes, comfort and self-reported frequency are separate measures, not observed compliance or a clinical definition of boundaries. Asking a partner to change a behavior is not automatically coercion; the forced-choice concept item records opinions. Unknown/unsure responses retained where displayed; rounding can produce 99% or 101% totals. Full n=2,000 is not each item base. Supporting records: record 1.
- S02. Pew Research Center. Dating and Relationships in the Digital Age. Publication: 2020-05-08. Actual period: 2019-10-16 to 2019-10-28. Overall study n=4,860. Eligible base: All-adult attitude n=4,860. Reported partnered universe n=2,932. Snooping asked among phone-owning-partner n=2,850 then rebased; cellphone password item n=2,932; email asked among Internet users n=2,877 and social passwords among social-media users n=2,250, then reported among all partnered adults. Subgroup n unavailable. Method: Weighted probability-recruited American Trends Panel with an Ipsos KnowledgePanel LGB oversample. Report printed pp.9–13 and original TRACKPARTNER/PARTNERTRACK/PARTNERPASS questionnaire. Official report-universe values retained consistently. Attitudes are not behavior. Ever looking through the current partner’s phone without their knowledge is not an infidelity diagnosis. Report percentages differ from conditional raw toplines. Giving a password does not establish reciprocal access, freely given consent or permission for every use. No pooled trend with another survey. Supporting records: record 1, record 2.
- S03. eSafety Commissioner / Social Research Centre. Track, harass, repeat: Attitudes that normalise tech-based coercive control. Publication: 2025 summary report; earlier release 2024-11-25. Actual period: 2024 research, commissioned October 2024; exact fieldwork dates not stated in checked report. Overall study n=2,046. Eligible base: All-respondent base n=2,046 for selected overall attitudes and published joint/any-item values. Method: Weighted Life in Australia probability-based online panel. Report printed pp.8–9 describes methods; pp.10–11/Figure 1 covers usually-a-sign-of-care responses; pp.14–17/Figure 2 covers reasonable expectations. Published agree/strongly-agree NETs and original joint/any-item results retained. Perceptions of hypothetical caring/reasonable behavior, not reports of monitoring, victimization or coercive-control prevalence. Any-item and joint results overlap individual items. A pattern and context matter; an isolated response cannot diagnose a relationship. Commissioning date is not an exact fieldwork date. Supporting records: record 1, record 2.
- S04. Dragiewicz, Ackerman and Haaland. Smartphone sharing with intimate partners in Australia: Characteristics and implications for cybersecurity. Actual period: Recruitment May–September 2024; partner phone-use item refers to the past year. Overall study n=967. Eligible base: Selected separate-phone analyses n=961 after excluding six single-phone-sharing respondents. Discussion question applicable n=632. Full analytic sample reported n=967. Method: Online recruitment primarily through paid Meta advertising, with community-organization and professional-network outreach. Nonprobability sample, 79.6% women. Table 1 and accompanying text supply sharing access/last-year use; final Findings paragraph supplies discussion responses with explicit n=632. Selected volunteers, not established national probability prevalence. Sharing access combines credentials or leaving a phone unlocked for partner use; actual use is broader and overlapping. It does not itself establish coercion. Exact reason for discussion-base reduction is not fully explained beside the result. Inconsistent unlock-credential and access-origin figures are withheld, rather than repaired. Supporting records: record 1.
Practical guidance sources
- G01. love is respect: Digital boundaries / Should we share passwords?. Practical guidance on mutually agreed digital terms, privacy and revisiting consent; no numeric observations.
- G02. Relationships Australia NSW: How to Set Healthy Boundaries Around Technology and Relationships. Practical communication and focused-time guidance; no numeric observations.
How to cite this resource
MyLittleDesire. Relationship Privacy And Boundaries Statistics 2027. https://mylittledesire.com/relationship-privacy-boundaries-statistics/.