
Parent–adult child relationships combine affection, advice, changing boundaries and support in both directions. A close relationship can include disagreements; living together can reflect housing or care needs. Useful statistics keep those different experiences—and the people being measured—separate.
Key parent–adult child relationship findings
77% / 59%
69%
Parents versus young adults rated relationships excellent or very good.
Could be their true self around their parent all or most of the time.
36% / 27%
70%
Parents versus young adults wanted more contact with the selected relative.
Of adult-child parents selected one or more children as particularly close.
57%
34% / 34%
Of adult-child parents also called an adult child a friend.
Endorsed financial-support obligations downward versus upward, if affordable.
56% / 37%
10.5% / 22.2%
Combined agreement with parents housing children versus children housing ageing parents.
Intergenerational versus other households fell below affordability standards.
10.3% / 4.6%
20.3%
The same household categories fell below bedroom-suitability standards.
Named an adult child as their single most important relationship.
$26.6bn
49%
Estimated support went to nonresident adult children 21+ in 2024.
Of adults 18–29 lived with a parent in the 2025 Federal Reserve survey.
How close are parents and adult children?
Most respondents in Pew’s two US surveys described positive relationships. Parents rated their relationships more highly than young adults did, but the surveys did not interview matched members of the same families. Being comfortable, feeling understood and relying on someone emotionally are also different dimensions of a relationship.
| ID | Finding and qualification | Population, actual period and base | Original source and locator |
|---|---|---|---|
| F01 | 77% of parents rated the relationship excellent or very good, compared with 59% of young adults in a separate survey. Definition: Published excellent/very good NETs. Young adults answer about one randomly assigned parent; parents about one randomly assigned child. Qualification: Unmatched surveys of different eligible populations, not paired disagreement within households. The young-adult NET is 59%, even though rounded components 32% and 28% sum to 60%. | Two separate surveys: parents with a child 18–34 in contact (n=3,017); adults 18–34 with a living parent in contact (n=1,495). Eligible children exclude high-school students. United States 2023-10-24 to 2023-11-05 Item/subgroup bases are not provided alongside these estimates. Overall report size is not the valid base for every item. | Pew Research Center Published 2024-01-25 Chapters 4 and 5, relationship-quality summaries; report physical pp.36–37 and 50–52. |
| F02 | Young adults rated relationships with mothers highly more often than relationships with fathers: 63% versus 53%. Definition: Excellent/very good, by randomly assigned parent. Qualification: Different respondent subgroups, not each person rating both parents. | US adults 18–34 with a living parent in contact; overall n=1,495, exact item/subgroup n may differ United States 2023-10-24 to 2023-11-05 Item/subgroup bases are not provided alongside these estimates. Overall report size is not the valid base for every item. | Pew Research Center Published 2024-01-25 Report physical p.37 / printed p.36. |
| F03 | 69% of young adults could be their true self around their parent all or most of the time; 73% said this about mothers and 64% about fathers. Definition: All/most of the time, one randomly assigned parent. Qualification: Self-reported comfort, not an observed measure of authenticity or a causal gender effect. | US adults 18–34 with a living parent in contact; overall n=1,495, exact item/subgroup n may differ United States 2023-10-24 to 2023-11-05 Published input bases: 1,495. Overall report size is not the valid base for every item. | Pew Research Center Published 2024-01-25 Report physical p.38 / printed p.37. |
| F04 | 48% of young adults said they knew their parent extremely or very well beyond the parental role; 51% for mothers and 42% for fathers. Definition: Knowing a parent as a person, randomly assigned parent. Qualification: Different from knowing family facts or measuring the parent’s own sense of being understood. | US adults 18–34 with a living parent in contact; overall n=1,495, exact item/subgroup n may differ United States 2023-10-24 to 2023-11-05 Item/subgroup bases are not provided alongside these estimates. Overall report size is not the valid base for every item. | Pew Research Center Published 2024-01-25 Report physical p.39 / printed p.38. |
| F05 | 61% of parents believed their selected child knew them extremely or very well as a person; 64% of mothers and 58% of fathers said so. Definition: One randomly selected child 18–34; retain published NETs. Qualification: The overall 61% is the published combined estimate; rounded 23% extremely and 39% very well sum to 62%. Do not substitute that sum. | US parents with at least one child 18–34 in contact; overall n=3,017, exact item/subgroup n may differ United States 2023-10-24 to 2023-11-05 Item/subgroup bases are not provided alongside these estimates. Overall report size is not the valid base for every item. | Pew Research Center Published 2024-01-25 Report physical p.53 / printed p.52, published NET chart. |
| F06 | 31% of young adults relied on parents a great deal or a fair amount for emotional support; 35% of young women and 27% of young men did so. Definition: General reliance on parents, rather than the randomly assigned-parent module. Qualification: Published 31% NET; rounded components must not be substituted. Gender comparisons are descriptive. | US adults 18–34 with a living parent in contact; overall n=1,495, exact item/subgroup n may differ United States 2023-10-24 to 2023-11-05 Item/subgroup bases are not provided alongside these estimates. Overall report size is not the valid base for every item. | Pew Research Center Published 2024-01-25 Report physical p.40 / printed p.39. |
| F07 | 26% of young adults said their parent relied heavily on them emotionally: 35% answering about mothers and 12% about fathers. Definition: A great deal/fair amount of perceived parental reliance, randomly assigned parent. Qualification: This is the young adult’s perception; it does not establish that parents themselves report the same degree of reliance. | US adults 18–34 with a living parent in contact; overall n=1,495, exact item/subgroup n may differ United States 2023-10-24 to 2023-11-05 Item/subgroup bases are not provided alongside these estimates. Overall report size is not the valid base for every item. | Pew Research Center Published 2024-01-25 Report physical p.41 / printed p.40. |
| F08 | 18% of parents relied heavily on adult children for emotional support; 29% relied on them some, and 52% not much or not at all. Definition: A great deal/fair amount, some, or not much/not at all; parents think about any adult children. Qualification: Not the reverse side of the same parent–child pairs in the young-adult survey. No-answer share is omitted. | US parents with at least one child 18–34 in contact; overall n=3,017, exact item/subgroup n may differ United States 2023-10-24 to 2023-11-05 Published input bases: 3,017. Overall report size is not the valid base for every item. | Pew Research Center Published 2024-01-25 Report physical p.54 / printed p.53. |
| F09 | 41% of parents said their selected adult child relied heavily on them emotionally; 47% of mothers and 34% of fathers reported this. Definition: A great deal/fair amount, randomly selected child 18–34. Qualification: Parent-reported reliance, not a clinical assessment of dependence. | US parents with at least one child 18–34 in contact; overall n=3,017, exact item/subgroup n may differ United States 2023-10-24 to 2023-11-05 Item/subgroup bases are not provided alongside these estimates. Overall report size is not the valid base for every item. | Pew Research Center Published 2024-01-25 Report physical pp.54–55 / printed pp.53–54. |
ALSO READ:-
Couples Money Management Statistics 2027
Cyberbullying And Online Social Relationships Statistics 2027
Teen Friendship And Peer Support Statistics 2027
Couples Therapy and Counseling Statistics 2027
What do adult children ask parents about—and disagree about?
Finances and work feature in both advice-seeking and disagreement. These can coexist in a supportive relationship. The studies ask about frequency and particular topics; they do not define every disagreement as a damaged relationship.
| ID | Finding and qualification | Population, actual period and base | Original source and locator |
|---|---|---|---|
| F10 | Young adults sought parental advice at least sometimes about finances (68%), careers (67%), physical health (62%) and parenting (66%, among parents). Definition: Extremely/very often or sometimes; parenting question only for respondents who have children. Qualification: Parenting has a different eligible base (n=510 in topline); do not treat it as a percentage of every young adult. | US adults 18–34 with a living parent in contact; overall n=1,495, exact item/subgroup n may differ United States 2023-10-24 to 2023-11-05 Published input bases: 510. Overall report size is not the valid base for every item. | Pew Research Center Published 2024-01-25 Report physical pp.41–42 / printed pp.40–41. |
| F11 | Parents said adult children often sought career advice (43%), physical-health advice (36%), financial advice (33%) and mental-health advice (26%). Definition: Extremely/very often, concerning any of the respondent’s children 18–34. Qualification: Frequency threshold differs from the young-adult at-least-sometimes figures. Do not subtract them as though they measure the same outcome. | US parents with at least one child 18–34 in contact; overall n=3,017, exact item/subgroup n may differ United States 2023-10-24 to 2023-11-05 Published input bases: 3,017. Overall report size is not the valid base for every item. | Pew Research Center Published 2024-01-25 Report physical p.56 / printed p.55. |
| F12 | Young adults reported disagreements at least sometimes over finances (39%), careers (37%), social life (34%), politics (33%) and religion (29%). Definition: Extremely/very often or sometimes. Career item excludes not-applicable responses. Qualification: These are not rates of frequent conflict or estrangement. Career valid n after not-applicable exclusions is not published in the chapter. | US adults 18–34 with a living parent in contact; overall n=1,495, exact item/subgroup n may differ United States 2023-10-24 to 2023-11-05 Item/subgroup bases are not provided alongside these estimates. Overall report size is not the valid base for every item. | Pew Research Center Published 2024-01-25 Report physical pp.44–45 / printed pp.43–44. |
| F13 | Parents reported disagreements at least sometimes over finances (50%), careers (41%), social life (37%), politics (35%) and religion (30%). Definition: Frequency of disagreement about the lives of any adult children 18–34. Qualification: Some parents may have considered outward disagreements only, as the researchers caution. Parents and young adults are separate samples. | US parents with at least one child 18–34 in contact; overall n=3,017, exact item/subgroup n may differ United States 2023-10-24 to 2023-11-05 Published input bases: 3,017. Overall report size is not the valid base for every item. | Pew Research Center Published 2024-01-25 Report physical pp.58–59 / printed pp.57–58. |
How much contact and involvement do families want?
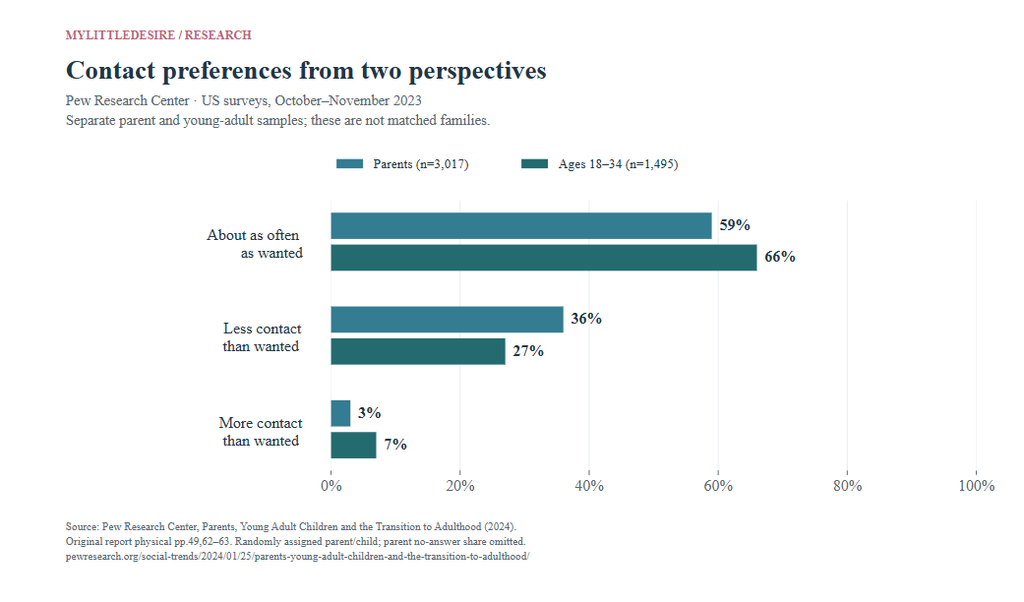
In Pew’s 2023 surveys, both groups were more likely to want additional contact than less contact. Most nevertheless described communication as about right. Frequency questions concern the most-contacted nonresident relative, while preference questions concern a randomly selected relative.
| ID | Finding and qualification | Population, actual period and base | Original source and locator |
|---|---|---|---|
| F14 | Among young adults with a nonresident parent, 61% texted, 46% called or video-chatted and 22% met in person at least a few times a week. Definition: Most-contacted nonresident parent; once a day or a few times a week. Qualification: Only respondents with at least one parent not living with them; this is not the randomly assigned-parent module. | US young adults 18–34 with a nonresident parent; contact-module n=1,274 United States 2023-10-24 to 2023-11-05 Published input bases: 1,274. Overall report size is not the valid base for every item. | Pew Research Center Published 2024-01-25 Report physical pp.46–47 / printed pp.45–46; young-adult topline contact routing. |
| F15 | Among parents with a nonresident adult child, 73% texted, 54% called or video-chatted and 32% met in person at least a few times a week. Definition: Most-contacted nonresident child 18–34; once a day or a few times a week. Qualification: Module n=2,515, not all 3,017 parents. In-person published NET is 32%, despite rounded components 10% plus 21%. | US parents with a nonresident child 18–34; contact-module n=2,515 United States 2023-10-24 to 2023-11-05 Published input bases: 2,515. Overall report size is not the valid base for every item. | Pew Research Center Published 2024-01-25 Report physical p.60 / printed p.59; parent topline p.5, PCOMMCHILD1. |
| F16 | Mothers versus fathers contacted their nonresident child frequently by text (81% versus 63%), phone/video (61% versus 46%) and in person (35% versus 27%). Definition: At least a few times a week, most-contacted nonresident child. Qualification: Subgroup valid n unavailable in chapter; no adjustment for distance, family structure or selection. | US mothers/fathers with a nonresident child 18–34; overall eligible module n=2,515 United States 2023-10-24 to 2023-11-05 Item/subgroup bases are not provided alongside these estimates. Overall report size is not the valid base for every item. | Pew Research Center Published 2024-01-25 Report physical p.61 / printed p.60. |
| F17 | Young women versus young men frequently texted a nonresident parent at 70% versus 49%, and called/video-chatted at 55% versus 34%. Definition: At least a few times a week, most-contacted nonresident parent. Qualification: Does not establish that women have better relationships or that frequency causes closeness. | US young women/men 18–34 with a nonresident parent; overall module n=1,274 United States 2023-10-24 to 2023-11-05 Item/subgroup bases are not provided alongside these estimates. Overall report size is not the valid base for every item. | Pew Research Center Published 2024-01-25 Report physical p.48 / printed p.47. |
| F18 | 66% of young adults communicated with their selected parent as often as wanted; 27% wanted more contact and 7% wanted less. Definition: About as often, less often, or more often than desired, randomly assigned parent. Qualification: Not a recommended contact schedule. Distinct from the most-contacted nonresident-parent frequency items. | US adults 18–34 with a living parent in contact; overall n=1,495, exact item/subgroup n may differ United States 2023-10-24 to 2023-11-05 Item/subgroup bases are not provided alongside these estimates. Overall report size is not the valid base for every item. | Pew Research Center Published 2024-01-25 Report physical p.49 / printed p.48. |
| F19 | 59% of parents communicated with their selected child as often as wanted; 36% wanted more contact and 3% wanted less. Definition: About as often, less often, or more often than desired, randomly assigned child 18–34. Qualification: Two percent no answer is not shown. Comparisons to young adults are between unmatched populations, not within-family disagreement. | US parents with at least one child 18–34 in contact; overall n=3,017, exact item/subgroup n may differ United States 2023-10-24 to 2023-11-05 Item/subgroup bases are not provided alongside these estimates. Overall report size is not the valid base for every item. | Pew Research Center Published 2024-01-25 Report physical pp.62–63 / printed pp.61–62. |
| F20 | 69% of young adults said parental involvement was about right; 22% wanted more involvement and 9% wanted less. Definition: Selected parent’s involvement in the young adult’s day-to-day life. Qualification: Personal preference rather than a clinical measure of healthy boundaries. | US adults 18–34 with a living parent in contact; overall n=1,495, exact item/subgroup n may differ United States 2023-10-24 to 2023-11-05 Item/subgroup bases are not provided alongside these estimates. Overall report size is not the valid base for every item. | Pew Research Center Published 2024-01-25 Report physical p.49 / printed p.48. |
| F21 | 67% of parents were involved as much as they wanted; 26% wanted more involvement and 7% wanted less. Definition: Parent’s own desired involvement in one selected child’s day-to-day life. Qualification: Not directly matched to the young-adult responses; no common household-disagreement percentage is available. | US parents with at least one child 18–34 in contact; overall n=3,017, exact item/subgroup n may differ United States 2023-10-24 to 2023-11-05 Item/subgroup bases are not provided alongside these estimates. Overall report size is not the valid base for every item. | Pew Research Center Published 2024-01-25 Report physical p.63 / printed p.62. |
| F22 | 25% of parents ever tracked their selected adult child’s location; 42% did so for ages 18–24, 21% for 25–29 and 9% for 30–34. Definition: Frequently, sometimes or rarely tracking through GPS apps or software; randomly selected child. Qualification: Ever includes rarely. Consent, safety motives and relationship effects are not established. | US parents with at least one child 18–34 in contact; overall n=3,017, exact item/subgroup n may differ United States 2023-10-24 to 2023-11-05 Item/subgroup bases are not provided alongside these estimates. Overall report size is not the valid base for every item. | Pew Research Center Published 2024-01-25 Report physical p.62 / printed p.61. |
| F23 | 86% of parents felt they had prepared children for independence at least a fair amount, versus 66% of young adults assessing their parents’ preparation. Definition: A great deal or a fair amount; separate parent and young-adult surveys. Qualification: Self-assessments from different populations, not an objective skills test or matched assessment of the same upbringing. | Two separate surveys: parents with a child 18–34 in contact (n=3,017); adults 18–34 with a living parent in contact (n=1,495). Eligible children exclude high-school students. United States 2023-10-24 to 2023-11-05 Item/subgroup bases are not provided alongside these estimates. Overall report size is not the valid base for every item. | Pew Research Center Published 2024-01-25 Report physical p.12 / printed p.11 and chapter 2; PPREPARE/YPREPARE toplines. |
| F24 | 73% of never-married young adults felt little or no parental pressure to marry; 67% of young adults without children felt little or no pressure to have children. Definition: Not much/not at all pressure; two separately eligible groups. Qualification: Not the percentages who do not want marriage or children. Never-married n=894; respondents without children n=978. | US adults 18–34: never-married group or group without children; different denominators United States 2023-10-24 to 2023-11-05 Published input bases: 894, 978. Overall report size is not the valid base for every item. | Pew Research Center Published 2024-01-25 Report physical p.35 / printed p.34; young-adult topline marriage/children routing. |
Can parents and adult children also be friends?
YouGov’s June 2026 crosstabs show that 70% of GB parents with a child over 18 selected an adult child as particularly close, while 57% selected an adult child as a friend. These answers may concern different children. A separate bad-relationship item cannot be treated as the opposite of closeness.
| ID | Finding and qualification | Population, actual period and base | Original source and locator |
|---|---|---|---|
| F25 | 70% of parents with a child over 18 selected one or more adult children as a particularly close relationship. Definition: At least one selected adult child; adult-child-parent subgroup. Qualification: Do not substitute the 48% any-age-parent column quoted in the summary article. Not the share close to every child. | GB parents/guardians with a child over 18; unweighted n=711, weighted base 662 Great Britain; not the whole United Kingdom 2026-06-02 to 2026-06-03 Overall report n=1,939. Published input bases: 711. Overall report size is not the valid base for every item. | YouGov Published 2026-07-09 PDF p.20: Over 18 years parent/guardian column, particularly close multi-select question. |
| F26 | 57% of parents with a child over 18 said they were also friends with one or more adult children. Definition: Friends as well as relatives, excluding romantic partners. Qualification: Friendship and closeness are separate questions, may concern different children and have unknown overlap. | GB parents/guardians with a child over 18; unweighted n=711, weighted base 662 Great Britain; not the whole United Kingdom 2026-06-02 to 2026-06-03 Overall report n=1,939. Published input bases: 711. Overall report size is not the valid base for every item. | YouGov Published 2026-07-09 PDF p.25: Over 18 years column, friends-with-family multi-select item. |
| F27 | 7% of parents with a child over 18 reported a bad relationship with one or more adult children. Definition: Self-described bad relationship with at least one adult child. Qualification: Not an estrangement/no-contact rate; someone can have a good relationship with one child and a bad relationship with another. | GB parents/guardians with a child over 18; unweighted n=711, weighted base 662 Great Britain; not the whole United Kingdom 2026-06-02 to 2026-06-03 Overall report n=1,939. Published input bases: 711. Overall report size is not the valid base for every item. | YouGov Published 2026-07-09 PDF p.20: Over 18 years column, bad-relationship multi-select question. |
| F28 | 59% of GB adults found parent–adult child friendship completely acceptable; 27% found it somewhat acceptable. Definition: Attitude among all adults, not the proportion who have that friendship. Qualification: Separate response categories are retained rather than presented as two independent studies. | GB adults 18+; n=1,939 overall. Adult-child-parent crosstab: Over 18 years column, unweighted n=711 and weighted base 662. Great Britain; not the whole United Kingdom 2026-06-02 to 2026-06-03 Overall report n=1,939. Published input bases: 1,939. Overall report size is not the valid base for every item. | YouGov Published 2026-07-09 PDF p.9, acceptability of being friends with adult children; all-adult column. |
| F29 | 77% preferred children to move out after becoming adults when able; 4% favored staying until having children, and 5% continued multigenerational living. Definition: Ideal arrangement among all GB adults, with when-able wording retained. Qualification: Not an age deadline, the actual prevalence of co-residence, or opposition to temporary support. | GB adults 18+; n=1,939 overall. Adult-child-parent crosstab: Over 18 years column, unweighted n=711 and weighted base 662. Great Britain; not the whole United Kingdom 2026-06-02 to 2026-06-03 Overall report n=1,939. Published input bases: 1,939. Overall report size is not the valid base for every item. | YouGov Published 2026-07-09 PDF p.13, ideal family living structure. |
What support do British adults think parents and adult children owe each other?
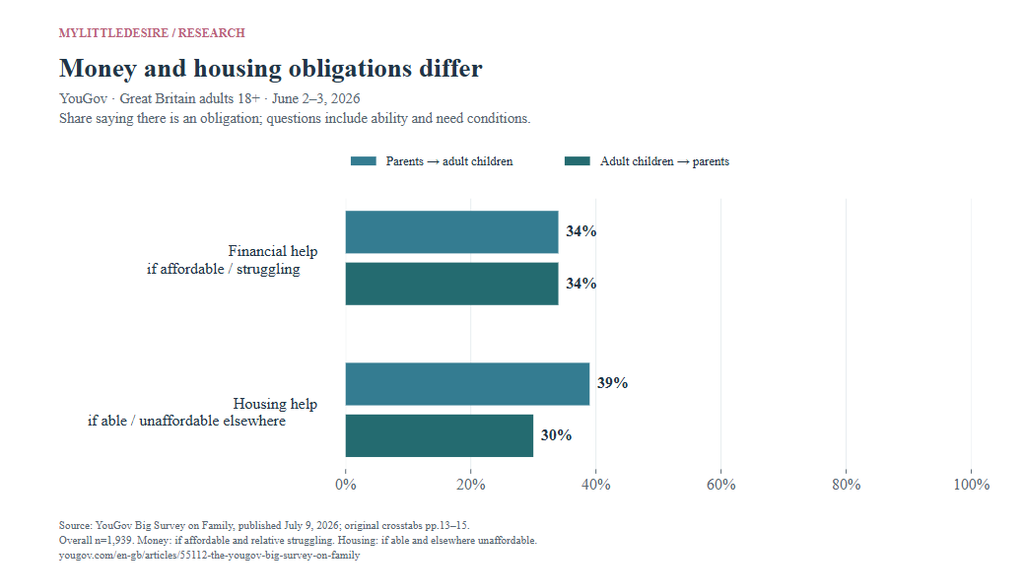
YouGov found equal overall endorsement of financial-support obligations in both directions, but different endorsement of housing obligations. These are conditional attitudes among all adults, including those without children. They do not measure actual transfers or legal duties.
| ID | Finding and qualification | Population, actual period and base | Original source and locator |
|---|---|---|---|
| F30 | 34% said parents able to afford it had an obligation to support struggling adult children financially; 57% called it a choice. Definition: Hypothetical obligation when parents can afford it and adult children are struggling. Qualification: Does not measure actual giving or whether respondents themselves are parents. | GB adults 18+; n=1,939 overall. Adult-child-parent crosstab: Over 18 years column, unweighted n=711 and weighted base 662. Great Britain; not the whole United Kingdom 2026-06-02 to 2026-06-03 Overall report n=1,939. Published input bases: 1,939. Overall report size is not the valid base for every item. | YouGov Published 2026-07-09 PDF p.13, parental financial-support obligation. |
| F31 | 34% said adults able to afford it had an obligation to support struggling parents financially; 56% called it a choice. Definition: Hypothetical upward financial support among all adults. Qualification: Same obligation wording does not imply the same people endorsed both directions. | GB adults 18+; n=1,939 overall. Adult-child-parent crosstab: Over 18 years column, unweighted n=711 and weighted base 662. Great Britain; not the whole United Kingdom 2026-06-02 to 2026-06-03 Overall report n=1,939. Published input bases: 1,939. Overall report size is not the valid base for every item. | YouGov Published 2026-07-09 PDF p.14, financial-support-to-parents obligation. |
| F32 | 48% said adults had an obligation to care for parents who became ill in old age; 43% said it was their choice. Definition: General obligation attitude, not care hours, willingness or actual caregiving. Qualification: No if-affordable condition is stated in this specific care item; do not add one. | GB adults 18+; n=1,939 overall. Adult-child-parent crosstab: Over 18 years column, unweighted n=711 and weighted base 662. Great Britain; not the whole United Kingdom 2026-06-02 to 2026-06-03 Overall report n=1,939. Published input bases: 1,939. Overall report size is not the valid base for every item. | YouGov Published 2026-07-09 PDF p.14, care for parents if ill in old age. |
| F33 | 26% said parents had an obligation to pass wealth to children after death; 66% said it was up to the parents. Definition: Attitude about passing down wealth, not a measure of wills or inheritance received. Qualification: Does not describe legal duties or financial guidance. | GB adults 18+; n=1,939 overall. Adult-child-parent crosstab: Over 18 years column, unweighted n=711 and weighted base 662. Great Britain; not the whole United Kingdom 2026-06-02 to 2026-06-03 Overall report n=1,939. Published input bases: 1,939. Overall report size is not the valid base for every item. | YouGov Published 2026-07-09 PDF p.14, inheritance obligation. |
| F34 | 39% said able parents should be obliged to house adult children unable to afford living elsewhere; 52% called it a choice. Definition: Able to accommodate; child unable to afford another home. Qualification: Hypothetical public attitude rather than actual household behavior. | GB adults 18+; n=1,939 overall. Adult-child-parent crosstab: Over 18 years column, unweighted n=711 and weighted base 662. Great Britain; not the whole United Kingdom 2026-06-02 to 2026-06-03 Overall report n=1,939. Published input bases: 1,939. Overall report size is not the valid base for every item. | YouGov Published 2026-07-09 PDF p.15, housing adult children. |
| F35 | 30% said able adults should be obliged to house parents unable to afford living elsewhere; 59% called it a choice. Definition: Able to accommodate; parent unable to afford another home. Qualification: Separate question from housing adult children; individual consistency cannot be calculated. | GB adults 18+; n=1,939 overall. Adult-child-parent crosstab: Over 18 years column, unweighted n=711 and weighted base 662. Great Britain; not the whole United Kingdom 2026-06-02 to 2026-06-03 Overall report n=1,939. Published input bases: 1,939. Overall report size is not the valid base for every item. | YouGov Published 2026-07-09 PDF p.15, housing parents. |
| F36 | Adults 18–24 versus 55+ endorsed parental housing obligations at 56% versus 35%, upward housing obligations at 50% versus 25%, and parental money obligations at 50% versus 30%. Definition: Same three hypothetical support questions, compared by respondent age. Qualification: Subgroup comparisons are descriptive, not evidence that these respondents will change views as they age. | GB adults 18–24 or 55+; age subgroup bases 189 and 847 Great Britain; not the whole United Kingdom 2026-06-02 to 2026-06-03 Overall report n=1,939. Published input bases: 189, 847. Overall report size is not the valid base for every item. | YouGov Published 2026-07-09 PDF pp.13 and 15, age columns; unweighted n=189 aged 18–24 and n=847 aged 55+. |
How do Australian support expectations differ by direction?
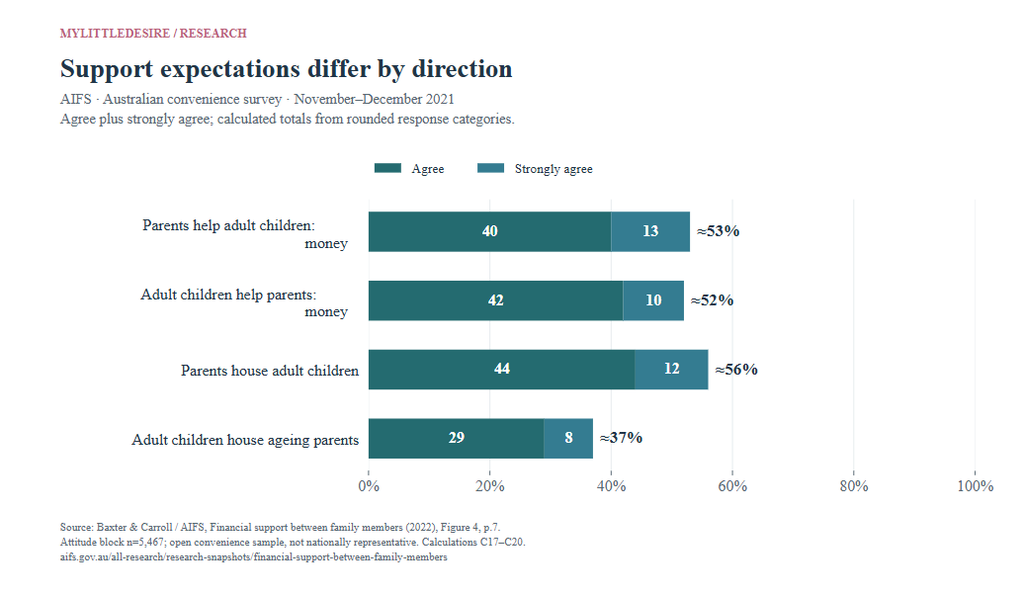
AIFS’ 2021 convenience survey provides a useful historical comparison of four separately worded money and housing questions. The same research snapshot also analyzes HILDA transfers and LSAC pandemic-era need. These are distinct studies, populations and periods, rather than one pooled Australian sample.
| ID | Finding and qualification | Population, actual period and base | Original source and locator |
|---|---|---|---|
| F37 | Parents should help adult children financially in difficulty: 40% agreed and 13% strongly agreed in the 2021 Families in Australia survey. Definition: Separate Agree and Strongly agree categories in one question. Qualification: Open convenience sample, not representative of all Australians. Combined figures in chart 3 are calculated sums of rounded categories. | Australian FiAS 2021 attitude-block respondents n=5,467; exact valid item n not separately printed Australia 2021-11-04 to 2021-12-13 Published input bases: 5,467. Overall report size is not the valid base for every item. | Australian Institute of Family Studies Published 2022-11-16 PDF p.7, Figure 4; p.6 attitude-block base n=5,467. |
| F38 | Adult children should help parents financially when needed: 42% agreed and 10% strongly agreed in the 2021 Families in Australia survey. Definition: Separate Agree and Strongly agree categories in one question. Qualification: Open convenience sample, not representative of all Australians. Combined figures in chart 3 are calculated sums of rounded categories. | Australian FiAS 2021 attitude-block respondents n=5,467; exact valid item n not separately printed Australia 2021-11-04 to 2021-12-13 Published input bases: 5,467. Overall report size is not the valid base for every item. | Australian Institute of Family Studies Published 2022-11-16 PDF p.7, Figure 4; p.6 attitude-block base n=5,467. |
| F39 | Parents should let adult children live with them when needed: 44% agreed and 12% strongly agreed in the 2021 Families in Australia survey. Definition: Separate Agree and Strongly agree categories in one question. Qualification: Open convenience sample, not representative of all Australians. Combined figures in chart 3 are calculated sums of rounded categories. | Australian FiAS 2021 attitude-block respondents n=5,467; exact valid item n not separately printed Australia 2021-11-04 to 2021-12-13 Published input bases: 5,467. Overall report size is not the valid base for every item. | Australian Institute of Family Studies Published 2022-11-16 PDF p.7, Figure 4; p.6 attitude-block base n=5,467. |
| F40 | Adult children should let ageing parents live with them when needed: 29% agreed and 8% strongly agreed in the 2021 Families in Australia survey. Definition: Separate Agree and Strongly agree categories in one question. Qualification: Open convenience sample, not representative of all Australians. Combined figures in chart 3 are calculated sums of rounded categories. | Australian FiAS 2021 attitude-block respondents n=5,467; exact valid item n not separately printed Australia 2021-11-04 to 2021-12-13 Published input bases: 5,467. Overall report size is not the valid base for every item. | Australian Institute of Family Studies Published 2022-11-16 PDF p.7, Figure 4; p.6 attitude-block base n=5,467. |
| F41 | 45% endorsed at least one support item in both directions; 13% endorsed only support for grown-up children and 6% only support for ageing parents. Definition: Agree/strongly agree to at least one money or housing item in the specified direction. Qualification: This is an original published cross-tabulation, not overlap inferred from marginal percentages. Not population-representative. | Australian FiAS attitude-block respondents n=5,467 Australia 2021-11-04 to 2021-12-13 Published input bases: 5,467. Overall report size is not the valid base for every item. | Australian Institute of Family Studies Published 2022-11-16 PDF p.6, joint responses across four attitude questions. |
| F42 | In 2019/20 HILDA data, parental payments were reported by 7.1% of adults 25–34 and 1.5% of those 35+. Definition: Received a parental payment during the preceding financial year. Qualification: Historical transfer measure, not the percentage getting any bill payment, housing or emotional support. Group valid sample sizes unavailable. | Australian HILDA respondents aged 25–34 or 35+, weighted Australia 2019/20 financial year; collected 2020 Item/subgroup bases are not provided alongside these estimates. Overall report size is not the valid base for every item. | Australian Institute of Family Studies Published 2022-11-16 PDF p.4, Table 1; HILDA Wave 20 cross-sectional weights. |
| F43 | Among parental-payment recipients, the median was A$5,000 in both the 25–34 and 35+ age groups in 2019/20. Definition: Median of the parental payment received; Australian dollars, nominal. Qualification: Conditional on receiving a payment. Not the average amount for all adults, not current prices and not comparable to US per-provider medians. | Australian HILDA parental-payment recipients aged 25–34 or 35+ Australia 2019/20 financial year; collected 2020 Item/subgroup bases are not provided alongside these estimates. Overall report size is not the valid base for every item. | Australian Institute of Family Studies Published 2022-11-16 PDF p.4, Table 1, median amount excluding non-recipients. |
| F44 | 18.7% of LSAC respondents aged 20–21 needed more family financial help during early COVID restrictions; 28.7% of non-employed versus 15.8% of employed respondents did so. Definition: Retrospective need relative to usual during early restrictions; help from parents OR other family. Qualification: Unweighted age-20–21 cohort estimates, not all Australian adults or a current employment effect. No causal conclusion. | LSAC age 20–21 respondents n=1,291; employed n=1,002 and not employed n=289 Australia Late 2020 survey recalling early restrictions, usually March–May 2020 Published input bases: 289, 1,002, 1,291. Overall report size is not the valid base for every item. | Australian Institute of Family Studies Published 2022-11-16 PDF p.6, Table 2 and footnotes 4–5; LSAC Wave 9C1. |
What does living together show—and leave unanswered—in Canada?
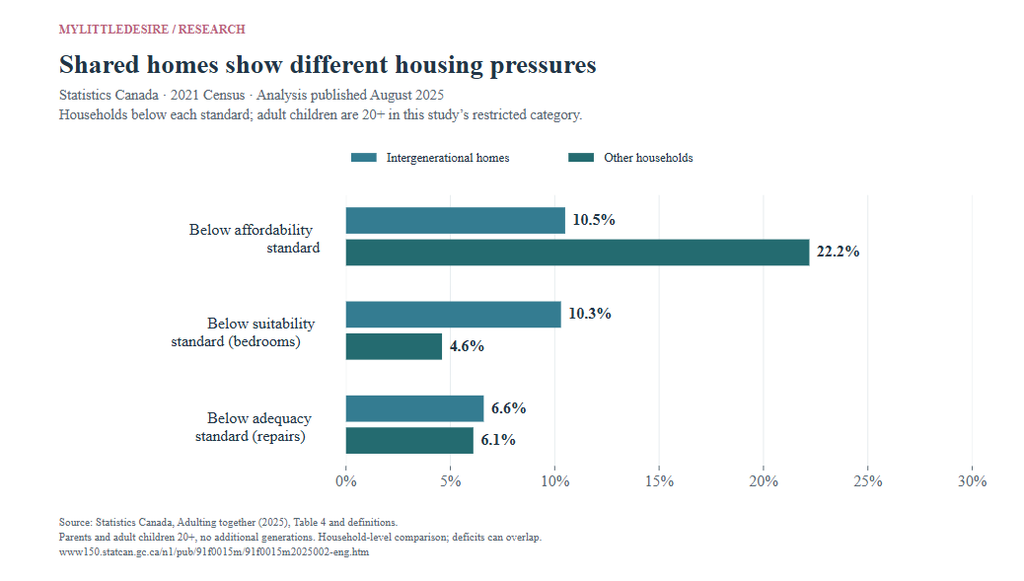
Statistics Canada’s 2021 census analysis describes parents and adult children aged 20+ living without additional family generations. It finds different patterns of housing cost and bedroom pressure. Household composition alone cannot tell us whether a relationship is close, strained or financially dependent.
| ID | Finding and qualification | Population, actual period and base | Original source and locator |
|---|---|---|---|
| F45 | 7.1 million people, or 19.5% of Canada’s private-household population, lived in the study’s intergenerational households in 2021. Definition: Parent plus adult child 20+, no additional generations; includes people in both generations and any other household members. Qualification: Not 19.5% of young adults, not all multigenerational homes, and not evidence of a close relationship. | Private-household population and households; intergenerational category means parents plus adult children aged 20+, without additional generations. Canada 2021 Census of Population; not 2025 or 2027 measurements Item/subgroup bases are not provided alongside these estimates. Overall report size is not the valid base for every item. | Statistics Canada Published 2025-08-14 Highlights and introduction; Data sources, methods and definitions. |
| F46 | 57.0% of people 20–24, 28.1% of those 25–29 and 12.9% of those 30–34 lived in these intergenerational households in 2021. Definition: Age-specific share in the restricted two-generation category. Qualification: Excludes young adults in three-generation households; not the complete share living with parents in every arrangement. | Private-household population and households; intergenerational category means parents plus adult children aged 20+, without additional generations. Canada 2021 Census of Population; not 2025 or 2027 measurements Item/subgroup bases are not provided alongside these estimates. Overall report size is not the valid base for every item. | Statistics Canada Published 2025-08-14 Chart 1 and accompanying age discussion. |
| F47 | 35.0% of Canadians aged 50–54 lived in an intergenerational household in 2021, mainly as parents of adult children. Definition: Share of the age group living in the defined arrangement; a person may be in either generation. Qualification: Do not describe this as 35% of people 50–54 living with their own parents. | Private-household population and households; intergenerational category means parents plus adult children aged 20+, without additional generations. Canada 2021 Census of Population; not 2025 or 2027 measurements Item/subgroup bases are not provided alongside these estimates. Overall report size is not the valid base for every item. | Statistics Canada Published 2025-08-14 Highlights and Chart 1 discussion. |
| F48 | 42.2% of Canada’s one-parent families included children 20+ without additional generations; these comprised 712,400 households. Definition: A parent living with an adult child in this census-family arrangement. Qualification: One-parent families are not limited to households raising minor children. Census families and individuals are different units. | Private-household population and households; intergenerational category means parents plus adult children aged 20+, without additional generations. Canada 2021 Census of Population; not 2025 or 2027 measurements Item/subgroup bases are not provided alongside these estimates. Overall report size is not the valid base for every item. | Statistics Canada Published 2025-08-14 Section on one-parent families and Chart 2. |
| F49 | Among adult children in these households, 57.5% were men; among parents, 56.3% were women. Definition: Composition of each generation, not the share of all men or women living with family. Qualification: Men/women are the source’s two-category gender aggregates. No explanation of the gender pattern is established. | Private-household population and households; intergenerational category means parents plus adult children aged 20+, without additional generations. Canada 2021 Census of Population; not 2025 or 2027 measurements Item/subgroup bases are not provided alongside these estimates. Overall report size is not the valid base for every item. | Statistics Canada Published 2025-08-14 Adult children living with their parents are mostly men not in a couple; Chart 3. |
| F50 | Intergenerational versus other households were below affordability standards at 10.5% versus 22.2%, suitability standards at 10.3% versus 4.6%, and adequacy standards at 6.6% versus 6.1%. Definition: Affordability: shelter costs at least 30% of before-tax income; suitability: enough bedrooms under NOS; adequacy: no major repairs needed. Qualification: Household-level descriptive comparison. Deficits overlap; not a causal estimate of living together or a measure of relationship satisfaction. | Private-household population and households; intergenerational category means parents plus adult children aged 20+, without additional generations. Canada 2021 Census of Population; not 2025 or 2027 measurements Item/subgroup bases are not provided alongside these estimates. Overall report size is not the valid base for every item. | Statistics Canada Published 2025-08-14 Table 4, selected housing characteristics; note 1. |
Where do adult children fit in older adults’ relationship networks?
Relationships Australia’s 2026 special report analyzes its 2024 survey. About one in five respondents aged 65+ named an adult child as their single most important relationship. This is a ranking among all older adults, including people without children, rather than a closeness rate among parents.
| ID | Finding and qualification | Population, actual period and base | Original source and locator |
|---|---|---|---|
| F51 | 20.3% of Australian adults 65+ named an adult child as their most important relationship; 14.1% named a daughter. Definition: Single most-important relationship, among all older adults, not only parents. Qualification: Choosing a partner or another person does not mean the adult-child relationship is poor. Use the narrative estimates; inconsistent figure labels and trend bases are not combined. | Adults 65+ in the 2024 survey, n=654 (men 405; women 249), drawn from n=3,004 adults 18+. Includes people without children. Australia 2024 Relationship Indicators wave; exact field dates not established in this special report Overall report n=654. Item/subgroup bases are not provided alongside these estimates. Overall report size is not the valid base for every item. | Relationships Australia Published 2026-07-27 PDF physical p.11 / printed p.10 narrative; daughter figure also physical p.10. |
| F52 | 32.0% of older women and 13.1% of older men named a child as their most important relationship. Definition: Adult child most important, all respondents 65+ in each gender group. Qualification: Report gives overall men n=405 and women n=249, but some nearby item tests use n=655. Retain published estimates; exact valid weighted item bases not established. | Adults 65+ in the 2024 survey, n=654 (men 405; women 249), drawn from n=3,004 adults 18+. Includes people without children. Australia 2024 Relationship Indicators wave; exact field dates not established in this special report Overall report n=654. Item/subgroup bases are not provided alongside these estimates. Overall report size is not the valid base for every item. | Relationships Australia Published 2026-07-27 PDF physical p.11 / printed p.10 narrative; reported cases women 80 and men 53. |
How much financial support crosses US household boundaries?
The Census Bureau’s September 2026 analysis estimates payments made in 2024 and reported in the 2025 SIPP. Its adult-child category begins at age 21 and excludes recipients living in the provider’s home. Money flowing to parents is reported separately; these totals cannot measure every kind of family help.
| ID | Finding and qualification | Population, actual period and base | Original source and locator |
|---|---|---|---|
| F53 | About 2.6 million US parents gave $26.6 billion to 3.7 million adult children 21+ outside their households in 2024. Definition: Annual voluntary outside-household support, nominal US dollars and weighted population totals. Qualification: Rounded estimates, not sample sizes. Excludes co-resident adult children; no share of all parents can be computed from these totals. | Parents providing voluntary financial support to children 21+ outside the household; other sections concern support to parents outside the household. Demographic comparison is against other parents age 36+. United States 2024 financial support reported in the 2025 Survey of Income and Program Participation Item/subgroup bases are not provided alongside these estimates. Overall report size is not the valid base for every item. | US Census Bureau Published 2026-09-30 Article opening; Historical Patterns; 2025 SIPP, reference year 2024. |
| F54 | The median annual total given by a providing parent to adult children outside the household was $4,725 in 2024. Definition: Median total annual amount per providing parent, nominal US dollars. Qualification: Not an average, monthly amount, all-parent median or amount per adult child. | Parents providing voluntary financial support to children 21+ outside the household; other sections concern support to parents outside the household. Demographic comparison is against other parents age 36+. United States 2024 financial support reported in the 2025 Survey of Income and Program Participation Item/subgroup bases are not provided alongside these estimates. Overall report size is not the valid base for every item. | US Census Bureau Published 2026-09-30 Historical Patterns, discussion of Table 1. |
| F55 | Among parents providing this support, 72.7% supported one adult child, 18.8% supported two and 8.6% supported three or more. Definition: Number of supported nonresident children 21+ among providing parents. Qualification: Rounded categories sum to 100.1%; do not normalize them or treat them as separate surveys. | Parents providing voluntary financial support to children 21+ outside the household; other sections concern support to parents outside the household. Demographic comparison is against other parents age 36+. United States 2024 financial support reported in the 2025 Survey of Income and Program Participation Item/subgroup bases are not provided alongside these estimates. Overall report size is not the valid base for every item. | US Census Bureau Published 2026-09-30 Article opening and Historical Patterns. |
| F56 | Support also flowed upward: 7.2 million parents outside providers’ households received $20.2 billion in 2024. Definition: Annual voluntary transfers to parents outside the provider’s household. Qualification: Recipient-parent count differs from the 2.6-million provider-parent count for downward transfers. Do not compare those counts as the same population or infer unique-family totals. | Parents providing voluntary financial support to children 21+ outside the household; other sections concern support to parents outside the household. Demographic comparison is against other parents age 36+. United States 2024 financial support reported in the 2025 Survey of Income and Program Participation Item/subgroup bases are not provided alongside these estimates. Overall report size is not the valid base for every item. | US Census Bureau Published 2026-09-30 Financial Support May Also Go to Parents and Other Relatives. |
| F57 | Parents providing adult-child support were more often employed (68.3% versus 58.0%) and divorced (20.8% versus 14.3%) than other parents in the Census comparison. Definition: Provider/nonprovider demographic profiles in the article’s parent comparison. Qualification: Does not show that employment or divorce causes support, or that most divorced parents provide it. Exact analytic subgroup n unavailable. | Parents providing voluntary financial support to children 21+ outside the household; other sections concern support to parents outside the household. Demographic comparison is against other parents age 36+. United States 2024 financial support reported in the 2025 Survey of Income and Program Participation Item/subgroup bases are not provided alongside these estimates. Overall report size is not the valid base for every item. | US Census Bureau Published 2026-09-30 Who Provided Support to Adult Children? Figure 2 discussion, parents age 36+. |
How do US co-residence and caregiving overlap?
The Federal Reserve’s 2025 survey, published in May 2026, shows that living with a parent remains common among young adults. Co-residence was also more common among certain caregivers. That association cannot identify the share of co-resident families who need care or explain why they chose to live together.
| ID | Finding and qualification | Population, actual period and base | Original source and locator |
|---|---|---|---|
| F58 | 19% of US adults lived with an adult child, 15% with a parent, and 2% with both a parent and an adult child in 2025. Definition: All adults; adult child means age 18+. Overlapping household relationships. Qualification: Do not add 19% and 15% without accounting for overlap. Co-residence is not an emotional-support or dependency measure. | Adults 18+; final analytic sample n=12,934. Co-resident adult-child and parent groups and adult-caregiver groups have different eligible bases. United States 2025-10-17 to 2025-10-28 Overall report n=12,934. Published input bases: 12,934. Overall report size is not the valid base for every item. | Board of Governors of the Federal Reserve System Published May 2026; exact release day not independently established PDF physical p.27 / printed p.23, Living Arrangements and Table 8. |
| F59 | 49% of adults 18–29 lived with a parent in 2025, up 6 percentage points from 2022 and 12 points from 2019. Definition: Share of adults under 30, with source-reported historical comparisons. Qualification: These changes are explicitly reported by the Federal Reserve, not new MyLittleDesire discoveries. Age and household definitions differ from Canadian census figures. | US SHED respondents 18–29; subgroup valid n not printed United States 2025-10-17 to 2025-10-28 Overall report n=12,934. Item/subgroup bases are not provided alongside these estimates. Overall report size is not the valid base for every item. | Board of Governors of the Federal Reserve System Published May 2026; exact release day not independently established PDF physical p.27 / printed p.23, Living Arrangements. |
| F60 | 61% of adult-child caregivers lived with an adult child, versus 19% of adults overall; 36% of parent caregivers lived with a parent, versus 15% overall. Definition: Regular unpaid care due to aging, disability or illness; parent care can include a spouse’s/partner’s parent. Qualification: Different denominators: caregivers versus all adults. Does not estimate the share of co-resident families needing care or prove which household member receives it. | US regular adult-child caregivers or parent/in-law caregivers; exact eligible n unavailable United States 2025-10-17 to 2025-10-28 Overall report n=12,934. Item/subgroup bases are not provided alongside these estimates. Overall report size is not the valid base for every item. | Board of Governors of the Federal Reserve System Published May 2026; exact release day not independently established PDF physical pp.27–28 / printed pp.23–24. |
20 transparent comparisons for writers and researchers
These calculations make the source inputs easier to compare. They are descriptive arithmetic, not new survey estimates, causal effects or significance tests. A percentage-point difference describes subtraction between percentages; it is not a percentage growth rate. The four Australian combined totals are approximate sums of rounded response categories.
| ID | Comparison | Arithmetic and result | Inputs and interpretation limit |
|---|---|---|---|
| C01 | Relationship-quality ratings: parents minus young adults | 77 − 59 = 18.0 percentage points | F01 / F01 Unmatched surveys and randomly selected relatives; not paired household disagreement. |
| C02 | Young adults: wanted more minus less parental involvement | 22 − 9 = 13.0 percentage points | F20 / F20 Different response categories to one preference question; not a recommended amount of involvement. |
| C03 | Parents: wanted more minus less involvement | 26 − 7 = 19.0 percentage points | F21 / F21 Descriptive preference-category difference, not a health threshold. |
| C04 | Young adults: wanted more minus less communication | 27 − 7 = 20.0 percentage points | F18 / F18 Different response categories; no paired change or clinical interpretation. |
| C05 | Parents: wanted more minus less communication | 36 − 3 = 33.0 percentage points | F19 / F19 Omitted no-answer share is not assigned to either category. |
| C06 | Young adults: mother minus father relationship quality | 63 − 53 = 10.0 percentage points | F02 / F02 Randomly assigned-parent subgroups, not paired ratings of both parents. |
| C07 | Young adults: authenticity with mother minus father | 73 − 64 = 9.0 percentage points | F03 / F03 Unadjusted subgroup comparison, not a gender-caused effect. |
| C08 | Young adults: know mother minus father well | 51 − 42 = 9.0 percentage points | F04 / F04 Subgroup difference, not the change from getting to know a parent. |
| C09 | Emotional reliance on parents: young women minus men | 35 − 27 = 8.0 percentage points | F06 / F06 Descriptive subgroup comparison; no new significance test. |
| C10 | Perceived parental emotional reliance: mother minus father | 35 − 12 = 23.0 percentage points | F07 / F07 Young-adult reports of parental reliance; different randomly assigned-parent subgroups. |
| C11 | GB adult-child parents: closeness minus friendship | 70 − 57 = 13.0 percentage points | F25 / F26 Different multi-select questions, possibly different children. Not the share close but not friends; individual overlap unknown. |
| C12 | GB housing obligation: parents-to-children minus children-to-parents | 39 − 30 = 9.0 percentage points | F34 / F35 Two hypothetical questions among all adults; marginal difference, not individual inconsistency. |
| C13 | GB parental housing obligation: age 18–24 minus 55+ | 56 − 35 = 21.0 percentage points | F36 / F36 Cross-sectional respondent-age contrast; not change over the life course. |
| C14 | Canada: below suitability standard, intergenerational minus other | 10.3 − 4.6 = 5.7 percentage points | F50 / F50 Household-level 2021 census contrast; not a causal effect or relationship-quality estimate. |
| C15 | Canada: below affordability standard, intergenerational minus other | 10.5 − 22.2 = -11.7 percentage points | F50 / F50 Negative sign means a lower share below affordability standard; no causal inference. |
| C16 | GB upward housing obligation: age 18–24 minus 55+ | 50 − 25 = 25.0 percentage points | F36 / F36 Descriptive age-group contrast under the same question wording. |
| C17 | Australia: agree/strongly agree, parents help financially | 40 + 13 = 53.0 % (approximate) | F37 / F37 Sum of two independently rounded source categories in a 2021 convenience sample. Approximate combined agreement, not an unrounded published NET or current national estimate. |
| C18 | Australia: agree/strongly agree, adult children help financially | 42 + 10 = 52.0 % (approximate) | F38 / F38 Sum of two independently rounded source categories in a 2021 convenience sample. Approximate combined agreement, not an unrounded published NET or current national estimate. |
| C19 | Australia: agree/strongly agree, parents provide housing | 44 + 12 = 56.0 % (approximate) | F39 / F39 Sum of two independently rounded source categories in a 2021 convenience sample. Approximate combined agreement, not an unrounded published NET or current national estimate. |
| C20 | Australia: agree/strongly agree, adult children provide housing | 29 + 8 = 37.0 % (approximate) | F40 / F40 Sum of two independently rounded source categories in a 2021 convenience sample. Approximate combined agreement, not an unrounded published NET or current national estimate. |
Three useful editorial distinctions: British adults endorsed money obligations equally in both directions, but not housing obligations. Canada’s intergenerational homes showed lower affordability pressure alongside higher bedroom-suitability pressure. In both US respondent groups, wanting more contact was more common than wanting less—while most respondents said the amount was about right. Each comparison stays within its original source and definition.
Common questions about parent–adult child relationships
What percentage of parents have a close relationship with adult children?
There is no single interchangeable measure. Pew’s 2023 US parent survey found 77% rated the selected relationship excellent or very good (F01). YouGov’s 2026 GB adult-child-parent crosstab found 70% selected one or more adult children as particularly close (F25). The questions and eligible groups differ; they cannot form a country ranking. Original source.
How often do adult children talk to their parents?
Among US young adults with a nonresident parent, 61% texted and 46% called or video-chatted with their most-contacted nonresident parent at least a few times a week in 2023 (F14). Those figures do not apply to every adult child, every parent or those living together. Original source.
Do most parents want more involvement?
In Pew’s 2023 parent survey, 67% said involvement was about right, 26% wanted more and 7% wanted less (F21). Wanting additional involvement was a minority response; it was more common than wanting less. Original source.
Can parents and adult children be friends?
In YouGov’s 2026 GB adult-child-parent subgroup, 57% described one or more adult children as friends (F26). That is a self-described relationship, not a universal recommendation or a measure of friendship with every child. Original source.
How common is financial help for adult children?
The answer depends on whether support includes housing, bills, direct transfers or other help. The Census figures here count nonresident recipients 21+ and cannot establish the percentage of all US parents providing every form of help (F53–F55). Original source.
Does living with parents mean dependence or a poor relationship?
No such conclusion follows from residence data alone. Housing, care, education and other circumstances can coincide with co-residence. Canada’s household figures and US caregiving comparisons do not isolate motives or relationship quality (F45–F50, F58–F60). Original source.
Methodology and limitations
How was this resource assembled?
We prioritized accessible original reports, crosstabs and official statistical analyses from Pew Research Center, YouGov, AIFS, Statistics Canada, Relationships Australia, the US Census Bureau and the Federal Reserve. Each finding has a source locator, actual period, population and caveat. The downloadable research records distinguish reported inputs from our calculations.
What does “60 findings” mean?
The article groups related figures into 60 findings; it does not claim 60 independent studies. There are seven original-source reports or analyses from seven publishing organizations. Pew contributes 24 findings (40%); its parent and young-adult surveys are separate. AIFS contributes results from FiAS, HILDA and LSAC, whose different methods remain identified.
How were numbers and calculations checked?
Reported values were checked in original accessible documents or analyses. We retained published combined estimates when rounded component percentages did not add to them. Calculations C01–C20 use the displayed source inputs, with reader-friendly precision. C17–C20 explicitly sum rounded response categories and are approximate. No confidence intervals, significance tests or causal estimates were newly calculated.
What did MyLittleDesire contribute?
MyLittleDesire selected and organized the evidence, aligned compatible items from the same sources, calculated descriptive contrasts and designed four charts. Several contrasts are already evident in or discussed by the original researchers. This is original editorial synthesis and presentation, rather than new fieldwork or a claim of 20 novel scientific discoveries.
Which comparisons are not valid?
The studies use different age thresholds, countries, dates, questions and units. We do not pool them into a global prevalence estimate or rank countries for closeness. Marginal percentages cannot reveal individual overlap, and unmatched parent/young-adult samples cannot identify household disagreement. Attitudes do not establish actual support, while co-residence does not measure relationship quality.
Where is the evidence least complete?
Exact valid subgroup/item samples and uncertainty measures are not always published next to the estimates. Unknowns remain blank in the research files. AIFS’ open 2021 sample is not nationally representative. Relationships Australia’s narrative estimates are retained with item-base discrepancies disclosed; inconsistent figure labels and trend bases are not combined. Inaccessible AARP full reports and an affluent commercial sample were excluded from the publishable database.
Does this measure estrangement or prescribe family boundaries?
No. Pew required contact with at least one eligible relative, and YouGov’s bad-relationship item is not an estrangement definition. Contact preferences do not establish a healthy-contact quota. For the separate evidence on disconnected relationships, see Family Estrangement Statistics.
What does the 2027 label mean?
2027 is the editorial edition. Sources were reviewed October 31, 2026; actual reference periods run from the 2019/20 financial year through 2026. Publication dates and fieldwork dates are shown separately. This resource contains no 2027 survey measurements or forecasts.
Related research from MyLittleDesire
For detailed care roles and their relationship implications, read Family Caregiving and Relationship Statistics. For different family ties, see Sibling Relationship Statistics. This hub concentrates on contact, closeness, expectations and support between parents and adult children.
Complete original-source bibliography
- S01 · Pew Research Center. Parents, Young Adult Children and the Transition to Adulthood.
Published: 2024-01-25. Actual data: 2023-10-24 to 2023-11-05.
Population: Two separate surveys: parents with a child 18–34 in contact (n=3,017); adults 18–34 with a living parent in contact (n=1,495). Eligible children exclude high-school students.
Method: American Trends Panel, probability-based address recruitment and demographic weighting. Parent overall margin ±2.5 percentage points; young-adult overall margin ±4.0 at 95% confidence. These are NOT matched families. Some questions concern one randomly selected relative, others any children or the most-contacted nonresident relative. See question-specific definitions.
Limits: Contact screen excludes respondents with no qualifying relative in contact; findings cannot measure estrangement prevalence. Overall sample sizes and margins do not apply to every routed item or subgroup. Published combined estimates retained even when rounded components do not sum. April 2025 correction concerns employment data not used here.
Supporting document 1; Supporting document 2; Supporting document 3; Supporting document 4. - S02 · YouGov. The YouGov Big Survey on Family.
Published: 2026-07-09. Actual data: 2026-06-02 to 2026-06-03.
Population: GB adults 18+; n=1,939 overall. Adult-child-parent crosstab: Over 18 years column, unweighted n=711 and weighted base 662.
Method: Original YouGov online-panel survey and demographic crosstabs. Overall and subgroup unweighted/weighted bases printed in the tables. Parent status is not mutually exclusive across child-age columns. Exact full weighting targets and probability recruitment are not documented in this PDF.
Limits: Use the clearly labeled adult-child-parent column for closeness, friendship and bad relationships. These are separate multi-select questions about one or more children; overlap and whether the same child was selected are unknown. Attitude questions ask all adults, including people without children. Overall n must not replace eligible or item bases.
Supporting document 1; Supporting document 2; Supporting document 3. Reviewed October 31, 2026. - S03 · Australian Institute of Family Studies. Financial support between family members.
Published: 2022-11-16. Actual data: Attitudes: 2021-11-04 to 2021-12-13. HILDA Wave 20: 2019/20 financial year, collected 2020. LSAC Wave 9C1: late 2020, recalling early restrictions, mostly March–May 2020..
Population: Three distinct study programs in one original analysis: Families in Australia adults 18+ (attitude block n=5,467); HILDA adult age groups 25+; LSAC ages 20–21 (n=1,291).
Method: FiAS was an open convenience survey, not population-representative. HILDA Table 1 uses cross-sectional weights. LSAC Table 2 reports unweighted percentages for n=1,291 aged 20–21 (employed n=1,002; not employed n=289). The datasets are not one pooled sample.
Limits: Historical evidence, not current Australian prevalence. FiAS underrepresents younger people and men. HILDA group valid n unavailable in this snapshot. LSAC concerns parents OR other family and retrospective pandemic need. Rounded Agree plus Strongly agree sums are our calculations, not published unrounded NETs.
Supporting document 1; Supporting document 2; Supporting document 3. Reviewed October 31, 2026. - S04 · Statistics Canada. Adulting together: Parents and adult children who co-reside.
Published: 2025-08-14. Actual data: 2021 Census of Population; not 2025 or 2027 measurements.
Population: Private-household population and households; intergenerational category means parents plus adult children aged 20+, without additional generations.
Method: Original census analysis. Usual place of residence determines household membership. A parent and adult child may form different census-family types. Persons, parents, adult children, one-parent families and households are different denominators.
Limits: Excludes other arrangements, including three-generation households, from this specific intergenerational category. Cannot measure closeness, conflict, dependency or who moved into whose home. Housing deficits can overlap. Gender is a two-category aggregate that also redistributes some non-binary respondents for confidentiality.. Reviewed October 31, 2026. - S05 · Relationships Australia. Relationship Indicators: Implications for elder abuse action and awareness.
Published: 2026-07-27. Actual data: 2024 Relationship Indicators wave; exact field dates not established in this special report.
Population: Adults 65+ in the 2024 survey, n=654 (men 405; women 249), drawn from n=3,004 adults 18+. Includes people without children.
Method: Original special analysis of Social Research Centre Life in Australia™ panel data. The report describes a population-representative panel reflecting age, gender and geography. Uses the single most-important-relationship question, not a rating of every child.
Limits: Most important is not the same as close, loved or exclusive source of support. Not a percentage among parents only. Some inferential footnotes use n=655 and female case percentages imply item-level differences; retain published estimates and disclose unreconciled bases. No elder-abuse prevalence is inferred.
Supporting document 1. Reviewed October 31, 2026. - S06 · US Census Bureau. Parental Financial Support Does Not End When Children Grow Up, Even After They Move Out.
Published: 2026-09-30. Actual data: 2024 financial support reported in the 2025 Survey of Income and Program Participation.
Population: Parents providing voluntary financial support to children 21+ outside the household; other sections concern support to parents outside the household. Demographic comparison is against other parents age 36+.
Method: Original America Counts analysis of nationally representative longitudinal SIPP. Records detailed outside-household support and annual amounts. Article gives weighted population estimates and a median; exact analytic sample sizes and confidence intervals are not printed alongside these summaries.
Limits: Excludes adult children living in the provider’s household and many in-kind support arrangements. Rounded millions and billions are population estimates, not sample n. A median per providing parent is not a per-child average. Recipients may receive support from more than one provider; do not sum unique populations or reverse-engineer an average from rounded totals.. Reviewed October 31, 2026. - S07 · Board of Governors of the Federal Reserve System. Report on the Economic Well-Being of US Households in 2025.
Published: May 2026; exact release day not independently established. Actual data: 2025-10-17 to 2025-10-28.
Population: Adults 18+; final analytic sample n=12,934. Co-resident adult-child and parent groups and adult-caregiver groups have different eligible bases.
Method: 2025 SHED administered online by Ipsos KnowledgePanel, probability-based address recruitment and weighting. Of 13,099 completed surveys, 165 were excluded; final analysis n=12,934. Cumulative recruitment/profile/completion response rate 4.1%.
Limits: Co-residence does not establish care need or emotional closeness. Caregiving questions ask regular unpaid help for aging, disability or illness and may omit irregular or very infrequent help. Parent care may include a spouse’s or partner’s parent. No new tests or policy-effect claims.
Supporting document 1. Reviewed October 31, 2026.
How to cite this resource
MyLittleDesire. Parent–Adult Child Relationship Statistics 2027. https://mylittledesire.com/parent-adult-child-relationship-statistics/.