
Family time can mean valuing togetherness, feeling short of time with children, doing an activity together or being in the same place. Those meanings lead to different statistics. In a 2023 US survey, 73% of adults called spending time with family one of the most important things to them. In a separate March 2026 survey, 56% of working parents felt they spent too little time with their children. The first is an importance rating; the second is a self-assessment of time. Pew Research Center [S01]; Pew Research Center [S02].
This resource presents 65 published observations in 20 groups, four original charts and ten reproducible descriptive comparisons from five numerical source records and four publisher labels. Related categories and demographic cells are not independent studies. The US, Canadian and historical Australian evidence uses different populations, periods and measures; it does not form a global average or country ranking.
73%
56%
Called family time one of the most important things to them.US adults, March–April 2023; importance, not hours. Pew Research Center [S01]
Felt they spent too little time with their children.All working parents of under-18s, March 2026. Pew Research Center [S02]
59%
0.26 hours
Did work tasks while with their children at least sometimes.Full-time working parents, March 2026. Pew Research Center [S02]
Average daily primary playing/hobbies time with children.US household adults 18+, 2025; decimal hours, not 26 minutes. US Bureau of Labor Statistics [S03]
What do family time statistics measure?
A useful family-time statistic keeps its definition beside its number. Wanting more time does not tell us how many hours someone spent with family. Primary childcare records a main activity; co-presence records who was there. Neither automatically measures attention, warmth, enjoyment or relationship quality.
| Measure | What it captures | What it cannot establish |
|---|---|---|
| Personal importance | How highly adults value spending time with family | Actual duration or satisfaction |
| Perceived time adequacy | Whether working parents feel child time is too little, right or too much | A daily-hour threshold or observed neglect |
| Work spillover / missed activities | Self-reported work tasks with children or missed events | Uninterrupted attention or number of missed events |
| Primary interactive childcare | Main diary activities such as reading, talking and playing | All co-presence, secondary childcare or all family time |
| Adjusted co-presence and childcare | Modelled daily minutes for specific employee-parent groups | Raw averages, causal telework effects or all face-to-face interaction |
| Historical family activity frequency | Reported shared activities of 4–5-year-olds in 2004 | Current Australian prevalence or change since 2004 |
Meals are another specific form of contact, with their own questions about who ate together and how often. See our shared meals and social connection statistics for those definitions.
Also Read:-
Parenthood Relationship Satisfaction Statistics 2027
Parenting Partnership Roles Statistics 2027
Wedding Cost by State Statistics 2027
Wedding Planning Stress Statistics 2027
How important is family time to adults?
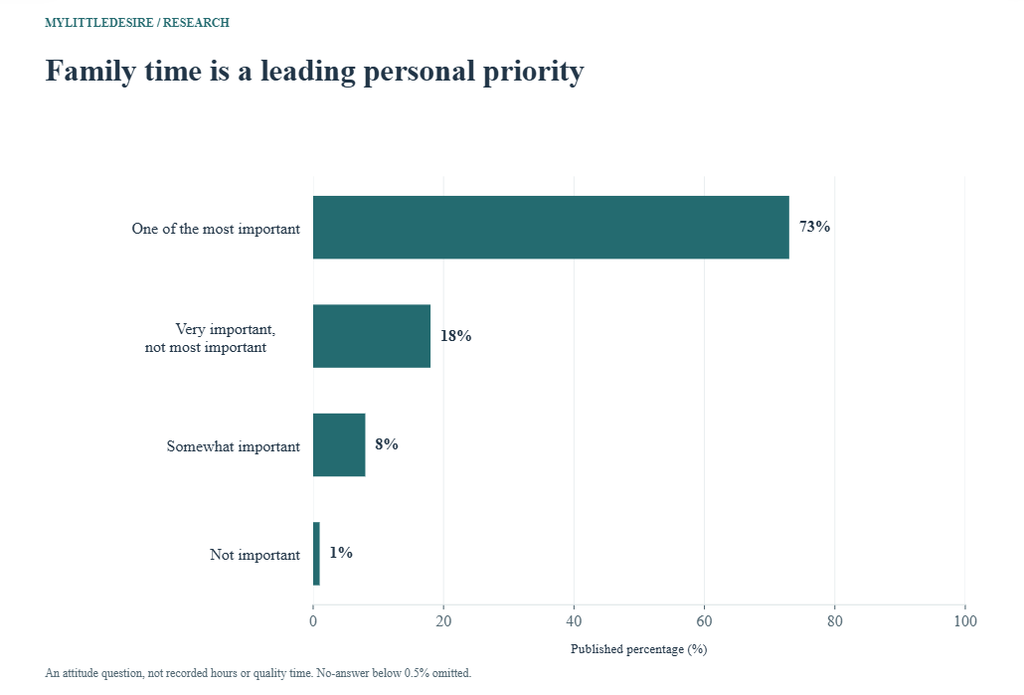
F01 IMP_PER item e, importance regardless of actual time spent. Four original response categories; no-answer below 0.5% omitted, not treated as zero. Attitude is not measured togetherness.
| Measure / group | Published result | Eligible audience, period and base | Source |
|---|---|---|---|
| One of the most important things | 73% | US adults age 18+ March 27–April 2, 2023 · United States · Exact valid item/subgroup n unavailable | Original source [S01] Topline p.1, IMP_PER item e, March 2023 row |
| Very important, but not the most important | 18% | US adults age 18+ March 27–April 2, 2023 · United States · Exact valid item/subgroup n unavailable | Original source [S01] Topline p.1, IMP_PER item e, March 2023 row |
| Somewhat important | 8% | US adults age 18+ March 27–April 2, 2023 · United States · Exact valid item/subgroup n unavailable | Original source [S01] Topline p.1, IMP_PER item e, March 2023 row |
| Not important | 1% | US adults age 18+ March 27–April 2, 2023 · United States · Exact valid item/subgroup n unavailable | Original source [S01] Topline p.1, IMP_PER item e, March 2023 row |
Pew’s question explicitly asks respondents to rate importance regardless of how much time they spend doing the activity. The 73% result therefore supports a statement about personal priorities. It cannot establish that adults spend most of their free time with family. The original topline’s four response categories are retained; the article’s rounded “nine-in-ten” wording is not added as a separate precise estimate. Pew Research Center [S01].
Do working parents feel they have enough child time?
F02 TIMECHILD, all working parents including full- and part-time employed. Self-rated amount; rounded categories total 99, with no-answer below 0.5%. Not a diary-hour measure.
| Measure / group | Published result | Eligible audience, period and base | Source |
|---|---|---|---|
| Too little time | 56% | US parents/guardians of children under 18 employed full or part time March 2–15, 2026 · United States · Exact valid item/subgroup n unavailable | Original source [S02] Topline printed p.16, TIMECHILD, March 2026 row |
| The right amount of time | 40% | US parents/guardians of children under 18 employed full or part time March 2–15, 2026 · United States · Exact valid item/subgroup n unavailable | Original source [S02] Topline printed p.16, TIMECHILD, March 2026 row |
| Too much time | 3% | US parents/guardians of children under 18 employed full or part time March 2–15, 2026 · United States · Exact valid item/subgroup n unavailable | Original source [S02] Topline printed p.16, TIMECHILD, March 2026 row |
These responses cover working parents employed either full time or part time. They are subjective assessments, and the published categories total 99% because of rounding and a very small no-answer share. A parent can value family time highly and still judge the available amount insufficient; these two surveys do not track the same respondents or establish that relationship statistically. Pew Research Center [S02].
What limits time with children?
F03 TIMCHLDMOD, major reason responses among working parents reporting too little time. Conditional routed question n=1,264, including full- and part-time workers. Reasons independently rated and may overlap; not an exclusive distribution.
| Measure / group | Published result | Eligible audience, period and base | Source |
|---|---|---|---|
| Work obligations | 65% | US parents/guardians of children under 18 employed full or part time reporting too little time with children March 2–15, 2026 · United States · Explicit routed question base n=1,264 | Original source [S02] Topline printed p.17, TIMCHLDMOD items a–d, major reason |
| Other family or household obligations | 25% | US parents/guardians of children under 18 employed full or part time reporting too little time with children March 2–15, 2026 · United States · Explicit routed question base n=1,264 | Original source [S02] Topline printed p.17, TIMCHLDMOD items a–d, major reason |
| Children do not live with parent all the time | 11% | US parents/guardians of children under 18 employed full or part time reporting too little time with children March 2–15, 2026 · United States · Explicit routed question base n=1,264 | Original source [S02] Topline printed p.17, TIMCHLDMOD items a–d, major reason |
| Children too busy with schoolwork or other activities | 16% | US parents/guardians of children under 18 employed full or part time reporting too little time with children March 2–15, 2026 · United States · Explicit routed question base n=1,264 | Original source [S02] Topline printed p.17, TIMCHLDMOD items a–d, major reason |
Work obligations were the most commonly selected major reason among these four separately rated items. The denominator is parents who already said they spent too little time with their children, not all parents. The original topline explicitly reports a routed question base of 1,264. Because respondents rated each reason independently, the percentages should not be added to allocate all causes of limited family time.
How does work spill into family time?
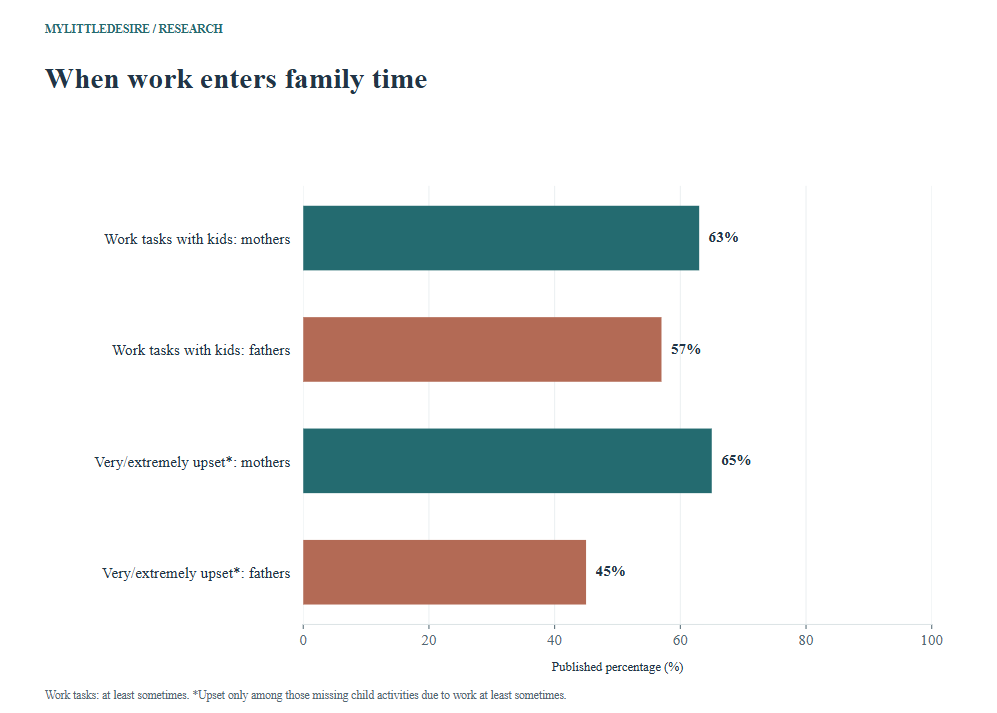
F04 Full-time working parents taking care of work tasks while with children at least sometimes. At-least-sometimes frequency, not only extremely/very often; separate respondent groups, not paired parents or observed interruptions.
| Measure / group | Published result | Eligible audience, period and base | Source |
|---|---|---|---|
| All full-time working parents | 59% | US parents/guardians of children under 18 employed full time March 2–15, 2026 · United States · Exact valid item/subgroup n unavailable | Original source [S02] Report physical p.6 / printed p.5, work tasks while with their kids row |
| Fathers employed full time | 57% | US parents/guardians of children under 18 employed full time — Fathers employed full time March 2–15, 2026 · United States · Exact valid item/subgroup n unavailable | Original source [S02] Report physical p.6 / printed p.5, work tasks while with their kids row |
| Mothers employed full time | 63% | US parents/guardians of children under 18 employed full time — Mothers employed full time March 2–15, 2026 · United States · Exact valid item/subgroup n unavailable | Original source [S02] Report physical p.6 / printed p.5, work tasks while with their kids row |
F05 Full-time-employed subset saying too little time with children. Different population from the 56% among all working parents; do not treat the two as an experimental work-hours contrast.
| Measure / group | Published result | Eligible audience, period and base | Source |
|---|---|---|---|
| Too little child time, full-time workers | 60% | US parents/guardians of children under 18 employed full time March 2–15, 2026 · United States · Exact valid item/subgroup n unavailable | Original source [S02] Report physical p.7 / printed p.6, first paragraph |
Among full-time working parents, the mother–father difference in reporting work tasks while with children is six percentage points. This describes separate groups answering a frequency question, not differences within matched couples or a direct observation of distraction. The 60% full-time “too little time” figure is a separate population estimate from the 56% for all working parents; subtracting them would not identify an effect of working full time. Pew Research Center [S02].
How do parents feel about missing children’s activities?
F06 At least sometimes missed child activities because of work in the past 12 months. Full-time working parents; not the broader all-working-parent topline percentage. Does not count missed events or hours.
| Measure / group | Published result | Eligible audience, period and base | Source |
|---|---|---|---|
| Missed child activities at least sometimes | 47% | US parents/guardians of children under 18 employed full time March 2–15, 2026 · United States · Exact valid item/subgroup n unavailable | Original source [S02] Report physical p.7 / printed p.6, second paragraph; MISSKIDACT1 full-time cut |
F07 Normally feel this upset when missing child activities due to work; conditional on missing at least sometimes in the past 12 months. Conditional full-time base unavailable; broader all-employed MISSKIDACT2 n=986 not assigned. All-parent rounded categories total 101. Three exclusive upset categories, not prevalence among all parents.
| Measure / group | Published result | Eligible audience, period and base | Source |
|---|---|---|---|
| Extremely or very upset | 55% | US parents/guardians of children under 18 employed full time who missed child activities due to work at least sometimes in the past 12 months — All eligible full-time working parents March 2–15, 2026 · United States · Exact valid item/subgroup n unavailable | Original source [S02] Report physical p.7 / printed p.6, normally upset chart; MISSKIDACT2 full-time cut |
| Somewhat upset | 37% | US parents/guardians of children under 18 employed full time who missed child activities due to work at least sometimes in the past 12 months — All eligible full-time working parents March 2–15, 2026 · United States · Exact valid item/subgroup n unavailable | Original source [S02] Report physical p.7 / printed p.6, normally upset chart; MISSKIDACT2 full-time cut |
| Not too or not at all upset | 9% | US parents/guardians of children under 18 employed full time who missed child activities due to work at least sometimes in the past 12 months — All eligible full-time working parents March 2–15, 2026 · United States · Exact valid item/subgroup n unavailable | Original source [S02] Report physical p.7 / printed p.6, normally upset chart; MISSKIDACT2 full-time cut |
F08 Normally feel this upset when missing child activities due to work; conditional on missing at least sometimes in the past 12 months. Conditional full-time base unavailable; broader all-employed MISSKIDACT2 n=986 not assigned. All-parent rounded categories total 101. Three exclusive upset categories, not prevalence among all parents.
| Measure / group | Published result | Eligible audience, period and base | Source |
|---|---|---|---|
| Extremely or very upset | 45% | US parents/guardians of children under 18 employed full time who missed child activities due to work at least sometimes in the past 12 months — Eligible full-time working fathers March 2–15, 2026 · United States · Exact valid item/subgroup n unavailable | Original source [S02] Report physical p.7 / printed p.6, normally upset chart; MISSKIDACT2 full-time cut |
| Somewhat upset | 42% | US parents/guardians of children under 18 employed full time who missed child activities due to work at least sometimes in the past 12 months — Eligible full-time working fathers March 2–15, 2026 · United States · Exact valid item/subgroup n unavailable | Original source [S02] Report physical p.7 / printed p.6, normally upset chart; MISSKIDACT2 full-time cut |
| Not too or not at all upset | 13% | US parents/guardians of children under 18 employed full time who missed child activities due to work at least sometimes in the past 12 months — Eligible full-time working fathers March 2–15, 2026 · United States · Exact valid item/subgroup n unavailable | Original source [S02] Report physical p.7 / printed p.6, normally upset chart; MISSKIDACT2 full-time cut |
F09 Normally feel this upset when missing child activities due to work; conditional on missing at least sometimes in the past 12 months. Conditional full-time base unavailable; broader all-employed MISSKIDACT2 n=986 not assigned. All-parent rounded categories total 101. Three exclusive upset categories, not prevalence among all parents.
| Measure / group | Published result | Eligible audience, period and base | Source |
|---|---|---|---|
| Extremely or very upset | 65% | US parents/guardians of children under 18 employed full time who missed child activities due to work at least sometimes in the past 12 months — Eligible full-time working mothers March 2–15, 2026 · United States · Exact valid item/subgroup n unavailable | Original source [S02] Report physical p.7 / printed p.6, normally upset chart; MISSKIDACT2 full-time cut |
| Somewhat upset | 31% | US parents/guardians of children under 18 employed full time who missed child activities due to work at least sometimes in the past 12 months — Eligible full-time working mothers March 2–15, 2026 · United States · Exact valid item/subgroup n unavailable | Original source [S02] Report physical p.7 / printed p.6, normally upset chart; MISSKIDACT2 full-time cut |
| Not too or not at all upset | 4% | US parents/guardians of children under 18 employed full time who missed child activities due to work at least sometimes in the past 12 months — Eligible full-time working mothers March 2–15, 2026 · United States · Exact valid item/subgroup n unavailable | Original source [S02] Report physical p.7 / printed p.6, normally upset chart; MISSKIDACT2 full-time cut |
The upset denominator matters: These responses are among full-time working parents who missed child activities because of work at least sometimes during the past 12 months. The 65% figure for mothers is not a percentage of all mothers. The broader all-employed routed base of 986 in the topline is not assigned to this narrower full-time subset.
The three upset categories describe how eligible respondents normally feel when a missed activity occurs. The all-parent percentages total 101% after rounding. They do not tell us how many events a parent missed, how a child felt, or whether a particular job arrangement caused distress.
How much interactive childcare appears in US diaries?
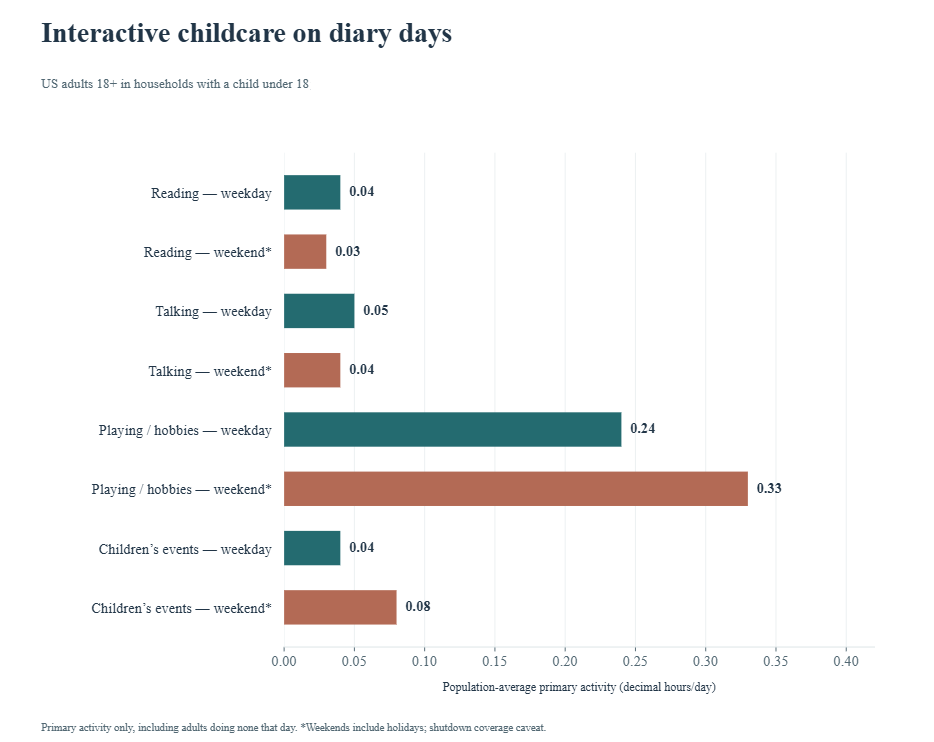
The American Time Use Survey asks about the previous day. Table 9 reports average primary childcare activity time for adults age 18 or older living in households with a child under 18. This includes adults who recorded no time in the selected activity and can include household adults who are not parents. These are population averages, rather than time spent only by people who performed the activity. US Bureau of Labor Statistics [S03].
F10 2025 ATUS Table 9 under-18-household block, average day; source all/men/women columns. Population-average primary activity hours per day, adults 18+ in households with a child under 18. Includes adults doing none that day; not parents-only or activity-participant time. Decimal hours, not clock minutes. 2025 shutdown caveat applies.
| Measure / group | Published result | Eligible audience, period and base | Source |
|---|---|---|---|
| All adults | 0.04 hours/day | Adults age 18+ living in households with children under 18, including adults who did none of the activity on the diary day — All adults 2025 annual estimates; diary dates September 30–November 11 unavailable because of federal shutdown · United States · Exact valid item/subgroup n unavailable | Original source [S03] Table 9, households with children under 18, Reading to or with children, total-average-day columns |
| Men | 0.02 hours/day | Adults age 18+ living in households with children under 18, including adults who did none of the activity on the diary day — Men 2025 annual estimates; diary dates September 30–November 11 unavailable because of federal shutdown · United States · Exact valid item/subgroup n unavailable | Original source [S03] Table 9, households with children under 18, Reading to or with children, total-average-day columns |
| Women | 0.05 hours/day | Adults age 18+ living in households with children under 18, including adults who did none of the activity on the diary day — Women 2025 annual estimates; diary dates September 30–November 11 unavailable because of federal shutdown · United States · Exact valid item/subgroup n unavailable | Original source [S03] Table 9, households with children under 18, Reading to or with children, total-average-day columns |
F11 2025 ATUS Table 9 under-18-household block, average day; source all/men/women columns. Population-average primary activity hours per day, adults 18+ in households with a child under 18. Includes adults doing none that day; not parents-only or activity-participant time. Decimal hours, not clock minutes. 2025 shutdown caveat applies.
| Measure / group | Published result | Eligible audience, period and base | Source |
|---|---|---|---|
| All adults | 0.05 hours/day | Adults age 18+ living in households with children under 18, including adults who did none of the activity on the diary day — All adults 2025 annual estimates; diary dates September 30–November 11 unavailable because of federal shutdown · United States · Exact valid item/subgroup n unavailable | Original source [S03] Table 9, households with children under 18, Talking to or with children, total-average-day columns |
| Men | 0.04 hours/day | Adults age 18+ living in households with children under 18, including adults who did none of the activity on the diary day — Men 2025 annual estimates; diary dates September 30–November 11 unavailable because of federal shutdown · United States · Exact valid item/subgroup n unavailable | Original source [S03] Table 9, households with children under 18, Talking to or with children, total-average-day columns |
| Women | 0.06 hours/day | Adults age 18+ living in households with children under 18, including adults who did none of the activity on the diary day — Women 2025 annual estimates; diary dates September 30–November 11 unavailable because of federal shutdown · United States · Exact valid item/subgroup n unavailable | Original source [S03] Table 9, households with children under 18, Talking to or with children, total-average-day columns |
F12 2025 ATUS Table 9 under-18-household block, average day; source all/men/women columns. Population-average primary activity hours per day, adults 18+ in households with a child under 18. Includes adults doing none that day; not parents-only or activity-participant time. Decimal hours, not clock minutes. 2025 shutdown caveat applies.
| Measure / group | Published result | Eligible audience, period and base | Source |
|---|---|---|---|
| All adults | 0.26 hours/day | Adults age 18+ living in households with children under 18, including adults who did none of the activity on the diary day — All adults 2025 annual estimates; diary dates September 30–November 11 unavailable because of federal shutdown · United States · Exact valid item/subgroup n unavailable | Original source [S03] Table 9, households with children under 18, Playing or doing hobbies with children, total-average-day columns |
| Men | 0.24 hours/day | Adults age 18+ living in households with children under 18, including adults who did none of the activity on the diary day — Men 2025 annual estimates; diary dates September 30–November 11 unavailable because of federal shutdown · United States · Exact valid item/subgroup n unavailable | Original source [S03] Table 9, households with children under 18, Playing or doing hobbies with children, total-average-day columns |
| Women | 0.29 hours/day | Adults age 18+ living in households with children under 18, including adults who did none of the activity on the diary day — Women 2025 annual estimates; diary dates September 30–November 11 unavailable because of federal shutdown · United States · Exact valid item/subgroup n unavailable | Original source [S03] Table 9, households with children under 18, Playing or doing hobbies with children, total-average-day columns |
F13 2025 ATUS Table 9 under-18-household block, average day; source all/men/women columns. Population-average primary activity hours per day, adults 18+ in households with a child under 18. Includes adults doing none that day; not parents-only or activity-participant time. Decimal hours, not clock minutes. 2025 shutdown caveat applies.
| Measure / group | Published result | Eligible audience, period and base | Source |
|---|---|---|---|
| All adults | 0.05 hours/day | Adults age 18+ living in households with children under 18, including adults who did none of the activity on the diary day — All adults 2025 annual estimates; diary dates September 30–November 11 unavailable because of federal shutdown · United States · Exact valid item/subgroup n unavailable | Original source [S03] Table 9, households with children under 18, Attending children’s events, total-average-day columns |
| Men | 0.05 hours/day | Adults age 18+ living in households with children under 18, including adults who did none of the activity on the diary day — Men 2025 annual estimates; diary dates September 30–November 11 unavailable because of federal shutdown · United States · Exact valid item/subgroup n unavailable | Original source [S03] Table 9, households with children under 18, Attending children’s events, total-average-day columns |
| Women | 0.06 hours/day | Adults age 18+ living in households with children under 18, including adults who did none of the activity on the diary day — Women 2025 annual estimates; diary dates September 30–November 11 unavailable because of federal shutdown · United States · Exact valid item/subgroup n unavailable | Original source [S03] Table 9, households with children under 18, Attending children’s events, total-average-day columns |
F14 Same four primary activities, all-adult weekday and weekend/holiday columns. Compare day types within an activity. Population-average primary activity hours per day, adults 18+ in households with a child under 18. Includes adults doing none that day; not parents-only or activity-participant time. Decimal hours, not clock minutes. 2025 shutdown caveat applies.
| Measure / group | Published result | Eligible audience, period and base | Source |
|---|---|---|---|
| Reading to or with children — weekdays | 0.04 hours/day | Adults age 18+ living in households with children under 18, including adults who did none of the activity on the diary day 2025 annual estimates; diary dates September 30–November 11 unavailable because of federal shutdown · United States · Exact valid item/subgroup n unavailable | Original source [S03] Table 9, households with children under 18, all-adult weekday/weekend columns |
| Reading to or with children — weekends and holidays | 0.03 hours/day | Adults age 18+ living in households with children under 18, including adults who did none of the activity on the diary day 2025 annual estimates; diary dates September 30–November 11 unavailable because of federal shutdown · United States · Exact valid item/subgroup n unavailable | Original source [S03] Table 9, households with children under 18, all-adult weekday/weekend columns |
| Talking to or with children — weekdays | 0.05 hours/day | Adults age 18+ living in households with children under 18, including adults who did none of the activity on the diary day 2025 annual estimates; diary dates September 30–November 11 unavailable because of federal shutdown · United States · Exact valid item/subgroup n unavailable | Original source [S03] Table 9, households with children under 18, all-adult weekday/weekend columns |
| Talking to or with children — weekends and holidays | 0.04 hours/day | Adults age 18+ living in households with children under 18, including adults who did none of the activity on the diary day 2025 annual estimates; diary dates September 30–November 11 unavailable because of federal shutdown · United States · Exact valid item/subgroup n unavailable | Original source [S03] Table 9, households with children under 18, all-adult weekday/weekend columns |
| Playing or doing hobbies with children — weekdays | 0.24 hours/day | Adults age 18+ living in households with children under 18, including adults who did none of the activity on the diary day 2025 annual estimates; diary dates September 30–November 11 unavailable because of federal shutdown · United States · Exact valid item/subgroup n unavailable | Original source [S03] Table 9, households with children under 18, all-adult weekday/weekend columns |
| Playing or doing hobbies with children — weekends and holidays | 0.33 hours/day | Adults age 18+ living in households with children under 18, including adults who did none of the activity on the diary day 2025 annual estimates; diary dates September 30–November 11 unavailable because of federal shutdown · United States · Exact valid item/subgroup n unavailable | Original source [S03] Table 9, households with children under 18, all-adult weekday/weekend columns |
| Attending children’s events — weekdays | 0.04 hours/day | Adults age 18+ living in households with children under 18, including adults who did none of the activity on the diary day 2025 annual estimates; diary dates September 30–November 11 unavailable because of federal shutdown · United States · Exact valid item/subgroup n unavailable | Original source [S03] Table 9, households with children under 18, all-adult weekday/weekend columns |
| Attending children’s events — weekends and holidays | 0.08 hours/day | Adults age 18+ living in households with children under 18, including adults who did none of the activity on the diary day 2025 annual estimates; diary dates September 30–November 11 unavailable because of federal shutdown · United States · Exact valid item/subgroup n unavailable | Original source [S03] Table 9, households with children under 18, all-adult weekday/weekend columns |
Read decimal hours carefully: 0.26 hours is a fraction of an hour, not 26 minutes. The table retains the original two-decimal-hour values. Primary childcare is a main activity and does not capture all the time an adult and child share a location or all simultaneous supervision.
BLS’s 2025 release also carries a coverage qualification. Federal shutdown conditions suspended interviews from October 1 through November 12, leaving no diaries for September 30 through November 11. Fourth-quarter estimates reweight the remaining diary dates to represent the whole quarter. BLS says the effect on estimates cannot be quantified. This resource retains that limitation rather than treating 2025 as an ordinary complete diary year.
What does Canadian telework research show?
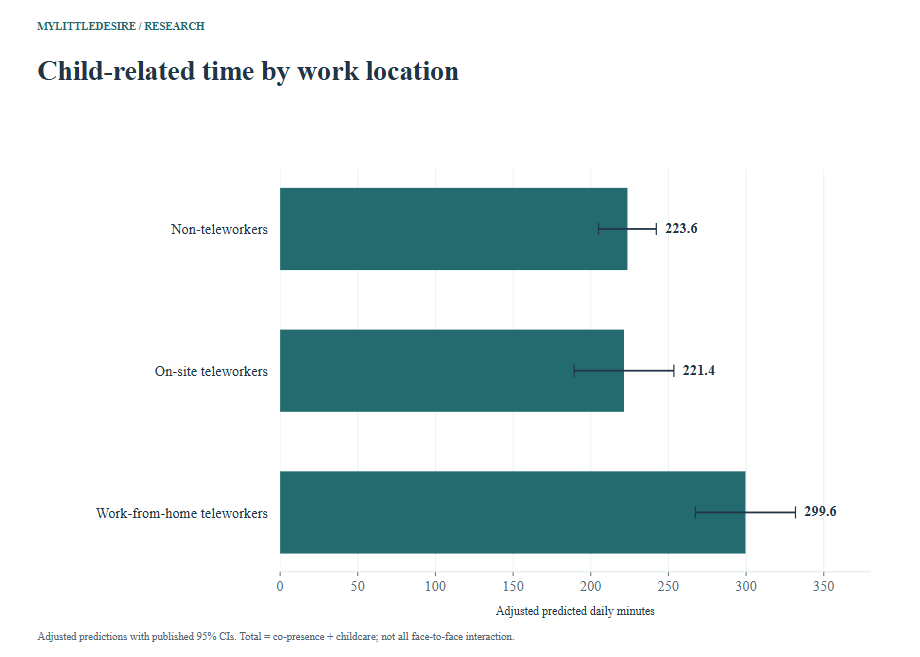
Statistics Canada’s 2022 Time Use Survey was collected from July 2022 to July 2023. Its telework analysis selects employees whose main activity in the preceding week was paid work and uses eligible paid-work diary days. The parent analysis requires an own household child under 18 and excludes self-employed workers. Table 1 Panel A reports adjusted predicted minutes, with published 95% confidence intervals. Statistics Canada [S04].
| Group | Previous week | Paid work on diary day |
|---|---|---|
| Non-teleworkers | No teleworking reported | Workplace or business travel |
| On-site teleworkers | Teleworked during preceding week | On-site |
| Work-from-home teleworkers | Teleworked during preceding week | At home |
F15 2022 Time Use Survey Table 1 Panel A. Sum of co-present time and primary childcare; not an additional third component. Adjusted predicted minutes, not raw means or a causal telework effect. Employee parents on paid-work diary days. Published 95% CIs refer to each mean, not to calculated differences. Selected valid model/subgroup n unavailable.
| Measure / group | Published result | Eligible audience, period and base | Source |
|---|---|---|---|
| Non-teleworkers | 223.6 minutes/day Published 95% CI: 205.0–242.2 minutes/day | Employee parents with an own household child under 18, paid work as main activity in the previous week and eligible paid-work diary day; self-employed excluded — Non-teleworkers 2022 Time Use Survey, collected July 2022–July 2023 · Canada, ten provinces · Exact valid item/subgroup n unavailable | Original source [S04] Table 1 Panel A, Total child-related time, predicted daily minutes and 95% CI columns |
| On-site teleworkers | 221.4 minutes/day Published 95% CI: 189.3–253.5 minutes/day | Employee parents with an own household child under 18, paid work as main activity in the previous week and eligible paid-work diary day; self-employed excluded — On-site teleworkers 2022 Time Use Survey, collected July 2022–July 2023 · Canada, ten provinces · Exact valid item/subgroup n unavailable | Original source [S04] Table 1 Panel A, Total child-related time, predicted daily minutes and 95% CI columns |
| Work-from-home teleworkers | 299.6 minutes/day Published 95% CI: 267.4–331.8 minutes/day | Employee parents with an own household child under 18, paid work as main activity in the previous week and eligible paid-work diary day; self-employed excluded — Work-from-home teleworkers 2022 Time Use Survey, collected July 2022–July 2023 · Canada, ten provinces · Exact valid item/subgroup n unavailable | Original source [S04] Table 1 Panel A, Total child-related time, predicted daily minutes and 95% CI columns |
F16 2022 Time Use Survey Table 1 Panel A. With household children of any age, excluding sleep, personal care and childcare. Adjusted predicted minutes, not raw means or a causal telework effect. Employee parents on paid-work diary days. Published 95% CIs refer to each mean, not to calculated differences. Selected valid model/subgroup n unavailable.
| Measure / group | Published result | Eligible audience, period and base | Source |
|---|---|---|---|
| Non-teleworkers | 150.6 minutes/day Published 95% CI: 133.7–167.5 minutes/day | Employee parents with an own household child under 18, paid work as main activity in the previous week and eligible paid-work diary day; self-employed excluded — Non-teleworkers 2022 Time Use Survey, collected July 2022–July 2023 · Canada, ten provinces · Exact valid item/subgroup n unavailable | Original source [S04] Table 1 Panel A, Co-present time, predicted daily minutes and 95% CI columns |
| On-site teleworkers | 136.4 minutes/day Published 95% CI: 108.8–164.0 minutes/day | Employee parents with an own household child under 18, paid work as main activity in the previous week and eligible paid-work diary day; self-employed excluded — On-site teleworkers 2022 Time Use Survey, collected July 2022–July 2023 · Canada, ten provinces · Exact valid item/subgroup n unavailable | Original source [S04] Table 1 Panel A, Co-present time, predicted daily minutes and 95% CI columns |
| Work-from-home teleworkers | 192.0 minutes/day Published 95% CI: 165.5–218.6 minutes/day | Employee parents with an own household child under 18, paid work as main activity in the previous week and eligible paid-work diary day; self-employed excluded — Work-from-home teleworkers 2022 Time Use Survey, collected July 2022–July 2023 · Canada, ten provinces · Exact valid item/subgroup n unavailable | Original source [S04] Table 1 Panel A, Co-present time, predicted daily minutes and 95% CI columns |
F17 2022 Time Use Survey Table 1 Panel A. Primary childcare excluding travel, whether or not children were present. Adjusted predicted minutes, not raw means or a causal telework effect. Employee parents on paid-work diary days. Published 95% CIs refer to each mean, not to calculated differences. Selected valid model/subgroup n unavailable.
| Measure / group | Published result | Eligible audience, period and base | Source |
|---|---|---|---|
| Non-teleworkers | 73.0 minutes/day Published 95% CI: 62.6–83.4 minutes/day | Employee parents with an own household child under 18, paid work as main activity in the previous week and eligible paid-work diary day; self-employed excluded — Non-teleworkers 2022 Time Use Survey, collected July 2022–July 2023 · Canada, ten provinces · Exact valid item/subgroup n unavailable | Original source [S04] Table 1 Panel A, Primary childcare time, predicted daily minutes and 95% CI columns |
| On-site teleworkers | 85.0 minutes/day Published 95% CI: 72.4–97.6 minutes/day | Employee parents with an own household child under 18, paid work as main activity in the previous week and eligible paid-work diary day; self-employed excluded — On-site teleworkers 2022 Time Use Survey, collected July 2022–July 2023 · Canada, ten provinces · Exact valid item/subgroup n unavailable | Original source [S04] Table 1 Panel A, Primary childcare time, predicted daily minutes and 95% CI columns |
| Work-from-home teleworkers | 107.6 minutes/day Published 95% CI: 91.4–123.8 minutes/day | Employee parents with an own household child under 18, paid work as main activity in the previous week and eligible paid-work diary day; self-employed excluded — Work-from-home teleworkers 2022 Time Use Survey, collected July 2022–July 2023 · Canada, ten provinces · Exact valid item/subgroup n unavailable | Original source [S04] Table 1 Panel A, Primary childcare time, predicted daily minutes and 95% CI columns |
The adjusted total for work-from-home teleworkers exceeds that for non-teleworkers by 76.0 minutes per day, using the exact Table 1 values. This is descriptive arithmetic between model predictions. It is not evidence that switching an individual to home working would cause that increase. The intervals shown belong to individual means; we do not derive an interval or significance test for the difference.
“Total” needs special care here. Co-presence excludes sleep, personal care and childcare. Childcare is a primary activity excluding travel and can be recorded even when the child is absent. Total adds these two components, so it should not be described as exclusively face-to-face interaction or added to the components again. No unadjusted appendix averages are mixed into these adjusted results.
What did Australian family activities look like in 2004?
Historical evidence: 2004 fieldwork, published May 4, 2007. The following LSAC findings concern children age 4–5 at the time. They provide a dated example of activity-frequency measurement, not a current Australian benchmark or a 2027 outcome.
F18 Read to by any family member during the previous week. Historical 2004 LSAC Wave 1 evidence, children age 4–5; published 2007. Reported by parent over a week. Not a current Australian or 2027 rate; selected valid n unavailable. 6 or 7 days is not exactly every day.
| Measure / group | Published result | Eligible audience, period and base | Source |
|---|---|---|---|
| 6 or 7 days | 45% | Children age 4–5 in the 2004 LSAC cohort; activities with any family member reported over one week 2004, Growing Up in Australia / LSAC Wave 1; historical evidence · Australia · Exact valid item/subgroup n unavailable | Original source [S05] Children and family time, reading frequency paragraph |
| 3 to 5 days | 30% | Children age 4–5 in the 2004 LSAC cohort; activities with any family member reported over one week 2004, Growing Up in Australia / LSAC Wave 1; historical evidence · Australia · Exact valid item/subgroup n unavailable | Original source [S05] Children and family time, reading frequency paragraph |
| 1 or 2 days | 21% | Children age 4–5 in the 2004 LSAC cohort; activities with any family member reported over one week 2004, Growing Up in Australia / LSAC Wave 1; historical evidence · Australia · Exact valid item/subgroup n unavailable | Original source [S05] Children and family time, reading frequency paragraph |
| Not at all | 4% | Children age 4–5 in the 2004 LSAC cohort; activities with any family member reported over one week 2004, Growing Up in Australia / LSAC Wave 1; historical evidence · Australia · Exact valid item/subgroup n unavailable | Original source [S05] Children and family time, reading frequency paragraph |
F19 Participated with a family member over one week. Historical 2004 LSAC Wave 1 evidence, children age 4–5; published 2007. Reported by parent over a week. Not a current Australian or 2027 rate; selected valid n unavailable. Different activities can overlap; no exclusive distribution.
| Measure / group | Published result | Eligible audience, period and base | Source |
|---|---|---|---|
| Music or dance with a family member | 90% | Children age 4–5 in the 2004 LSAC cohort; activities with any family member reported over one week 2004, Growing Up in Australia / LSAC Wave 1; historical evidence · Australia · Exact valid item/subgroup n unavailable | Original source [S05] Children and family time, three activity bullets |
| Everyday activities such as cooking or pet care with family | 89% | Children age 4–5 in the 2004 LSAC cohort; activities with any family member reported over one week 2004, Growing Up in Australia / LSAC Wave 1; historical evidence · Australia · Exact valid item/subgroup n unavailable | Original source [S05] Children and family time, three activity bullets |
| Outdoor games or exercise with a family member | 89% | Children age 4–5 in the 2004 LSAC cohort; activities with any family member reported over one week 2004, Growing Up in Australia / LSAC Wave 1; historical evidence · Australia · Exact valid item/subgroup n unavailable | Original source [S05] Children and family time, three activity bullets |
F20 Read to by any family member on 6 or 7 days a week, by mother’s paid-work hours. Historical 2004 LSAC Wave 1 evidence, children age 4–5; published 2007. Reported by parent over a week. Not a current Australian or 2027 rate; selected valid n unavailable. Observational maternal employment groups, not an employment effect. Adjacent prose says every day, but preceding 6-or-7-days definition retained. Reader need not be mother.
| Measure / group | Published result | Eligible audience, period and base | Source |
|---|---|---|---|
| Mother not employed | 42% | Children age 4–5 in the 2004 LSAC cohort; activities with any family member reported over one week 2004, Growing Up in Australia / LSAC Wave 1; historical evidence · Australia · Exact valid item/subgroup n unavailable | Original source [S05] Children and family time, maternal-employment reading bullets |
| Mother worked 1–24 hours/week | 50% | Children age 4–5 in the 2004 LSAC cohort; activities with any family member reported over one week 2004, Growing Up in Australia / LSAC Wave 1; historical evidence · Australia · Exact valid item/subgroup n unavailable | Original source [S05] Children and family time, maternal-employment reading bullets |
| Mother worked 25–34 hours/week | 47% | Children age 4–5 in the 2004 LSAC cohort; activities with any family member reported over one week 2004, Growing Up in Australia / LSAC Wave 1; historical evidence · Australia · Exact valid item/subgroup n unavailable | Original source [S05] Children and family time, maternal-employment reading bullets |
| Mother worked 35+ hours/week | 42% | Children age 4–5 in the 2004 LSAC cohort; activities with any family member reported over one week 2004, Growing Up in Australia / LSAC Wave 1; historical evidence · Australia · Exact valid item/subgroup n unavailable | Original source [S05] Children and family time, maternal-employment reading bullets |
The reading category is “6 or 7 days,” even though an adjacent source sentence uses “every day” as shorthand. Reading could be provided by any family member, not necessarily the mother. The maternal employment categories describe observational groups; they do not establish that changing a mother’s work hours would change a child’s reading opportunities. The snapshot draws on several datasets, but only its selected 2004 LSAC family-activity figures enter this database. Australian Institute of Family Studies [S05].
How can readers use this evidence?
For a story about priorities, use the importance question. For a story about parents’ perceived time pressure, use the time-adequacy question. For a story about recorded activities, specify the diary activity, eligible household population and population-average denominator. Describe the Canadian findings as adjusted predictions and preserve their work-day and employee restrictions.
For family discussions, these findings can prompt specific questions: which activities matter to each person, when work enters shared time, and whether everyone feels they get enough contact. These are conversation prompts, not tested interventions or a research-derived daily target. Contact across adult generations needs different measures; see our parent–adult child relationship statistics.
Ten reproducible descriptive comparisons
The workbook subtracts compatible source values using stable observation IDs. Percent differences are percentage points; diary-hour and minute differences retain their input units. Results are descriptive arithmetic from rounded published values, without new significance tests or difference confidence intervals.
| ID | Comparison | First | Second | Difference | Qualification |
|---|---|---|---|---|---|
| C01 | Major reason: work minus other family/household obligations | 65% | 25% | +40 percentage points | Independently rated reasons among the same conditional group; not an exclusive share. Rounded published inputs; no new significance test. |
| C02 | Work tasks with children: mothers minus fathers | 63% | 57% | +6 percentage points | Same at-least-sometimes response among full-time workers; unpaired groups. Rounded published inputs; no new significance test. |
| C03 | Extremely/very upset: mothers minus fathers | 65% | 45% | +20 percentage points | Conditional on full-time parents missing activities due to work at least sometimes; not all parents. Rounded published inputs; no new significance test. |
| C04 | Playing/hobbies: weekends minus weekdays | 0.33 hours/day | 0.24 hours/day | +0.09 hours/day | Population-average primary activity hours; weekends include holidays. Rounded published inputs; no new significance test. |
| C05 | Playing/hobbies: women minus men | 0.29 hours/day | 0.24 hours/day | +0.05 hours/day | All-day household-adult averages, not parents-only or paired couples. Rounded published inputs; no new significance test. |
| C06 | Reading: women minus men | 0.05 hours/day | 0.02 hours/day | +0.03 hours/day | Population-average primary activity, not duration among readers. Rounded published inputs; no new significance test. |
| C07 | Canada adjusted total: WFH minus non-teleworker | 299.6 minutes/day | 223.6 minutes/day | +76 minutes/day | Adjusted point estimates; no causal effect or difference CI derived. Rounded published inputs; no new significance test. |
| C08 | Canada adjusted co-presence: WFH minus non-teleworker | 192.0 minutes/day | 150.6 minutes/day | +41.4 minutes/day | Excludes sleep, personal care and childcare; descriptive adjusted comparison. Rounded published inputs; no new significance test. |
| C09 | Canada adjusted childcare: WFH minus non-teleworker | 107.6 minutes/day | 73.0 minutes/day | +34.6 minutes/day | Primary childcare can occur without child present; no causal inference. Rounded published inputs; no new significance test. |
| C10 | 2004 reading 6–7 days: maternal work 1–24h minus not employed | 50% | 42% | +8 percentage points | Historical observational groups; reading by any family member, not an employment effect. Rounded published inputs; no new significance test. |
Common questions
How many hours do families spend together each day?
These sources do not establish one interchangeable daily total. US primary-childcare averages, Canadian adjusted employee-parent predictions and subjective parent responses measure different things. Keep the activity, population and period with each estimate.
Do most adults consider family time important?
In Pew’s March–April 2023 US adult survey, 73% called spending time with family one of the most important things to them. This measures a personal priority regardless of actual time spent.
What percentage of working parents want more time with children?
In March 2026, 56% of US parents employed full or part time said they spent too little time with their children. The full-time subset figure was 60%; these are different bases.
Is being together the same as quality time?
No quality-time duration is established here. Co-presence, primary childcare and importance ratings do not by themselves measure attention, warmth or enjoyment.
Does working from home cause more family time?
The selected Canadian analysis reports adjusted cross-sectional predictions. Its 76.0-minute total difference between WFH teleworkers and non-teleworkers is descriptive and does not establish a causal effect.
Are the Australian percentages current?
No. The selected activity figures concern 4–5-year-old children in 2004 LSAC fieldwork, published in a 2007 snapshot. They are clearly labelled historical.
Is there an ideal number of family hours supported by these data?
These selected descriptive sources do not test or establish an ideal daily amount. A numeric recommendation would go beyond the evidence.
Research method and limitations
Selection and concentration. We selected original publisher surveys, diary tables and analyses with explicit family-time, child-time or shared-family-activity measures. The database has 65 observations in 20 groups from five numerical source records and four publisher labels. Contributions: Pew 2023 four, Pew 2026 twenty-one, BLS twenty, Statistics Canada nine and AIFS eleven. Pew contributes 25 across two surveys. Related categories and subgroup cells are not independent studies; charts and comparisons reuse inputs. MyLittleDesire conducted no new survey.
Verification. Original Pew 2023 question wording, topline and methods were checked. The Pew 2026 overview, report, questionnaire, topline and methodology were checked; report physical pages 6–7 were rendered and visually inspected to confirm full-time cuts and the conditional upset distribution. BLS Table 9 and release/technical notes, Statistics Canada Table 1 Panel A and methods/definitions, and the AIFS snapshot and data-source note were checked. Published aggregates were verified; confidential respondent records were not independently audited.
Bases and uncertainty. Four reason items have an explicit routed question base of 1,264. The other 61 selected valid item/subgroup bases remain blank, as do all weighted item bases. Full study samples are separately labelled; BLS’s approximate full sample and the unavailable selected AIFS cohort n are not invented as exact counts. The nine Canadian means retain their original 95% confidence intervals. No full-sample error margin is assigned to a subgroup, and no counts are reconstructed from weighted percentages.
Measure limits. Importance, perceived adequacy, reasons, frequency of work tasks, conditional upset, primary activities and adjusted predictions remain distinct. Independently rated reasons and shared activities can overlap. Rounded category totals are not forced to 100. Decimal hours are not minutes. Childcare and co-presence do not automatically mean focused interaction, and the Canadian total already includes its two components. US adult household averages are not parent-only or participant-only duration estimates.
Coverage and dating. US 2025 diary coverage is affected by missing shutdown dates and Q4 reweighting. Canadian 2022 survey collection spans July 2022–July 2023; adjusted parent estimates differ from full-survey and unadjusted means. Historical LSAC fieldwork is 2004, despite a 2007 publication date. The 2027 edition label is editorial. There is no country ranking, pooled average, causal work-arrangement effect, new significance test, recommended daily threshold or measured future outcome.
Updating. Recheck original wording, population, routing, units, sampling and dates before replacing a value. Preserve historical findings only where useful and label them clearly. Change the review date after a substantive source review; retain the evergreen article URL.
Original sources and supporting records
- Pew Research Center. Family time is far more important than other aspects of life for most Americans [S01]
Published: May 26, 2023. Actual period: March 27–April 2, 2023.
Population: US adults age 18+.
Study / analytic sample: 5,079. Full American Trends Panel sample n=5,079; selected valid item n not separately established.
Item bases: IMP_PER item e asked of all adults; full study n is not substituted for valid response n. Weighted item base unavailable.
Method: Weighted American Trends Panel probability survey. Original article, topline IMP_PER item e and linked methodology checked. Question explicitly asks importance regardless of how much time respondents actually spend doing the activity.
Limits: Four published importance categories retained; no-answer below 0.5% is not a numeric zero. Attitude, not hours, satisfaction, family structure or actual frequency. No 2021 trend selected. Rounded article phrase nine-in-ten is not a separately counted 90% observation.
Supporting record 1 · Supporting record 2 - Pew Research Center. For Working Parents, the Boundary Between Work and Family Is Often Blurred [S02]
Published: June 16, 2026. Actual period: March 2–15, 2026.
Population: US working parents or guardians of at least one child under 18; full-time or conditional subsets specified per finding.
Study / analytic sample: 2,242. Full sample n=2,242: 1,900 ATP and 342 SSRS Opinion Panel respondents; not every full-time or routed item base.
Item bases: TIMCHLDMOD explicitly routed to working parents reporting too little time, n=1,264, retained for four reason items. Other selected item/subgroup bases unavailable. Broader MISSKIDACT2 n=986 is not the full-time conditional base.
Method: Probability-recruited ATP with SSRS Opinion Panel oversamples; weighted to target US working parents. Original overview, methods, topline and questionnaire checked. Report physical pages 6–7 (printed 5–6) rendered and visually checked for full-time interruption and upset figures.
Limits: All employed parents and full-time employed parents are different bases. Reasons independently rated; do not sum them. Upset responses conditional on full-time parents missing child activities due to work at least sometimes during the past 12 months. Rounding produces 99 or 101 totals. Self-reports do not measure observed quality or causal employment effects. Full-sample margin not assigned to subgroups.
Supporting record 1 · Supporting record 2 · Supporting record 3 · Supporting record 4 - US Bureau of Labor Statistics. American Time Use Survey 2025, Table 9: primary childcare activities [S03]
Published: June 25, 2026 release / table update. Actual period: 2025 annual estimates; diary dates September 30–November 11 unavailable because of federal shutdown.
Population: Adults age 18+ living in households with children under 18, including adults who did none of the activity on the diary day.
Study / analytic sample: Exact full/analytic n not established here. Approximately 6,100 interviewed in full 2025 ATUS; exact selected Table 9 adult/item n unavailable.
Item bases: Table 9 population averages, not activity-participant means and not parents only. Valid selected item/group n and weighted bases unavailable.
Method: National probability sample selected from households completing the Current Population Survey; one retrospective 24-hour diary. Selected Table 9 under-18-household block: four interactive primary childcare activities, overall/men/women and overall weekday/weekend columns. Release and technical note checked.
Limits: Decimal hours per average day, not clock notation or minutes. Primary activity only, not all co-presence, secondary childcare or uninterrupted quality time. Gender groups reflect source labels, not paired couples. Weekend includes holidays. Shutdown suspended interviews October 1–November 12, 2025; Q4 reweighting represents missing dates, and BLS says its effect cannot be quantified. No new uncertainty tests or cross-country comparison.
Supporting record 1 · Supporting record 2 - Statistics Canada. Telework, time use, and well-being — Table 1 Panel A [S04]
Published: June 5, 2024. Actual period: 2022 Time Use Survey, collected July 2022–July 2023.
Population: Employee parents with an own household child under 18, paid work as main activity in the previous week and eligible paid-work diary day; self-employed excluded.
Study / analytic sample: 12,336. Full Time Use Survey n=12,336; selected parent-model and telework-group valid n not separately established.
Item bases: Full survey sample is not the selected employee-parent analytic or valid subgroup n. All nine selected estimate bases remain blank. Published 95% confidence intervals retained separately.
Method: Cross-sectional time diary survey of noninstitutionalized people 15+ in ten provinces, excluding reserve residents. Table 1 Panel A reports adjusted predicted daily minutes from OLS models. Models control diary, demographic and job factors, with youngest-child age in parent analyses. Original HTML table, notes and methods checked.
Limits: Adjusted predictions, not raw means or causal effects. Three categories combine last-week teleworking and diary-day work location. Co-presence excludes sleep, personal care and childcare; childcare is primary activity excluding travel and can be recorded without a child present. Total sums these two components, not pure face-to-face time. Published mean intervals are not intervals for a difference. Gender panels flagged E omitted; no unadjusted Appendix A2 values mixed in. - Australian Institute of Family Studies. A snapshot of how Australian Families spend their time — children and family time [S05]
Published: May 4, 2007. Actual period: 2004, Growing Up in Australia / LSAC Wave 1; historical evidence.
Population: Children age 4–5 in the 2004 LSAC cohort; activities with any family member reported over one week.
Study / analytic sample: Exact full/analytic n not established here. Exact achieved cohort/item/subgroup sample n not established beside selected snapshot percentages; left blank.
Item bases: Selected valid child/activity and maternal-employment subgroup n and weighted bases unavailable. No invented full sample or current Australian denominator.
Method: Original AIFS research snapshot and its LSAC data-source note checked. Selected observations concern 4–5-year-old children in 2004 and parent-reported family activities over a week. Snapshot also uses HILDA and 1997 ABS evidence, none selected into this database.
Limits: Historical 2004 findings, not modern or 2027 prevalence. Reading frequency 6 or 7 days is not exactly seven; adjacent prose says every day but original category retained. Reading may be by any family member, not necessarily the mother. Maternal work-hour categories are observational and do not establish employment effects or equal opportunities. Activities can overlap.
How to cite this resource
MyLittleDesire. Family Time And Togetherness Statistics 2027. https://mylittledesire.com/family-time-togetherness-statistics/.