
Moving can change access to friends, family and practical support. This resource examines reported friendship experiences, personal support networks, recalled loneliness and the wider adjustment context around relocation.
What are the key relocation and social connection statistics?
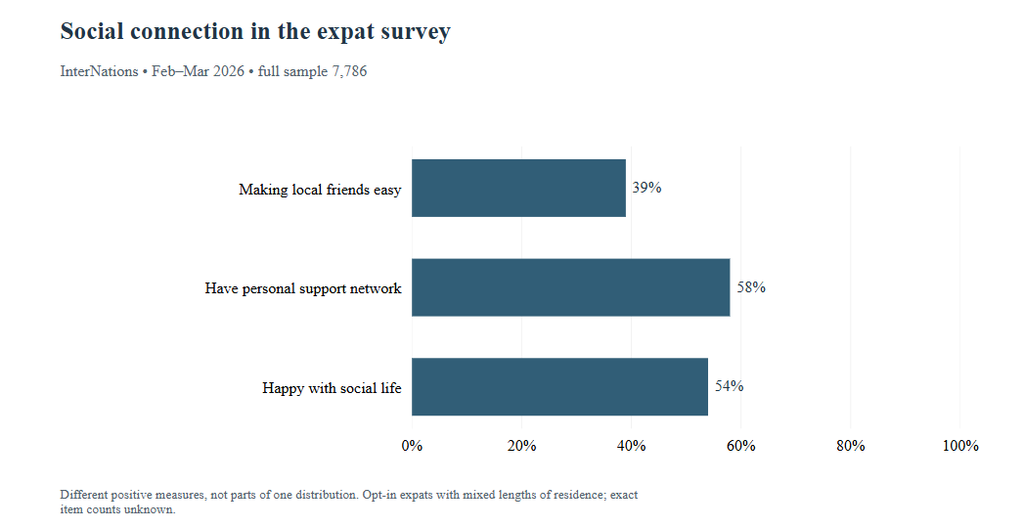
- 39% of the 2026 InterNations expat sample found making local friends easy. Population, date and original source.
- 40% found it difficult in the same opt-in collection. Population, date and original source.
- 58% said they had a personal support network. Population, date and original source.
- 54% were happy with their social life. Population, date and original source.
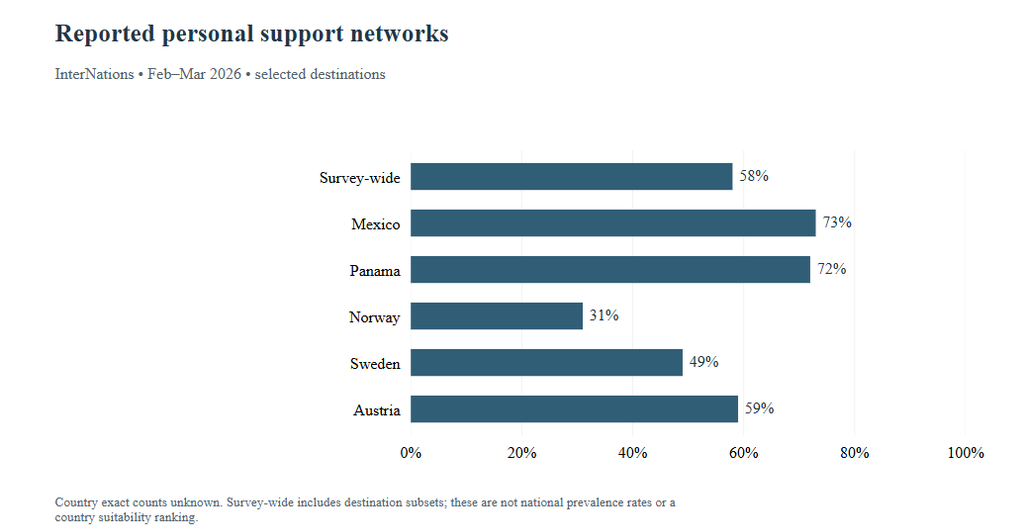
- 73% of its Mexico respondents reported a personal support network; selected count unknown. Population, date and original source.
- 48% of its Canada respondents reported a personal support network; selected count unknown. Population, date and original source.
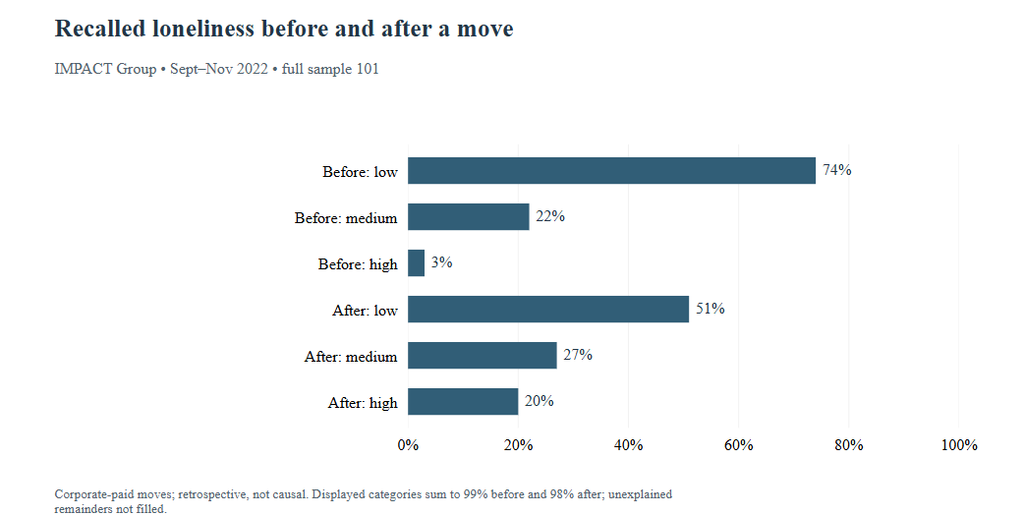
- 20% of IMPACT respondents recalled high loneliness after a company-paid move, versus 3% before. Population, date and original source.
- 67% of its small solo-mover subgroup reported medium/high loneliness; exact selected count unknown. Population, date and original source.
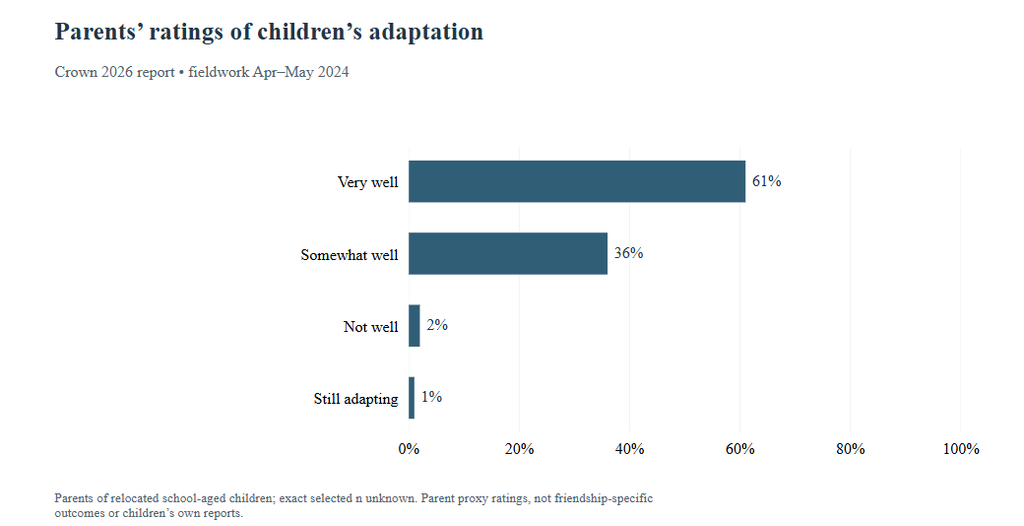
- 61% of the selected Crown parents rated children’s adaptation very well, in 2024 fieldwork. Population, date and original source.
- 41% of the recent U.S. movers in the PODS survey said proximity to family, friends or support systems influenced the move. Population, date and original source.
What do relocation connection statistics measure?
| Measure | Meaning |
|---|---|
| Local friendship | Reported ease or difficulty making friends among local residents. |
| Personal support network | The respondent’s perception of a network in the host country, not a verified network size. |
| Social satisfaction | A rating of social life, distinct from contact frequency or loneliness. |
| Loneliness | Reported feelings in the source’s question; not a clinical diagnosis. |
| Adaptation context | Cultural, family and workplace experiences surrounding a move. |
| Moving priorities | Motivation or hypothetical choices, not outcomes after relocation. |
How do expats experience friendship after relocation?
The 2026 InterNations survey distinguishes ease of making local friends from having a network and feeling satisfied socially. It includes expats with varied lengths of residence, so these figures are not a first-year adjustment curve. Destination results describe selected respondents, with exact selected counts unavailable.
What do expats report about friends and support?
Survey-wide figures are not global population estimates. These are different measures, not parts of one distribution.
| Finding / scope | Percent | Population, period and base | Original source |
|---|---|---|---|
| F01 Making local friends is easy Social experience | 39% | InterNations 2026 opt-in expat respondents worldwide February 1–March 31, 2026 Exact selected n unavailable | S01 Ease of Settling In: Mexico and Norway sections |
| F02 Making local friends is difficult Social experience | 40% | InterNations 2026 opt-in expat respondents worldwide February 1–March 31, 2026 Exact selected n unavailable | S01 Ease of Settling In: Mexico and Norway sections |
| F03 Have a personal support network Social experience | 58% | InterNations 2026 opt-in expat respondents worldwide February 1–March 31, 2026 Exact selected n unavailable | S01 Ease of Settling In: Mexico and Norway sections |
| F04 Happy with social life Social experience | 54% | InterNations 2026 opt-in expat respondents worldwide February 1–March 31, 2026 Exact selected n unavailable | S01 Ease of Settling In: Mexico and Norway sections |
Where did selected respondents find local friendship easier?
Selected destination subsets, not national resident rates. Country differences may reflect who responded and their circumstances.
| Finding / scope | Percent | Population, period and base | Original source |
|---|---|---|---|
| F05 Mexico Social experience | 73% | InterNations 2026 opt-in expat respondents in Mexico February 1–March 31, 2026 Exact selected n unavailable | S01 Ease of Settling In: Mexico/Thailand; UK report: Finding Friends |
| F06 Thailand Social experience | 49% | InterNations 2026 opt-in expat respondents in Thailand February 1–March 31, 2026 Exact selected n unavailable | S01 Ease of Settling In: Mexico/Thailand; UK report: Finding Friends |
| F07 United Kingdom Social experience | 33% | InterNations 2026 opt-in expat respondents in United Kingdom February 1–March 31, 2026 Exact selected n unavailable | S01 Ease of Settling In: Mexico/Thailand; UK report: Finding Friends |
Where did respondents describe difficulty making local friends?
Norway very difficult is included in its difficult total. Do not add the two. Exact destination/item counts unavailable; selected countries are not a suitability ranking.
| Finding / scope | Percent | Population, period and base | Original source |
|---|---|---|---|
| F08 Norway: difficult Social experience | 72% | InterNations 2026 opt-in expat respondents in Norway February 1–March 31, 2026 Exact selected n unavailable | S01 Ease of Settling In: Norway/Sweden/Austria; UK report |
| F09 Norway: very difficult Social experience | 41% | InterNations 2026 opt-in expat respondents in Norway February 1–March 31, 2026 Exact selected n unavailable | S01 Ease of Settling In: Norway/Sweden/Austria; UK report |
| F10 Sweden: difficult Social experience | 70% | InterNations 2026 opt-in expat respondents in Sweden February 1–March 31, 2026 Exact selected n unavailable | S01 Ease of Settling In: Norway/Sweden/Austria; UK report |
| F11 Austria: difficult Social experience | 60% | InterNations 2026 opt-in expat respondents in Austria February 1–March 31, 2026 Exact selected n unavailable | S01 Ease of Settling In: Norway/Sweden/Austria; UK report |
| F12 United Kingdom: difficult Social experience | 46% | InterNations 2026 opt-in expat respondents in United Kingdom February 1–March 31, 2026 Exact selected n unavailable | S01 Ease of Settling In: Norway/Sweden/Austria; UK report |
Also Read:-
Grief And Support Network Statistics 2027
Social Anxiety And Making Friends Statistics 2027
Couples And Social Media Statistics 2027
Video Calling Family Connection Statistics 2027
AI Relationship Advice Statistics 2027
Do relocated expats have a support network?
Perceived personal support, social satisfaction and the composition of a friendship circle describe different things. A person can have a network mainly of other expats. These questions do not establish the number of close friends or the help available in a crisis.
How often did expats report a personal support network?
A perceived network is different from its size, depth or reliable help in a crisis. Selected country results share the same opt-in collection.
| Finding / scope | Percent | Population, period and base | Original source |
|---|---|---|---|
| F13 Mexico Social experience | 73% | InterNations 2026 opt-in expat respondents in Mexico February 1–March 31, 2026 Exact selected n unavailable | S01 Ease of Settling In country sections; Canada report: Finding Friends |
| F14 Panama Social experience | 72% | InterNations 2026 opt-in expat respondents in Panama February 1–March 31, 2026 Exact selected n unavailable | S01 Ease of Settling In country sections; Canada report: Finding Friends |
| F15 Norway Social experience | 31% | InterNations 2026 opt-in expat respondents in Norway February 1–March 31, 2026 Exact selected n unavailable | S01 Ease of Settling In country sections; Canada report: Finding Friends |
| F16 Sweden Social experience | 49% | InterNations 2026 opt-in expat respondents in Sweden February 1–March 31, 2026 Exact selected n unavailable | S01 Ease of Settling In country sections; Canada report: Finding Friends |
| F17 Austria Social experience | 59% | InterNations 2026 opt-in expat respondents in Austria February 1–March 31, 2026 Exact selected n unavailable | S01 Ease of Settling In country sections; Canada report: Finding Friends |
| F18 Canada Social experience | 48% | InterNations 2026 opt-in expat respondents in Canada February 1–March 31, 2026 Exact selected n unavailable | S01 Ease of Settling In country sections; Canada report: Finding Friends |
How satisfied were respondents with social life?
The Norway figure is unhappy, unlike the four happy ratings. It is not converted to a positive complement because neutral responses can exist.
| Finding / scope | Percent | Population, period and base | Original source |
|---|---|---|---|
| F19 Mexico: happy Social experience | 75% | InterNations 2026 opt-in expat respondents in Mexico February 1–March 31, 2026 Exact selected n unavailable | S01 Ease of Settling In: named destination sections |
| F20 Panama: happy Social experience | 73% | InterNations 2026 opt-in expat respondents in Panama February 1–March 31, 2026 Exact selected n unavailable | S01 Ease of Settling In: named destination sections |
| F21 Thailand: happy Social experience | 67% | InterNations 2026 opt-in expat respondents in Thailand February 1–March 31, 2026 Exact selected n unavailable | S01 Ease of Settling In: named destination sections |
| F22 Sweden: happy Social experience | 25% | InterNations 2026 opt-in expat respondents in Sweden February 1–March 31, 2026 Exact selected n unavailable | S01 Ease of Settling In: named destination sections |
| F23 Norway: unhappy Social experience | 56% | InterNations 2026 opt-in expat respondents in Norway February 1–March 31, 2026 Exact selected n unavailable | S01 Ease of Settling In: named destination sections |
Who makes up expats’ friendship circles?
Selected composition categories are not a complete distribution. Having expat friends does not imply poor-quality relationships or no local contact.
| Finding / scope | Percent | Population, period and base | Original source |
|---|---|---|---|
| F24 Worldwide sample: mostly locals Social experience | 17% | InterNations 2026 opt-in expat respondents worldwide February 1–March 31, 2026 Exact selected n unavailable | S01 Ease of Settling In: Mexico/Panama/Norway; UK report |
| F25 Mexico: mostly locals Social experience | 34% | InterNations 2026 opt-in expat respondents in Mexico February 1–March 31, 2026 Exact selected n unavailable | S01 Ease of Settling In: Mexico/Panama/Norway; UK report |
| F26 United Kingdom: mostly locals Social experience | 21% | InterNations 2026 opt-in expat respondents in the United Kingdom February 1–March 31, 2026 Exact selected n unavailable | S01 Ease of Settling In: Mexico/Panama/Norway; UK report |
| F27 Worldwide sample: mostly other expats Social experience | 37% | InterNations 2026 opt-in expat respondents worldwide February 1–March 31, 2026 Exact selected n unavailable | S01 Ease of Settling In: Mexico/Panama/Norway; UK report |
| F28 Panama: mostly other expats Social experience | 40% | InterNations 2026 opt-in expat respondents in Panama February 1–March 31, 2026 Exact selected n unavailable | S01 Ease of Settling In: Mexico/Panama/Norway; UK report |
| F29 Norway: mostly other expats Social experience | 51% | InterNations 2026 opt-in expat respondents in Norway February 1–March 31, 2026 Exact selected n unavailable | S01 Ease of Settling In: Mexico/Panama/Norway; UK report |
What do employer-paid movers report about loneliness?
The IMPACT Group report concerns company-paid relocations, including employees and spouses or partners. Participants recalled feelings before and after moving in one survey. The comparison documents reports in this selected sample; it does not establish that moving caused loneliness.
How did respondents recall loneliness before moving?
Retrospective ratings from the relocation survey. Displayed categories sum to 99%, leaving an unexplained remainder. Not a prospective baseline.
| Finding / scope | Percent | Population, period and base | Original source |
|---|---|---|---|
| F31 Before: low Social experience | 74% | IMPACT respondents in corporate-paid relocation study September–November 2022 Exact selected n unavailable | S02 PDF p.7, Feelings of Loneliness graph |
| F32 Before: medium Social experience | 22% | IMPACT respondents in corporate-paid relocation study September–November 2022 Exact selected n unavailable | S02 PDF p.7, Feelings of Loneliness graph |
| F33 Before: high Social experience | 3% | IMPACT respondents in corporate-paid relocation study September–November 2022 Exact selected n unavailable | S02 PDF p.7, Feelings of Loneliness graph |
How did respondents recall loneliness after moving?
Displayed categories sum to 98%, leaving an unexplained remainder. Differences cannot isolate a causal effect of moving or a national loneliness rate.
| Finding / scope | Percent | Population, period and base | Original source |
|---|---|---|---|
| F34 After: low Social experience | 51% | IMPACT respondents in corporate-paid relocation study September–November 2022 Exact selected n unavailable | S02 PDF p.7, Feelings of Loneliness graph |
| F35 After: medium Social experience | 27% | IMPACT respondents in corporate-paid relocation study September–November 2022 Exact selected n unavailable | S02 PDF p.7, Feelings of Loneliness graph |
| F36 After: high Social experience | 20% | IMPACT respondents in corporate-paid relocation study September–November 2022 Exact selected n unavailable | S02 PDF p.7, Feelings of Loneliness graph |
What did people moving alone report?
Conditional, small solo-mover subgroup; exact selected count unknown. Do not apply this estimate to all people moving alone.
| Finding / scope | Percent | Population, period and base | Original source |
|---|---|---|---|
| F37 Solo movers: medium/high loneliness Social experience | 67% | IMPACT respondents in corporate-paid relocation study who moved alone September–November 2022 Exact selected n unavailable | S02 PDF p.6, solo movers section |
What wider adjustment challenges accompany a move?
Distance from family, settling-in assistance, cultural adaptation and convincing relatives to move provide context around social connection. These items are explicitly separated from friendship and support outcomes. Crown’s 2026-labelled report uses 2024 collection dates.
What worried Australia-bound respondents before moving?
Retrospective pre-move concern, not observed post-move isolation. This question does not measure whether family ties weakened.
| Finding / scope | Percent | Population, period and base | Original source |
|---|---|---|---|
| F30 Worried about distance from home and family Relocation context | 42% | InterNations 2026 opt-in expat respondents in Australia February 1–March 31, 2026 Exact selected n unavailable | S01 Australia 2026 report: concerns before moving |
What wider adjustment challenges did respondents describe?
Different questions and potentially different eligible bases. Emotional adjustment is not identical to friendship formation; a duration is not a universal settling-in deadline.
| Finding / scope | Percent | Population, period and base | Original source |
|---|---|---|---|
| F38 Would benefit from additional settling-in assistance Relocation context | 70% | IMPACT respondents in corporate-paid relocation study September–November 2022 Exact selected n unavailable | S02 PDF pp.4–7, support, duration, focus and disclosure sections |
| F39 Emotional/personal challenges lasted three months or longer Relocation context | 56% | IMPACT respondents in corporate-paid relocation study September–November 2022 Exact selected n unavailable | S02 PDF pp.4–7, support, duration, focus and disclosure sections |
| F40 Uncomfortable/very uncomfortable sharing challenges with manager/HR Relocation context | 41% | IMPACT respondents in corporate-paid relocation study September–November 2022 Exact selected n unavailable | S02 PDF pp.4–7, support, duration, focus and disclosure sections |
| F41 Emotional challenges significantly/very affected focus in new role Relocation context | 20% | IMPACT respondents in corporate-paid relocation study who experienced emotional challenges during or after the move September–November 2022 Exact selected n unavailable | S02 PDF p.9, Emotional Challenges & Their Effect on Work |
What cultural barriers were reported?
2026-labelled report uses April–May 2024 fieldwork. Exact eligible routing for challenge questions is not supplied; selected barriers can overlap.
| Finding / scope | Percent | Population, period and base | Original source |
|---|---|---|---|
| F42 Cultural adjustment was extremely/very challenging Relocation context | 65% | Crown expat survey respondents in seven destinations April–May 2024 Exact selected n unavailable | S03 PDF p.9, Cultural integration |
| F43 Language barriers among cultural challenges Relocation context | 39% | Crown expat survey respondents in seven destinations April–May 2024 Exact selected n unavailable | S03 PDF pp.10–11, cultural adjustment and Fig.2.3 |
| F44 Adapting to new social norms among cultural challenges Relocation context | 29% | Crown expat survey respondents in seven destinations April–May 2024 Exact selected n unavailable | S03 PDF pp.10–11, cultural adjustment and Fig.2.3 |
How challenging was convincing family to relocate?
Not established as a parent-only percentage; exact eligible family/item count unknown. This is a decision-stage challenge, not a friendship outcome.
| Finding / scope | Percent | Population, period and base | Original source |
|---|---|---|---|
| F45 Convincing family was extremely/very challenging Relocation context | 48% | Crown expat survey respondents in seven destinations April–May 2024 Exact selected n unavailable | S03 PDF p.12, family section |
How do parents describe children’s adjustment?
Parents rated the adaptation of relocated school-aged children. These are proxy reports about a broad new environment, with no exact ages or selected count supplied. Adaptation can include many experiences besides making friends.
How did parents rate children’s adaptation?
Conditional on relocated school-aged children; exact selected count and ages unknown. Parent reports are not children’s own ratings or specific friendship measures. PDF categories retained; 86% refers to excitement, not this adaptation chart.
| Finding / scope | Percent | Population, period and base | Original source |
|---|---|---|---|
| F46 Very well Relocation context | 61% | Crown expat survey respondents in seven destinations reporting on relocated school-aged children April–May 2024 Exact selected n unavailable | S03 PDF p.23, Fig.5.2 |
| F47 Somewhat well Relocation context | 36% | Crown expat survey respondents in seven destinations reporting on relocated school-aged children April–May 2024 Exact selected n unavailable | S03 PDF p.23, Fig.5.2 |
| F48 Not well Relocation context | 2% | Crown expat survey respondents in seven destinations reporting on relocated school-aged children April–May 2024 Exact selected n unavailable | S03 PDF p.23, Fig.5.2 |
| F49 Still adapting Relocation context | 1% | Crown expat survey respondents in seven destinations reporting on relocated school-aged children April–May 2024 Exact selected n unavailable | S03 PDF p.23, Fig.5.2 |
How do existing relationships shape relocation decisions?
Information sources and relationship priorities help explain why people consider a move or prepare for it. They are not evidence that a new friendship network formed afterward. The U.S. PODS job item is a hypothetical willingness, not an observed job refusal.
Which pre-move information sources were used?
Two selected categories from a broader distribution, not all sources. Getting information online does not establish building a support network.
| Finding / scope | Percent | Population, period and base | Original source |
|---|---|---|---|
| F50 Online forums and social media Relocation context | 22% | Crown expat survey respondents in seven destinations April–May 2024 Exact selected n unavailable | S03 PDF p.15, Fig.3.1 |
| F51 Friends/family who had relocated Relocation context | 17% | Crown expat survey respondents in seven destinations April–May 2024 Exact selected n unavailable | S03 PDF p.15, Fig.3.1 |
How do existing relationships influence U.S. moving decisions?
Recent U.S. movers in a commercial survey. Proximity influenced the move; turning down a job is hypothetical. Neither measures the social outcome after moving.
| Finding / scope | Percent | Population, period and base | Original source |
|---|---|---|---|
| F52 Proximity to family, friends or support systems influenced move Relocation context | 41% | PODS/HarrisQuestDIY U.S. respondents age 18–80 who moved within three years March 2026 Exact selected n unavailable | S04 Publisher release, relationship priorities and methodology |
| F53 Would turn down a higher-paying job to maintain relationships Relocation context | 45% | PODS/HarrisQuestDIY U.S. respondents age 18–80 who moved within three years March 2026 Exact selected n unavailable | S04 Publisher release, relationship priorities and methodology |
What descriptive differences can be calculated?
These ten differences stay within a survey collection. Survey-wide benchmarks include destination subsets; before/after ratings are recalled; parent-rating categories are distinct responses. No statistical significance or causal effect is inferred.
| ID | Comparison | Difference | Qualification |
|---|---|---|---|
| C01 | Local friendship easy: Mexico minus survey-wide | 34 percentage points | Survey aggregate includes country respondents; not independent populations. |
| C02 | Local friendship easy: Thailand minus survey-wide | 10 percentage points | Opt-in subsets; no significance or country effect inferred. |
| C03 | Local friendship difficult: UK minus survey-wide | 6 percentage points | Country exact n unknown; same collection. |
| C04 | Support network: Mexico minus survey-wide | 15 percentage points | Global benchmark is the survey aggregate, not world prevalence. |
| C05 | Support network: Panama minus survey-wide | 14 percentage points | Aggregate includes destination subsets. |
| C06 | Support network: Norway minus survey-wide | -27 percentage points | Descriptive negative gap; not evidence of country causation. |
| C07 | Happy with social life: Sweden minus survey-wide | -29 percentage points | Same positive response definition; opt-in subsets. |
| C08 | High loneliness: recalled after minus before | 17 percentage points | Retrospective; categories have unexplained remainders; not causal. |
| C09 | Medium loneliness: recalled after minus before | 5 percentage points | Same retrospective commercial survey; no controlled baseline. |
| C10 | Child adaptation: very well minus somewhat well | 25 percentage points | Parent-rated categories; not a time trend or child self-report. |
Methodology and limitations
This compilation contains 53 observations in 16 related groups from four commercial survey collections: InterNations 30, IMPACT 11, Crown ten and PODS two. Thirty-six observations describe social experience; seventeen provide wider relocation context. Categories, destination subsets and recalled stages share samples. MyLittleDesire conducted no survey or pooled estimate.
Exact selected item or subgroup counts are unavailable for all 53 observations. Full survey counts are supplied separately: InterNations 7,786; IMPACT 101; Crown 1,000; PODS 1,000. These full counts must not be assigned to each row. The InterNations minimum of 50 per ranked destination is a threshold, not an exact country or question base.
InterNations uses an online voluntary expat sample with mixed lengths of residence. Its survey-wide benchmark is called a global average by the source, but it is not a representative estimate for the world population. Country subsets differ in composition and share the same collection. The survey does not isolate a causal effect of living in a particular country or establish where any individual should move.
The IMPACT publisher-authored 2023 report was inspected through a public PDF mirror. Its September–November 2022 survey covers corporate-paid moves and includes employees and spouses/partners. Recalled low, medium and high loneliness totals are 99% before and 98% after. The unexplained remainders are retained; categories are not normalized or filled. These are retrospective ratings, not a controlled prospective before-and-after study. The solo estimate has an unknown exact selected count and should be treated cautiously.
Crown’s report and release are labelled 2026, while PDF methods specify April–May 2024 collection. Its broad adjustment questions do not specifically measure close friendship. Child adaptation is reported by parents of school-aged children, with exact child ages and eligible parent count unavailable. The PDF adaptation chart gives 61% very well, 36% somewhat well, 2% not well and 1% still adapting. Its separate 86% excitement figure is not used as an adaptation percentage, despite the companion release’s settling wording.
PODS commissioned HarrisQuestDIY to survey U.S. adults aged 18–80 who had moved within three years. The March 2026 results concern relocation motives and hypothetical priorities. The inspected release does not supply recruitment, weighting, exact item counts or a full questionnaire. Motivation does not measure later relationship quality.
The newest documented fieldwork is March 2026. These sources do not supply a representative estimate of social connection among all domestic movers, a worldwide relocation-loneliness rate, a clinical diagnosis, or a universal timetable for making friends. Different populations, methods and questions prevent pooling. Descriptive percentage-point differences have no significance tests and are not effects.
Questions readers ask
How long does it take to make friends after moving?
These sources do not establish a universal time. Duration of emotional adjustment is a different measure from the time needed to form a close friendship.
Does relocation cause loneliness?
The selected surveys cannot establish that. Recalled differences and current ratings do not isolate the effect of moving from personal circumstances or other changes.
Are these percentages representative of all domestic movers?
No. Most social-outcome evidence here concerns opt-in expats or company-paid moves. The U.S. recent-mover source supplies relationship priorities, not a representative friendship-outcome estimate.
Does having mainly expat friends mean someone has no support?
No. Network composition and perceived support are different questions. The survey does not establish that one type of friendship is inherently better.
Related connection research
Explore our making friends as an adult statistics, neighbor relationships and community connection statistics, and loneliness statistics.
Original sources and methods
- InterNations [S01] — Expat Insider 2026: Ease of Settling In and destination reports
Published: 2026 edition; exact release day not established. Fieldwork: February 1–March 31, 2026. Full sample n=7,786. Online voluntary survey promoted through expat communities and other channels; 162 nationalities; minimum 50 respondents per ranked destination. Full sample is not the selected item or country base. Exact selected counts unavailable. Global average means this survey, not the world population. Selected destination comparisons share one collection and cannot establish national prevalence or causal country effects. English questionnaire; no probability sampling claimed. Publisher/methods companion. - IMPACT Group [S02] — 2023 People Perspective on Relocation
Published: 2023 report edition. Fieldwork: September–November 2022. Full sample n=101. Commercial survey of 101 individuals; 60% employees and 40% spouses/partners; recruitment, weighting and exact selected bases not supplied. Publisher-authored PDF inspected through a public mirror. Before/after loneliness is recalled in one survey, not a prospective controlled experiment. Displayed low/medium/high categories sum to 99% before and 98% after; unexplained remainder retained. Solo subgroup is small and its exact eligible count is unknown. Publisher/methods companion. - Crown World Mobility / Crown Relocations [S03] — Global Expat Survey Report 2026
Published: 2026 report; companion release April 22, 2026. Fieldwork: April–May 2024. Full sample n=1,000. English-language email invitation and online survey; sampling frame, selection details, weighting, exact item/country counts and full routing not supplied in inspected report. 2026 is the report label, not collection year: methods specify 2024. Children adaptation is parent-reported; school-aged children, exact ages unavailable. PDF adaptation categories 61/36/2/1 retained. Its 86% is child excitement; companion release describes 86% settling smoothly, so that wording is excluded. Publisher/methods companion. - PODS / HarrisQuestDIY [S04] — PODS Moving Mindset Study: Why Americans Are Moving
Published: April 22, 2026. Fieldwork: March 2026. Full sample n=1,000. HarrisQuestDIY survey commissioned by PODS; recruitment, weights, selected item counts and full questionnaire not disclosed on release. Original publisher text retrieved through web search/open; direct local download returned 403. Proximity is a moving motivation; job refusal is hypothetical. Neither is an observed friendship outcome or a representative all-mover estimate. Publisher/methods companion.
Destination pages within S01: United Kingdom, Canada, Australia. These remain one collection.
How to cite this resource
MyLittleDesire. Social Connection After Relocation Statistics 2027. Proposed URL: https://mylittledesire.com/social-connection-after-relocation-statistics/. Use after publication; add access date.