Grief support can come from family, friends, peers, communities and professional services. This resource examines who receives support, what people need, barriers to access, and preferences for help in schools and workplaces.
What are the key grief and support statistics?
- 85.1% of the Australian bereaved convenience sample used family and friends for support in the 2021–2022 survey. Check population, date and source.
- 62% were classified as having some unmet support needs in that sample. Check population, date and source.
- 38.9% of the Ontario bereaved sample wanted support. Check population, date and source.
- 88.7% of Ontario support recipients used family support. Check population, date and source.
- 86.3% of Ontario friend-support users found it helpful; this is a user rating. Check population, date and source.
- 52% of valid UK baseline respondents reported high needs around loneliness or isolation, at a median five months after loss. Check population, date and source.
- 14.4% of valid final-wave respondents reported that need at a median 25 months; the wave samples differ. Check population, date and source.
- 46% of adult UK consultation respondents reported no friend support helping them cope. Check population, date and source.
- 37% of the conditional UK barrier sample did not know what support was available or how to access it. Check population, date and source.
- 83% of surveyed U.S. parents supported grief education in school curricula. Check population, date and source.
What do grief support statistics measure?
| Measure | Interpretation |
|---|---|
| Bereavement | The experience of someone close having died; not itself a diagnosis. |
| Grief | Responses to loss; people’s experiences and support needs vary. |
| Support use | Reported receipt or use of a particular source, with the source’s timeframe. |
| Helpfulness | A user’s retrospective rating, distinct from measured clinical improvement. |
| Unmet support need | A source-specific classification of insufficient or absent desired help. |
| Institutional attitudes | What parents or employees say they want, not provision verified by researchers. |
| Prolonged grief disorder | A clinical condition involving persistent, intense grief and functional impairment; high support needs alone do not establish it. |
Definition context: American Psychiatric Association. No diagnostic prevalence estimate from that page is counted in the dataset.
Where did bereaved respondents turn for support?
Family, friends, peers and professionals can form different parts of a support network. These studies ask different groups about different time windows, so their source-use rates are shown separately. Using several sources does not measure the quality of every relationship.
Which supports did the Australian respondents use?
Multiple support sources could be used. These pandemic-era sample rates are not Australian population prevalence or evidence of treatment effectiveness.
| Finding / scope | Percent | Population, period and base | Original source |
|---|---|---|---|
| F01 Family and friends Bereavement experience | 85.1% | Australian bereaved adult convenience-sample respondents April 2021–April 2022; deaths January 2020–February 2022 Selected base n=1,878; Published Table 2 total-sample base | S01 Table 2, total sample column |
| F02 Self-help resources Bereavement experience | 27.2% | Australian bereaved adult convenience-sample respondents April 2021–April 2022; deaths January 2020–February 2022 Selected base n=1,878; Published Table 2 total-sample base | S01 Table 2, total sample column |
| F03 General practitioner Bereavement experience | 21.5% | Australian bereaved adult convenience-sample respondents April 2021–April 2022; deaths January 2020–February 2022 Selected base n=1,878; Published Table 2 total-sample base | S01 Table 2, total sample column |
| F04 Psychologist Bereavement experience | 19.6% | Australian bereaved adult convenience-sample respondents April 2021–April 2022; deaths January 2020–February 2022 Selected base n=1,878; Published Table 2 total-sample base | S01 Table 2, total sample column |
| F05 Online community support groups Bereavement experience | 17.6% | Australian bereaved adult convenience-sample respondents April 2021–April 2022; deaths January 2020–February 2022 Selected base n=1,878; Published Table 2 total-sample base | S01 Table 2, total sample column |
| F06 Grief counselling Bereavement experience | 10.9% | Australian bereaved adult convenience-sample respondents April 2021–April 2022; deaths January 2020–February 2022 Selected base n=1,878; Published Table 2 total-sample base | S01 Table 2, total sample column |
| F07 Religious leaders/organizations Bereavement experience | 8.4% | Australian bereaved adult convenience-sample respondents April 2021–April 2022; deaths January 2020–February 2022 Selected base n=1,878; Published Table 2 total-sample base | S01 Table 2, total sample column |
| F08 Advice or support line Bereavement experience | 3.5% | Australian bereaved adult convenience-sample respondents April 2021–April 2022; deaths January 2020–February 2022 Selected base n=1,878; Published Table 2 total-sample base | S01 Table 2, total sample column |
| F09 Informal bereavement support groups Bereavement experience | 3% | Australian bereaved adult convenience-sample respondents April 2021–April 2022; deaths January 2020–February 2022 Selected base n=1,878; Published Table 2 total-sample base | S01 Table 2, total sample column |
| F10 Formal grief support groups Bereavement experience | 2.2% | Australian bereaved adult convenience-sample respondents April 2021–April 2022; deaths January 2020–February 2022 Selected base n=1,878; Published Table 2 total-sample base | S01 Table 2, total sample column |

Which support sources did Ontario recipients use?
Only recipients of any support, not all Ontario adults or all bereaved respondents. Sources overlap. Published clergy rate 26.2% retained despite a small count/rate rounding inconsistency.
| Finding / scope | Percent | Population, period and base | Original source |
|---|---|---|---|
| F15 Family members Bereavement experience | 88.7% | English-completing bereaved Ontario adults in quota-panel sample who received any support Exact fieldwork dates not reported in inspected article; not inferred from publication or ethics number Selected base n=586; Published Table 5 recipient base | S02 Table 5, Yes column |
| F16 Friends Bereavement experience | 86% | English-completing bereaved Ontario adults in quota-panel sample who received any support Exact fieldwork dates not reported in inspected article; not inferred from publication or ethics number Selected base n=586; Published Table 5 recipient base | S02 Table 5, Yes column |
| F17 Local community members Bereavement experience | 37.7% | English-completing bereaved Ontario adults in quota-panel sample who received any support Exact fieldwork dates not reported in inspected article; not inferred from publication or ethics number Selected base n=586; Published Table 5 recipient base | S02 Table 5, Yes column |
| F18 Family doctor Bereavement experience | 39.2% | English-completing bereaved Ontario adults in quota-panel sample who received any support Exact fieldwork dates not reported in inspected article; not inferred from publication or ethics number Selected base n=586; Published Table 5 recipient base | S02 Table 5, Yes column |
| F19 Grief counsellor Bereavement experience | 30.9% | English-completing bereaved Ontario adults in quota-panel sample who received any support Exact fieldwork dates not reported in inspected article; not inferred from publication or ethics number Selected base n=586; Published Table 5 recipient base | S02 Table 5, Yes column |
| F20 Bereavement support services Bereavement experience | 26.6% | English-completing bereaved Ontario adults in quota-panel sample who received any support Exact fieldwork dates not reported in inspected article; not inferred from publication or ethics number Selected base n=586; Published Table 5 recipient base | S02 Table 5, Yes column |
| F21 Other bereaved people Bereavement experience | 48.6% | English-completing bereaved Ontario adults in quota-panel sample who received any support Exact fieldwork dates not reported in inspected article; not inferred from publication or ethics number Selected base n=586; Published Table 5 recipient base | S02 Table 5, Yes column |
| F22 Clergy Bereavement experience | 26.2% | English-completing bereaved Ontario adults in quota-panel sample who received any support Exact fieldwork dates not reported in inspected article; not inferred from publication or ethics number Selected base n=586; Published Table 5 recipient base | S02 Table 5, Yes column |
How much did cohort respondents use family and friends?
T1 asks since loss; T4 asks about the past six months. T4 valid n=170, not the full final-wave n=185. No direct trend or effect of time is inferred.
| Finding / scope | Percent | Population, period and base | Original source |
|---|---|---|---|
| F41 Baseline: since loss Bereavement experience | 87.3% | UK cohort baseline respondents August 28, 2020–January 5, 2021 (T1) Selected base n=711; Published Table 4 baseline reporting base | S03 Table 4, family and friends row; Results §3.3 and footnotes |
| F42 Final wave: past six months Bereavement experience | 90% | UK cohort final-wave valid respondents to family/friend item May 17, 2022–January 12, 2023 (T4) Selected base n=170; Published numerator/base 153/170 in Results §3.3 | S03 Table 4, family and friends row; Results §3.3 and footnotes |
How helpful did users find their support?
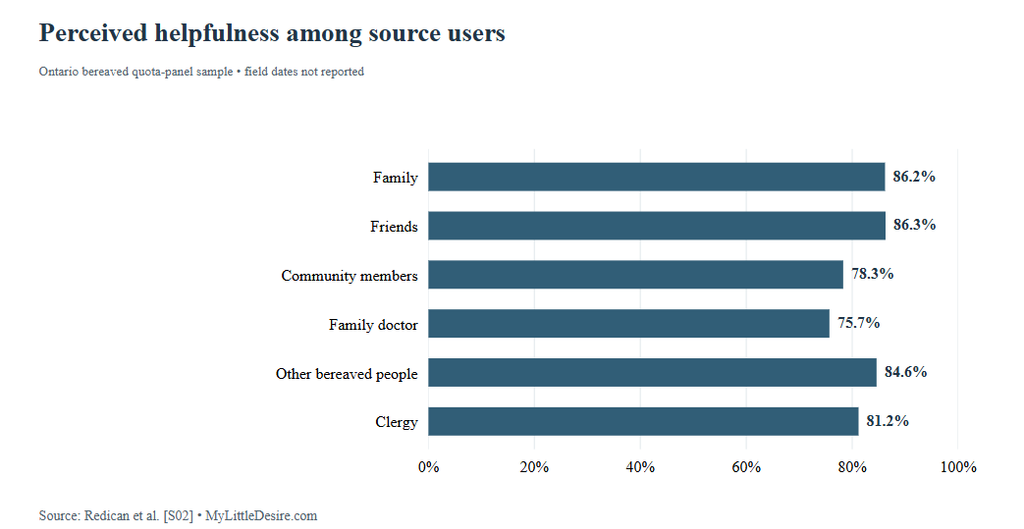
The Ontario study asks users whether each source was helpful. Its denominators change with the source used. Retrospective satisfaction cannot establish that one provider is more effective than another, and it does not measure how many people recovered.
How helpful did users find each source?
Each percentage has a different user denominator. These are retrospective ratings, not randomized comparisons, clinical success rates or the share of all bereaved people helped.
| Finding / scope | Percent | Population, period and base | Original source |
|---|---|---|---|
| F23 Family members Bereavement experience | 86.2% | English-completing bereaved Ontario adults in quota-panel sample who used family members Exact fieldwork dates not reported in inspected article; not inferred from publication or ethics number Selected base n=520; Published source-user count in Table 5 | S02 Table 5, Found it helpful column; user counts in Yes column |
| F24 Friends Bereavement experience | 86.3% | English-completing bereaved Ontario adults in quota-panel sample who used friends Exact fieldwork dates not reported in inspected article; not inferred from publication or ethics number Selected base n=504; Published source-user count in Table 5 | S02 Table 5, Found it helpful column; user counts in Yes column |
| F25 Local community members Bereavement experience | 78.3% | English-completing bereaved Ontario adults in quota-panel sample who used local community members Exact fieldwork dates not reported in inspected article; not inferred from publication or ethics number Selected base n=221; Published source-user count in Table 5 | S02 Table 5, Found it helpful column; user counts in Yes column |
| F26 Family doctor Bereavement experience | 75.7% | English-completing bereaved Ontario adults in quota-panel sample who used family doctor Exact fieldwork dates not reported in inspected article; not inferred from publication or ethics number Selected base n=230; Published source-user count in Table 5 | S02 Table 5, Found it helpful column; user counts in Yes column |
| F27 Other bereaved people Bereavement experience | 84.6% | English-completing bereaved Ontario adults in quota-panel sample who used other bereaved people Exact fieldwork dates not reported in inspected article; not inferred from publication or ethics number Selected base n=285; Published source-user count in Table 5 | S02 Table 5, Found it helpful column; user counts in Yes column |
| F28 Clergy Bereavement experience | 81.2% | English-completing bereaved Ontario adults in quota-panel sample who used clergy Exact fieldwork dates not reported in inspected article; not inferred from publication or ethics number Selected base n=154; Published source-user count in Table 5 | S02 Table 5, Found it helpful column; user counts in Yes column |
What emotional and practical support needs were reported?
Needs can involve being understood, reassurance, social connection or practical help. High needs are not diagnoses. The UK cohort has fewer respondents at later waves; separate wave estimates do not describe a universal recovery trajectory.
How common were unmet needs in that Australian sample?
Unmet means some but insufficient support OR no needed support. The comparison category includes people who did not feel they needed support. Body/Table 2 62.0% is distinct from abstract wording about 66% specific unmet needs.
| Finding / scope | Percent | Population, period and base | Original source |
|---|---|---|---|
| F11 Some unmet support needs Bereavement experience | 62% | Australian bereaved adult convenience-sample respondents April 2021–April 2022; deaths January 2020–February 2022 Selected base n=1,878; Published overall valid sample; 1,164 classified as unmet | S01 Results, Characteristics of the sample; Table 2 column totals |
What high support needs were reported around five months after loss?
Selected convenience cohort, not all UK bereaved adults. Need is not a diagnosis. Item-valid n is derived from response counts/published missing. Attrition means these wave distributions are not a matched recovery curve.
| Finding / scope | Percent | Population, period and base | Original source |
|---|---|---|---|
| F29 Feelings about how the person died Bereavement experience | 59.8% | UK bereavement cohort baseline respondents, median five months after loss August 28, 2020–January 5, 2021 (T1) Selected base n=697; Table-derived valid n: wave total minus published item missing | S03 Table 3, fairly high/high response row, T1 column |
| F30 Expressing feelings and being understood Bereavement experience | 53% | UK bereavement cohort baseline respondents, median five months after loss August 28, 2020–January 5, 2021 (T1) Selected base n=694; Table-derived valid n: wave total minus published item missing | S03 Table 3, fairly high/high response row, T1 column |
| F31 Feeling comforted and reassured Bereavement experience | 51.7% | UK bereavement cohort baseline respondents, median five months after loss August 28, 2020–January 5, 2021 (T1) Selected base n=686; Table-derived valid n: wave total minus published item missing | S03 Table 3, fairly high/high response row, T1 column |
| F32 Feelings of anxiety and depression Bereavement experience | 52.8% | UK bereavement cohort baseline respondents, median five months after loss August 28, 2020–January 5, 2021 (T1) Selected base n=691; Table-derived valid n: wave total minus published item missing | S03 Table 3, fairly high/high response row, T1 column |
| F33 Loneliness and social isolation Bereavement experience | 52% | UK bereavement cohort baseline respondents, median five months after loss August 28, 2020–January 5, 2021 (T1) Selected base n=691; Table-derived valid n: wave total minus published item missing | S03 Table 3, fairly high/high response row, T1 column |
| F34 Regaining purpose and meaning Bereavement experience | 46.7% | UK bereavement cohort baseline respondents, median five months after loss August 28, 2020–January 5, 2021 (T1) Selected base n=691; Table-derived valid n: wave total minus published item missing | S03 Table 3, fairly high/high response row, T1 column |

What high support needs remained among final-wave respondents?
Selected convenience cohort, not all UK bereaved adults. Need is not a diagnosis. Item-valid n is derived from response counts/published missing. Attrition means these wave distributions are not a matched recovery curve.
| Finding / scope | Percent | Population, period and base | Original source |
|---|---|---|---|
| F35 Feelings about how the person died Bereavement experience | 18.5% | UK bereavement cohort final-wave respondents, median 25 months after loss May 17, 2022–January 12, 2023 (T4) Selected base n=184; Table-derived valid n: wave total minus published item missing | S03 Table 3, fairly high/high response row, T4 column |
| F36 Expressing feelings and being understood Bereavement experience | 15.8% | UK bereavement cohort final-wave respondents, median 25 months after loss May 17, 2022–January 12, 2023 (T4) Selected base n=183; Table-derived valid n: wave total minus published item missing | S03 Table 3, fairly high/high response row, T4 column |
| F37 Feeling comforted and reassured Bereavement experience | 15.3% | UK bereavement cohort final-wave respondents, median 25 months after loss May 17, 2022–January 12, 2023 (T4) Selected base n=183; Table-derived valid n: wave total minus published item missing | S03 Table 3, fairly high/high response row, T4 column |
| F38 Feelings of anxiety and depression Bereavement experience | 17.9% | UK bereavement cohort final-wave respondents, median 25 months after loss May 17, 2022–January 12, 2023 (T4) Selected base n=184; Table-derived valid n: wave total minus published item missing | S03 Table 3, fairly high/high response row, T4 column |
| F39 Loneliness and social isolation Bereavement experience | 14.4% | UK bereavement cohort final-wave respondents, median 25 months after loss May 17, 2022–January 12, 2023 (T4) Selected base n=181; Table-derived valid n: wave total minus published item missing | S03 Table 3, fairly high/high response row, T4 column |
| F40 Regaining purpose and meaning Bereavement experience | 15.2% | UK bereavement cohort final-wave respondents, median 25 months after loss May 17, 2022–January 12, 2023 (T4) Selected base n=184; Table-derived valid n: wave total minus published item missing | S03 Table 3, fairly high/high response row, T4 column |
What gaps and barriers affected access?
Not wanting support, not finding it, not receiving it and not finding it helpful are different experiences. The UK consultation and Ontario study use selected populations and conditional questions. Percentages are not pooled into one unmet-need rate.
Who wanted and received bereavement support in Ontario?
Different denominators. Receiving support without reporting that it was wanted does not establish coercion, unwanted contact or harmful care.
| Finding / scope | Percent | Population, period and base | Original source |
|---|---|---|---|
| F12 Wanted support Bereavement experience | 38.9% | English-completing bereaved Ontario adults in quota-panel sample Exact fieldwork dates not reported in inspected article; not inferred from publication or ethics number Selected base n=1,169; Published wanting-support analysis base | S02 Results, wanting support and wanting/receiving support sections |
| F13 Received any support Bereavement experience | 50.1% | English-completing bereaved Ontario adults in quota-panel sample Exact fieldwork dates not reported in inspected article; not inferred from publication or ethics number Exact selected n unavailable | S02 Results, wanting support and wanting/receiving support sections |
| F14 Recipients who had not wanted support Bereavement experience | 42.5% | English-completing bereaved Ontario adults in quota-panel sample who received support Exact fieldwork dates not reported in inspected article; not inferred from publication or ethics number Selected base n=586; Published support-recipient base; 249 had not wanted support | S02 Results, wanting support and wanting/receiving support sections |
What informal-support gaps did the UK consultation identify?
Voluntary consultation respondents, not UK national prevalence. The original item asks about help coping, not all social contact. Source nonreceipt categories overlap; do not add them.
| Finding / scope | Percent | Population, period and base | Original source |
|---|---|---|---|
| F53 No family support Bereavement experience | 28% | Adult UK bereavement consultation respondents Adult online consultation September 2021–January 2022; adults bereaved within previous five years Selected base n=1,119; Published informal-support question/chart base | S05 Full report PDF p.29, informal-support prose/chart base |
| F54 No friend support Bereavement experience | 46% | Adult UK bereavement consultation respondents Adult online consultation September 2021–January 2022; adults bereaved within previous five years Selected base n=1,119; Published informal-support question/chart base | S05 Full report PDF p.29, informal-support prose/chart base |
| F55 No support from any informal source Bereavement experience | 17.8% | Adult UK bereavement consultation respondents Adult online consultation September 2021–January 2022; adults bereaved within previous five years Selected base n=1,119; Published informal-support question/chart base | S05 Full report PDF p.29, informal-support prose/chart base |
Did people wanting formal support receive it?
Conditional on wanting formal support. Exact eligible n is not specified beside the 42% passage. The adjacent barrier-chart n=281 is not automatically assigned here.
| Finding / scope | Percent | Population, period and base | Original source |
|---|---|---|---|
| F56 Wanted formal support but received none Bereavement experience | 42% | Adult consultation respondents wanting formal bereavement support Adult online consultation September 2021–January 2022; adults bereaved within previous five years Exact selected n unavailable | S05 Full report PDF p.129, barriers section opening paragraph |
Also Read:-
Social Anxiety And Making Friends Statistics 2027
Couples And Social Media Statistics 2027
Video Calling Family Connection Statistics 2027
AI Relationship Advice Statistics 2027
AI Romantic Partners Statistics 2027
What barriers were reported by people wanting support?
Conditional multiple-response barrier item n=281. Includes people certain they wanted support and those thinking they might benefit but uncertain. Not an all-bereaved or national service-failure rate.
| Finding / scope | Percent | Population, period and base | Original source |
|---|---|---|---|
| F57 Did not know what was available or how to access it Bereavement experience | 37% | Adult UK consultation respondents in support-barrier item Adult online consultation September 2021–January 2022; adults bereaved within previous five years Selected base n=281; Published barrier-chart base | S05 Full report PDF p.129, original barrier chart (visually checked) |
| F58 Needed support was not available Bereavement experience | 33% | Adult UK consultation respondents in support-barrier item Adult online consultation September 2021–January 2022; adults bereaved within previous five years Selected base n=281; Published barrier-chart base | S05 Full report PDF p.129, original barrier chart (visually checked) |
| F59 Did not feel comfortable asking for help Bereavement experience | 26% | Adult UK consultation respondents in support-barrier item Adult online consultation September 2021–January 2022; adults bereaved within previous five years Selected base n=281; Published barrier-chart base | S05 Full report PDF p.129, original barrier chart (visually checked) |
| F60 Did not believe support would help Bereavement experience | 20% | Adult UK consultation respondents in support-barrier item Adult online consultation September 2021–January 2022; adults bereaved within previous five years Selected base n=281; Published barrier-chart base | S05 Full report PDF p.129, original barrier chart (visually checked) |

What do parents and employees want from institutions?
These U.S. items ask parents and employed adults about support in schools and workplaces. Most are attitudes or preferences, not reports from a bereaved-only sample or measurements of services actually delivered.
What support do U.S. parents want around children’s grief?
Survey parents, not necessarily recently bereaved parents. Exact parent/item counts and full routing unknown. Attitudes do not measure what children actually receive.
| Finding / scope | Percent | Population, period and base | Original source |
|---|---|---|---|
| F43 Youngest grievers need special support Institutional context | 95% | U.S. parents in New York Life 2025 survey September 16–21, 2025 Exact selected n unavailable | S04 PDF p.4 / printed pp.6–7; PDF p.6 / printed pp.10–11 |
| F44 Want resources to discuss grief with young children Institutional context | 89% | U.S. parents in New York Life 2025 survey September 16–21, 2025 Exact selected n unavailable | S04 PDF p.4 / printed pp.6–7; PDF p.6 / printed pp.10–11 |
| F45 Under-fives are often forgotten grievers Institutional context | 86% | U.S. parents in New York Life 2025 survey September 16–21, 2025 Exact selected n unavailable | S04 PDF p.4 / printed pp.6–7; PDF p.6 / printed pp.10–11 |
| F46 Educators should help support grieving children Institutional context | 87% | U.S. parents in New York Life 2025 survey September 16–21, 2025 Exact selected n unavailable | S04 PDF p.4 / printed pp.6–7; PDF p.6 / printed pp.10–11 |
| F47 Support grief education in school curricula Institutional context | 83% | U.S. parents in New York Life 2025 survey September 16–21, 2025 Exact selected n unavailable | S04 PDF p.4 / printed pp.6–7; PDF p.6 / printed pp.10–11 |
| F48 Believe grief education should begin in elementary school Institutional context | 42% | U.S. parents in New York Life 2025 survey September 16–21, 2025 Exact selected n unavailable | S04 PDF p.4 / printed pp.6–7; PDF p.6 / printed pp.10–11 |
How do employed adults view bereavement support?
Employed survey adults, not exclusively bereaved employees. Three are attitudes and one is an ever-experience. PDF gives 66% bereaved while working; companion release gives 61%. PDF retained. Exact item/subgroup counts unavailable.
| Finding / scope | Percent | Population, period and base | Original source |
|---|---|---|---|
| F49 Death of a loved one is as significant as other major life events Institutional context | 91% | U.S. employed adults in New York Life 2025 survey September 16–21, 2025 Exact selected n unavailable | S04 PDF p.9 / printed pp.16–17; p.10 / printed pp.18–19 |
| F50 Experienced a loved one’s death while employed Institutional context | 66% | U.S. employed adults in New York Life 2025 survey September 16–21, 2025 Exact selected n unavailable | S04 PDF p.9 / printed pp.16–17; p.10 / printed pp.18–19 |
| F51 Bereavement policy important when job hunting Institutional context | 77% | U.S. employed adults in New York Life 2025 survey September 16–21, 2025 Exact selected n unavailable | S04 PDF p.9 / printed pp.16–17; p.10 / printed pp.18–19 |
| F52 Proud to work for a bereavement-supportive company Institutional context | 93% | U.S. employed adults in New York Life 2025 survey September 16–21, 2025 Exact selected n unavailable | S04 PDF p.9 / printed pp.16–17; p.10 / printed pp.18–19 |
What descriptive differences can be calculated?
Ten reproducible percentage-point differences are available in the workbook. They stay within a dataset and retain question/base distinctions. They do not establish statistical significance, causation or treatment effects.
| ID | Comparison | Difference |
|---|---|---|
| C01 | Family/friends minus self-help use: Australia | 57.9 percentage points |
| C02 | GP minus psychologist use: Australia | 1.9 percentage points |
| C03 | Online groups minus grief counselling use: Australia | 6.7 percentage points |
| C04 | Family minus friend support use: Ontario recipients | 2.7 percentage points |
| C05 | Other bereaved people minus family doctor use: Ontario | 9.4 percentage points |
| C06 | Understanding minus comfort: UK baseline high needs | 1.3 percentage points |
| C07 | Anxiety/depression minus loneliness: UK baseline high needs | 0.8 percentage points |
| C08 | Employer pride minus job-search importance | 16 percentage points |
| C09 | No friend minus no family support: consultation | 18 percentage points |
| C10 | Awareness barrier minus unavailable support | 4 percentage points |
Methodology and limitations
This resource selects 60 observations: Australia 11, Ontario 17, UK cohort 14, New York Life 10 and UK consultation eight. Related support sources, categories and follow-up stages share samples. Fifty observations describe bereavement experiences; ten give wider institutional context from parent/employee samples. A separate APA page supplies definition context only. MyLittleDesire conducted no survey, pooled analysis or clinical assessment.
Forty-eight selected reporting bases are available, including twelve valid UK need-item bases derived from response counts or published missing values. Twelve exact item/subgroup counts remain unknown. Full sample sizes remain separate. Ontario received-any-support valid n is not separately established. New York Life parent and employee counts are not supplied. The UK consultation’s exact full adult count is not established here; its age table has 1,121 valid responses, support item 1,119 and barrier chart 281.
The Australian study uses a convenience sample of 1,878, overwhelmingly women. It classifies 1,164 people as having unmet needs, or 62.0%. The abstract’s 66% refers to specific unmet needs; this resource retains the Results/Table 2 overall classification and does not silently substitute the abstract figure. Respondents could select several support sources. These pandemic-era experiences cannot establish contemporary national unmet need.
The Ontario study uses non-probability quotas in an English-completing panel. Its publication date, December 2025, is not its undisclosed field date. Source use is among 586 support recipients; helpfulness is among users of each source. The clergy-use percentage of 26.2% is retained as published, although its stated count of 154 out of 586 rounds to 26.3%. More distress among people seeking multiple supports does not show that those supports caused distress.
The UK convenience cohort falls from 711 baseline respondents to 185 final-wave respondents. The selected need percentages exclude item missingness, so bases vary. At T1, needs are reported around five months after death; at T4, around 25 months. The tables describe wave-specific distributions, not matched individual change. Family/friend use also changes reference window from since loss to the last six months, with final-wave valid n=170. No recovery deadline or national trend is inferred.
The New York Life 2025 poll was released in March 2026. Its original PDF gives 66% for employed adults experiencing a loved one’s death while working; the companion release gives 61%. This resource uses the original PDF 66% and records the discrepancy. Its school-record item shifts between adults and parents in the report, so that item is excluded. Survey attitudes do not prove actual institutional provision or the impact of a policy.
The UK Commission consultation is voluntary and retrospective. The support question asks about help with coping, which differs from all social contact. Barriers are multiple response among a selected n=281. The separate 42% figure is conditional on wanting formal support, with an unspecified exact eligible count. That count is left unknown. Lack-of-support categories overlap and cannot be added into a combined rate.
These designs cannot isolate whether support causes better or worse grief outcomes. Countries, sampling, definitions and timeframes differ, so no cross-country ranking or pooled worldwide rate is produced. Support needs are not diagnostic criteria. The selected figures do not establish how many people have prolonged grief disorder or which treatment works best.
Questions readers ask
Does everyone who grieves need professional treatment?
These surveys do not establish that. They describe varied needs and sources, including personal networks, practical help and professional services. Need for support and a clinical diagnosis are separate.
Does a helpfulness percentage mean a treatment works?
No. The Ontario ratings come from users looking back on support. There was no randomized treatment comparison, and different source users may have different needs.
Can the UK follow-up percentages show when people recover?
No. Attrition, item missingness and different respondents across waves prevent treating these tables as a universal recovery schedule.
Does 42% without wanted formal support use n=281?
The inspected passage does not confirm that. The barrier chart uses 281, while the exact eligible base for the separate 42% remains unknown.
Related connection research
See our social support during life changes statistics, sympathy-card and condolence practices statistics, and loneliness statistics for related measures.
Original sources
- Ivynian et al. / PLOS ONE [S01] — Support needs of Australians bereaved during the COVID-19 pandemic: A cross-sectional survey study
Published: June 6, 2024. Fieldwork: April 2021–April 2022; deaths January 2020–February 2022. Full survey/starting analytic sample n=1,878. Voluntary online survey advertised through social media and community/consumer organizations; cross-sectional, not a probability sample. Sample 94.9% women. Valid cases answered the overall support-needs question. Results/Table 2 identify 1,164 unmet needs out of 1,878 (62.0%). Abstract says 66% reported specific unmet needs; that wording/number is not substituted for the overall classification. Support sources overlap; receiving support is not evidence of treatment benefit. Supporting original source. - Redican et al. / Social Psychiatry and Psychiatric Epidemiology [S02] — Bereavement and mental health factors associated with seeking and receiving support following loss among Canadian bereaved adults
Published: Online December 2, 2025; journal issue 2026. Fieldwork: Exact fieldwork dates not reported in inspected article; not inferred from publication or ethics number. Full survey/starting analytic sample n=1,170. Qualtrics managed double opt-in panels; non-probability quotas on age, gender and income; bereaved analytic subset of 1,310 adults. Wanting-support analysis n=1,169; support recipients n=586. Source-use rates use recipients; helpfulness rates use only users of each specific source. The received-any-support item-valid n is not separately established. Table 5 clergy use 26.2% is retained although 154/586 rounds to 26.3%. Higher distress among people using more support does not prove support harms them. Supporting original source. - Goss et al. / Frontiers in Public Health [S03] — Support needs, support use and perceived helpfulness of support in a cohort of people bereaved during the COVID-19 pandemic
Published: June 24, 2026. Fieldwork: Baseline August 28, 2020–January 5, 2021; final wave May 17, 2022–January 12, 2023. Full survey/starting analytic sample n=711. Convenience-sample longitudinal web survey; wave totals 711, 384, 295 and 185; no population weighting claimed. 89% women at baseline; attrition and selection limit generalization. Support-need bases below are derived from response counts or wave total minus published missing. T1 median five months after loss, T4 median 25 months. Family/friend use T1 is since loss; T4 is past six months, with item n=170 rather than wave n=185. These are not directly comparable national trends. Supporting original source. - New York Life Foundation [S04] — 2025 State of Grief Report: Building a Sustainable Culture of Care and Grief Support
Published: 2025 report edition; release March 12, 2026. Fieldwork: September 16–21, 2025. Full survey/starting analytic sample n=2,201. Online poll weighted to demographic targets; detailed recruitment, selected subgroup counts and full questionnaire not supplied in report. Parent and employed-adult counts remain unknown. Preferences do not measure actual school/workplace provision or clinical efficacy. Original PDF p.9 / printed pp.16–17 gives 66% of employed adults bereaved while working; companion release gives 61%. This compilation uses the PDF 66% and records the discrepancy. The school-record item has ambiguous adults/parents wording and is excluded. Supporting original source. - UK Commission on Bereavement / Marie Curie [S05] — Bereavement is everyone’s business — full report
Published: October 6, 2022. Fieldwork: Adult online consultation September 2021–January 2022; adults bereaved within previous five years. Exact full adult count not established. Open consultation combining adult/child surveys and organizational/oral evidence; selected adult support base 1,119, barrier-chart base 281. Exact full adult count not established from summary; age table has 1,121 valid responses. Do not treat 1,119 as every question’s full sample. No-family/no-friend figures refer to reported support helping cope, not absence of all contact. Barriers are multiple response among people wanting support. The 42% unmet formal-support passage has an unspecified exact eligible base; do not automatically assign the barrier-chart n=281. Supporting original source.
Definition reference, not a survey collection: American Psychiatric Association: Prolonged Grief Disorder.
How to cite this resource
MyLittleDesire. Grief & Support Network Statistics 2027. Proposed URL: https://mylittledesire.com/grief-support-network-statistics/. Use after publication and add your access date.