
First-date safety research measures several different things: feeling uneasy, setting privacy boundaries, preparing to leave, experiencing unwanted contact, and reported harm. Keeping those measures distinct makes the statistics more useful to readers and writers.
The practical guidance near the end comes from RAINN and Australia’s eSafety Commissioner. Responsibility for abusive behavior lies with the person who commits it. Precautions can provide choices and support; they cannot guarantee safety.
What are the key first-date safety findings?
32%
49%
of GB adults were somewhat uncomfortable with a first date knowing where they live.December 2022 · Hypothetical attitude. Source [S02]
of women in Project Gender’s NZ sample said they always tell someone where they are going on an app-initiated first date.2022 report · Self-selected sample. Source [S03]
46%
48%
of women in the same NZ sample said they always plan how to leave if they feel unsafe.2022 report · Item base not supplied. Source [S03]
of US dating-site/app ever-users had experienced at least one of four unwanted online behaviors.July 2022 · Lifetime platform experience. Source [S04]
34.0%
57%
reported in-person app-facilitated harassment, aggression or violence in the Australian quota survey.2021 survey · Previous five years; broader than first dates. Source [S05]
of US adults considered meeting an online-dating contact in person very or somewhat safe.January 2026 · Public opinion. Source [S07]
What does a first-date safety statistic actually measure?
| Measure | What it describes | Limit to retain |
|---|---|---|
| First-date unease | A respondent’s feeling in a stated situation | Feeling unsafe does not itself establish an assault. |
| Reported safety practice | How often people say they share plans or prepare an exit | Reported practice does not quantify its protective effect. |
| Online harassment experience | A user’s account of unwanted platform behavior | It can happen without a date or an in-person meeting. |
| Five-year app-facilitated harm | Experiences involving someone first met through a platform | The event can occur later in a relationship. |
| Operational first-meeting cases | Records referred to and analyzed by an agency | A count of all first dates is needed to estimate per-date probability. |
| General safety opinion | A belief about meeting someone from an app | Opinion and observed outcomes answer different questions. |
Trying a dating app, meeting someone through it and experiencing unwanted behavior are separate measures. Our online dating and dating app statistics resource covers platform adoption and user experiences.
ALSO READ:-
How Couples Meet Statistics 2027
Dating After Divorce Statistics 2027
Dating Over 50 Statistics 2027
Dating Burnout Statistics 2027
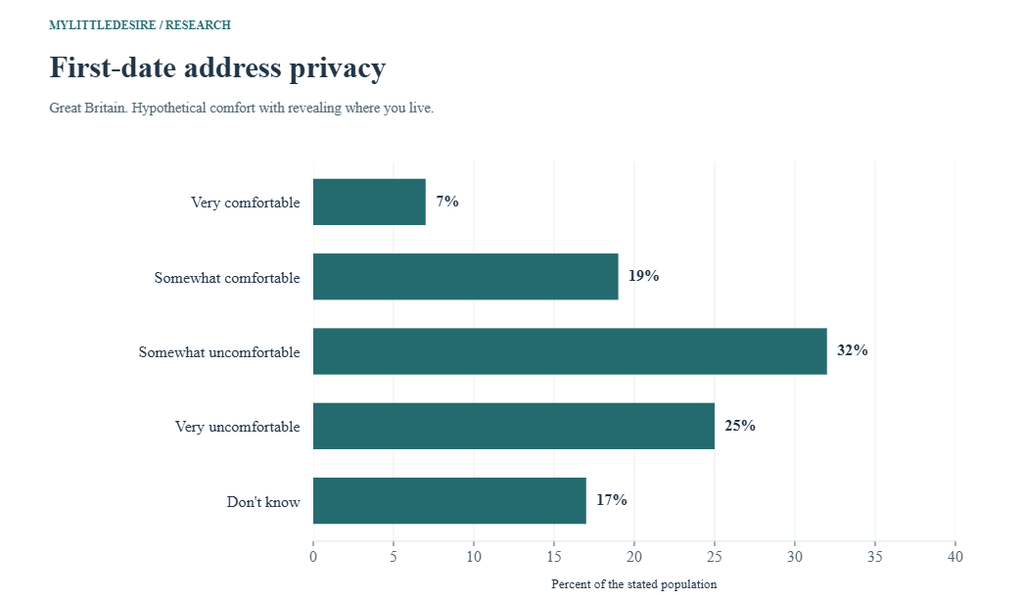
How comfortable are people sharing their home location with a first date?
YouGov asked GB adults how comfortable they would be with a first date knowing where they live. The question is useful for understanding privacy attitudes. It does not show whether respondents actually disclosed an address.
F02 All-adult comfort distribution for a hypothetical first date. Not actual disclosure, assault incidence or evidence that any particular disclosure policy prevents harm.
| Measure / group | Reported result | Population and actual period | Original source |
|---|---|---|---|
| Very comfortable | 7% | GB adults answering a hypothetical first-date address-disclosure question Eligible n=3,362. 2022-12-20 | Original source [S02] Daily Question, 20 December 2022, all-adult results |
| Somewhat comfortable | 19% | GB adults answering a hypothetical first-date address-disclosure question Eligible n=3,362. 2022-12-20 | Original source [S02] Daily Question, 20 December 2022, all-adult results |
| Somewhat uncomfortable | 32% | GB adults answering a hypothetical first-date address-disclosure question Eligible n=3,362. 2022-12-20 | Original source [S02] Daily Question, 20 December 2022, all-adult results |
| Very uncomfortable | 25% | GB adults answering a hypothetical first-date address-disclosure question Eligible n=3,362. 2022-12-20 | Original source [S02] Daily Question, 20 December 2022, all-adult results |
| Don’t know | 17% | GB adults answering a hypothetical first-date address-disclosure question Eligible n=3,362. 2022-12-20 | Original source [S02] Daily Question, 20 December 2022, all-adult results |
Identity deception and financial scams require their own evidence. For those topics, see our romance scam and catfishing statistics.
How often do people share first-date plans or prepare to leave?
Project Gender’s Aotearoa report supplies direct first-date practice findings. It recruited New Zealand adults mainly through Instagram advertising. Its respondents cannot be treated as a representative national sample, and the exact first-date question bases were not printed.
F03 Source-reported ‘always’ responses in its First Dates section. Self-selected 823-person overall sample; exact eligible first-date subgroup n/recall windows unavailable. Describes the report’s respondents, not all New Zealand daters.
| Measure / group | Reported result | Population and actual period | Original source |
|---|---|---|---|
| Women: always tell someone where going | 49% | Report-defined women in the New Zealand sample’s first-date question Exact eligible item/subgroup n unavailable. 2022 report; exact fieldwork dates and first-date item recall windows not supplied; eligibility required app activity in prior 12 months | Original source [S03] Report physical p.7, First Dates, second paragraph |
| Men: always tell someone where going | 13% | Report-defined men in the New Zealand sample’s first-date question Exact eligible item/subgroup n unavailable. 2022 report; exact fieldwork dates and first-date item recall windows not supplied; eligibility required app activity in prior 12 months | Original source [S03] Report physical p.7, First Dates, second paragraph |
| Women: always plan how to leave if unsafe | 46% | Report-defined women in the New Zealand sample’s first-date question Exact eligible item/subgroup n unavailable. 2022 report; exact fieldwork dates and first-date item recall windows not supplied; eligibility required app activity in prior 12 months | Original source [S03] Report physical p.7, First Dates, second paragraph |
| Men: always plan how to leave if unsafe | 21% | Report-defined men in the New Zealand sample’s first-date question Exact eligible item/subgroup n unavailable. 2022 report; exact fieldwork dates and first-date item recall windows not supplied; eligibility required app activity in prior 12 months | Original source [S03] Report physical p.7, First Dates, second paragraph |
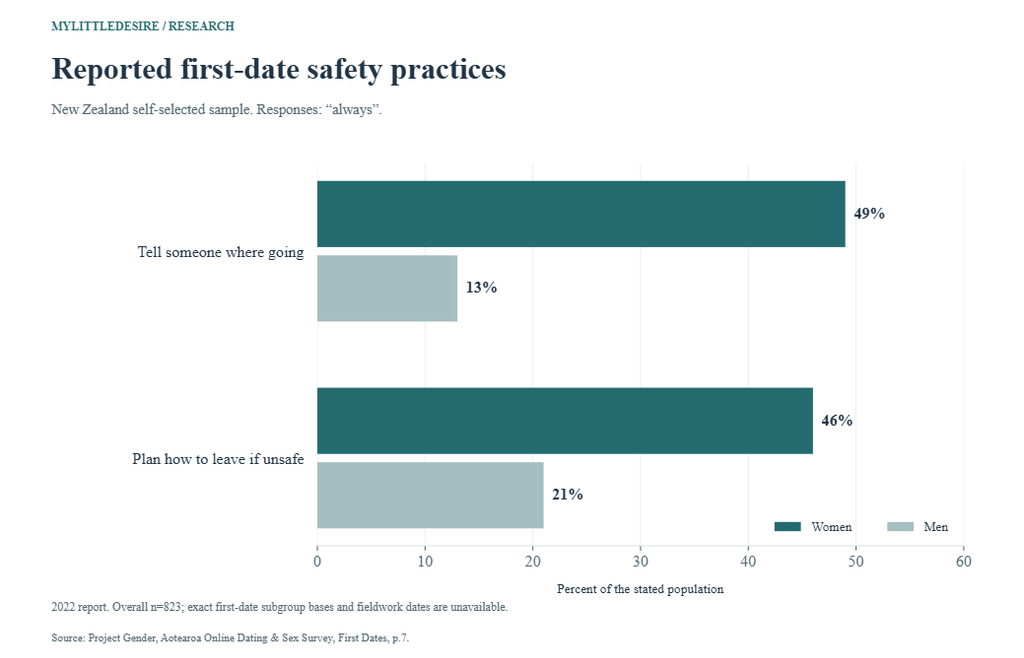
F04 Always telling someone where going and why, in the first-date section. Self-selected 823-person overall sample; exact eligible first-date subgroup n/recall windows unavailable. Describes the report’s respondents, not all New Zealand daters.
| Measure / group | Reported result | Population and actual period | Original source |
|---|---|---|---|
| Under 30 | 49% | New Zealand report’s first-date respondents, Under 30 Exact eligible item/subgroup n unavailable. 2022 report; exact fieldwork dates and first-date item recall windows not supplied; eligibility required app activity in prior 12 months | Original source [S03] Report physical p.7, First Dates, age paragraph |
| 50+ | 26% | New Zealand report’s first-date respondents, 50+ Exact eligible item/subgroup n unavailable. 2022 report; exact fieldwork dates and first-date item recall windows not supplied; eligibility required app activity in prior 12 months | Original source [S03] Report physical p.7, First Dates, age paragraph |
The “always” label matters. Someone who sometimes shares plans belongs outside that response category. The survey did not follow people to establish how much either practice changed their chance of harm.
What did a US poll find about feeling unsafe on first dates?
YouGov’s March 2019 table includes every adult respondent, including those who said the situation was not applicable. Retaining those responses makes the denominator visible and avoids silently rebasing the result to current daters.
F01 All-adult distribution for KYS_Q1_12. Not-applicable responses stay in the all-adult base. These are feelings, not counts of assaults. Rounded values total 101%.
| Measure / group | Reported result | Population and actual period | Original source |
|---|---|---|---|
| Always feel unsafe | 4% | US adults 18+, including respondents selecting not applicable Eligible n=1,206. 2019-03-19 to 2019-03-20 | Original source [S01] Original results PDF physical pp.12–13, KYS_Q1_12 total column |
| Often feel unsafe | 5% | US adults 18+, including respondents selecting not applicable Eligible n=1,206. 2019-03-19 to 2019-03-20 | Original source [S01] Original results PDF physical pp.12–13, KYS_Q1_12 total column |
| Sometimes feel unsafe | 12% | US adults 18+, including respondents selecting not applicable Eligible n=1,206. 2019-03-19 to 2019-03-20 | Original source [S01] Original results PDF physical pp.12–13, KYS_Q1_12 total column |
| Rarely feel unsafe | 15% | US adults 18+, including respondents selecting not applicable Eligible n=1,206. 2019-03-19 to 2019-03-20 | Original source [S01] Original results PDF physical pp.12–13, KYS_Q1_12 total column |
| Never feel unsafe | 18% | US adults 18+, including respondents selecting not applicable Eligible n=1,206. 2019-03-19 to 2019-03-20 | Original source [S01] Original results PDF physical pp.12–13, KYS_Q1_12 total column |
| Don’t know | 7% | US adults 18+, including respondents selecting not applicable Eligible n=1,206. 2019-03-19 to 2019-03-20 | Original source [S01] Original results PDF physical pp.12–13, KYS_Q1_12 total column |
| Not applicable: never in this situation | 40% | US adults 18+, including respondents selecting not applicable Eligible n=1,206. 2019-03-19 to 2019-03-20 | Original source [S01] Original results PDF physical pp.12–13, KYS_Q1_12 total column |
The published whole-number categories sum to 101% because of rounding. The table does not count dates, assaults or the number of times someone felt unsafe.
Who reported feeling unsafe on a first date in the New Zealand sample?
The same Project Gender report describes having felt unsafe on a first date across gender, sexuality and age groups. Its exact recall window and eligible item counts are not supplied. The results remain useful as dated responses within this self-selected sample.
F05 Report’s ‘have felt unsafe on a first date’ measure; exact item recall window not given. Self-selected 823-person overall sample; exact eligible first-date subgroup n/recall windows unavailable. Describes the report’s respondents, not all New Zealand daters. Feeling unsafe is not a sexual-assault measure.
| Measure / group | Reported result | Population and actual period | Original source |
|---|---|---|---|
| Straight women | 22% | New Zealand report’s first-date group: Straight women Exact eligible item/subgroup n unavailable. 2022 report; exact fieldwork dates and first-date item recall windows not supplied; eligibility required app activity in prior 12 months | Original source [S03] Report physical p.7, First Dates, third paragraph |
| Straight men | 3% | New Zealand report’s first-date group: Straight men Exact eligible item/subgroup n unavailable. 2022 report; exact fieldwork dates and first-date item recall windows not supplied; eligibility required app activity in prior 12 months | Original source [S03] Report physical p.7, First Dates, third paragraph |
| Lesbian/bisexual women | 29% | New Zealand report’s first-date group: Lesbian/bisexual women Exact eligible item/subgroup n unavailable. 2022 report; exact fieldwork dates and first-date item recall windows not supplied; eligibility required app activity in prior 12 months | Original source [S03] Report physical p.7, First Dates, third paragraph |
| Gay/bisexual men | 22% | New Zealand report’s first-date group: Gay/bisexual men Exact eligible item/subgroup n unavailable. 2022 report; exact fieldwork dates and first-date item recall windows not supplied; eligibility required app activity in prior 12 months | Original source [S03] Report physical p.7, First Dates, third paragraph |
F06 Report’s unsafe-first-date measure within the stated age groups. Self-selected 823-person overall sample; exact eligible first-date subgroup n/recall windows unavailable. Describes the report’s respondents, not all New Zealand daters. No causal age effect or significance test is added.
| Measure / group | Reported result | Population and actual period | Original source |
|---|---|---|---|
| Under 30 | 29% | New Zealand report’s first-date respondents, Under 30 Exact eligible item/subgroup n unavailable. 2022 report; exact fieldwork dates and first-date item recall windows not supplied; eligibility required app activity in prior 12 months | Original source [S03] Report physical p.7, First Dates, age paragraph |
| 50+ | 12% | New Zealand report’s first-date respondents, 50+ Exact eligible item/subgroup n unavailable. 2022 report; exact fieldwork dates and first-date item recall windows not supplied; eligibility required app activity in prior 12 months | Original source [S03] Report physical p.7, First Dates, age paragraph |
A difference in reported feelings does not show that age, gender or sexuality causes harm. It also cannot identify which precaution any respondent used before the experience.
What do UK records show about serious harm after first face-to-face meetings?
The National Crime Agency’s SCAS review is directly about first face-to-face meetings following online-dating contact. Its records concern sexual-assault cases referred for analysis over an extended historical period. The review does not include all UK incidents or all online-to-offline meetings.
F13 Case records occurring over the stated 2003–2021 interval, not all UK offenses. Referral coverage only. No count of all first meetings exists in this source; do not calculate risk per date.
| Measure / group | Reported result | Population and actual period | Original source |
|---|---|---|---|
| Reviewed first-face-to-face-meeting sexual-assault cases | 671 cases | Sexual-assault case records after first face-to-face meetings following initial contact through dating sites/apps Eligible n=671. Cases occurring 2003-04-01 to 2021-03-21; reviewed for the 2022 release | Original source [S06] Original release: SCAS review scope paragraph |
F14 Sex profile of victim records in the 671-case operational review. Case composition, not the probability that a person of any sex will be assaulted.
| Measure / group | Reported result | Population and actual period | Original source |
|---|---|---|---|
| Female victim records | 83% | Sexual-assault case records after first face-to-face meetings following initial contact through dating sites/apps Eligible n=671. Cases occurring 2003-04-01 to 2021-03-21; reviewed for the 2022 release | Original source [S06] Original release: 83%/17% profile paragraph |
| Male victim records | 17% | Sexual-assault case records after first face-to-face meetings following initial contact through dating sites/apps Eligible n=671. Cases occurring 2003-04-01 to 2021-03-21; reviewed for the 2022 release | Original source [S06] Original release: 83%/17% profile paragraph |
F15 Source-reported age-19-and-under share within the female/male victim-record groups. Age-specific record bases are unavailable here; includes younger people, not an adult-only dating sample. No all-date or population risk inference.
| Measure / group | Reported result | Population and actual period | Original source |
|---|---|---|---|
| Female victim records aged 19 and under | 22% | Female victim records in SCAS’s source-defined age analysis Exact eligible item/subgroup n unavailable. Cases occurring 2003-04-01 to 2021-03-21; reviewed for the 2022 release | Original source [S06] Original release: under-20 age-profile paragraph, updated review values |
| Male victim records aged 19 and under | 31% | Male victim records in SCAS’s source-defined age analysis Exact eligible item/subgroup n unavailable. Cases occurring 2003-04-01 to 2021-03-21; reviewed for the 2022 release | Original source [S06] Original release: under-20 age-profile paragraph, updated review values |
The case count provides evidence that serious harm has occurred after first meetings. It supplies no denominator of all first meetings, so it cannot be used to calculate the chance of assault on a first date. A case profile also cannot be turned into the probability of victimization for a demographic group.
What unwanted experiences can occur before an in-person date?
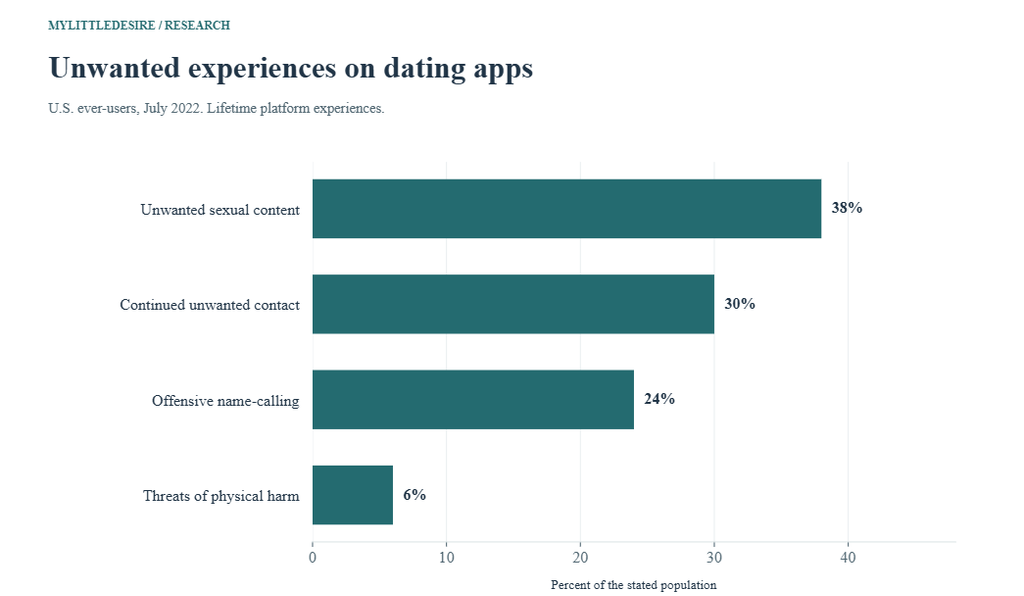
Pew asked dating-site/app ever-users whether someone had ever engaged in four unwanted behaviors on a platform. These experiences may precede a meeting, occur later, or happen without the people ever meeting.
F07 Lifetime platform experience among ever-users. Not restricted to first dates or in-person meetings. Categories overlap; the composite is not their sum.
| Measure / group | Reported result | Population and actual period | Original source |
|---|---|---|---|
| Unwanted sexual messages/images | 38% | US adults 18+ who had ever used a dating site or app Eligible n=3,128. 2022-07-05 to 2022-07-17; lifetime-ever experiences on platforms | Original source [S04] Article: harassment section; topline ONHARASS, 2022 column |
| Contact after saying not interested | 30% | US adults 18+ who had ever used a dating site or app Eligible n=3,128. 2022-07-05 to 2022-07-17; lifetime-ever experiences on platforms | Original source [S04] Article: harassment section; topline ONHARASS, 2022 column |
| Offensive name-calling | 24% | US adults 18+ who had ever used a dating site or app Eligible n=3,128. 2022-07-05 to 2022-07-17; lifetime-ever experiences on platforms | Original source [S04] Article: harassment section; topline ONHARASS, 2022 column |
| Threats of physical harm | 6% | US adults 18+ who had ever used a dating site or app Eligible n=3,128. 2022-07-05 to 2022-07-17; lifetime-ever experiences on platforms | Original source [S04] Article: harassment section; topline ONHARASS, 2022 column |
| Any of these four behaviors | 48% | US adults 18+ who had ever used a dating site or app Eligible n=3,128. 2022-07-05 to 2022-07-17; lifetime-ever experiences on platforms | Original source [S04] Article: harassment section; topline ONHARASS, 2022 column |
F08 Lifetime behavior-specific shares among women under 50 who had used dating platforms. Not first-date victimization. Exact age/gender subgroup answering n unavailable.
| Measure / group | Reported result | Population and actual period | Original source |
|---|---|---|---|
| Unwanted sexual messages/images | 56% | US women under 50 who had ever used dating sites/apps Exact eligible item/subgroup n unavailable. 2022-07-05 to 2022-07-17; lifetime-ever experiences on platforms | Original source [S04] Article: women-under-50 harassment paragraphs |
| Contact after saying not interested | 43% | US women under 50 who had ever used dating sites/apps Exact eligible item/subgroup n unavailable. 2022-07-05 to 2022-07-17; lifetime-ever experiences on platforms | Original source [S04] Article: women-under-50 harassment paragraphs |
| Offensive name-calling | 37% | US women under 50 who had ever used dating sites/apps Exact eligible item/subgroup n unavailable. 2022-07-05 to 2022-07-17; lifetime-ever experiences on platforms | Original source [S04] Article: women-under-50 harassment paragraphs |
| Threats of physical harm | 11% | US women under 50 who had ever used dating sites/apps Exact eligible item/subgroup n unavailable. 2022-07-05 to 2022-07-17; lifetime-ever experiences on platforms | Original source [S04] Article: women-under-50 harassment paragraphs |
F09 Lifetime platform experience among ever-users within LGB or straight groups. Subgroups can have different exposure histories. LGB identity is not necessarily same-sex partnering; subgroup n unavailable.
| Measure / group | Reported result | Population and actual period | Original source |
|---|---|---|---|
| LGB: unwanted sexual messages/images | 56% | US app/site ever-users: LGB respondents Exact eligible item/subgroup n unavailable. 2022-07-05 to 2022-07-17; lifetime-ever experiences on platforms | Original source [S04] Article: sexual-orientation harassment comparison |
| Straight: unwanted sexual messages/images | 34% | US app/site ever-users: straight respondents Exact eligible item/subgroup n unavailable. 2022-07-05 to 2022-07-17; lifetime-ever experiences on platforms | Original source [S04] Article: sexual-orientation harassment comparison |
| LGB: continued unwanted contact | 42% | US app/site ever-users: LGB respondents Exact eligible item/subgroup n unavailable. 2022-07-05 to 2022-07-17; lifetime-ever experiences on platforms | Original source [S04] Article: sexual-orientation harassment comparison |
| Straight: continued unwanted contact | 28% | US app/site ever-users: straight respondents Exact eligible item/subgroup n unavailable. 2022-07-05 to 2022-07-17; lifetime-ever experiences on platforms | Original source [S04] Article: sexual-orientation harassment comparison |
| LGB: offensive name-calling | 33% | US app/site ever-users: LGB respondents Exact eligible item/subgroup n unavailable. 2022-07-05 to 2022-07-17; lifetime-ever experiences on platforms | Original source [S04] Article: sexual-orientation harassment comparison |
| Straight: offensive name-calling | 22% | US app/site ever-users: straight respondents Exact eligible item/subgroup n unavailable. 2022-07-05 to 2022-07-17; lifetime-ever experiences on platforms | Original source [S04] Article: sexual-orientation harassment comparison |
The composite for any of the four behaviors is a published finding. Adding the four behavior percentages would count some people repeatedly. The comparisons by orientation describe respondent identity, rather than only same-sex relationships.
What does the Australian five-year dating-app safety study show?
The Australian Institute of Criminology surveyed adults who had used dating platforms in the previous five years. Its original methods describe adjusted proportional quota sampling, a nonprobability approach. The source measures experiences across that period and does not restrict them to first dates.
F10 At least one report-defined online or in-person behavior in the previous five years. Online/in-person experiences overlap. Nonprobability quota sample. Full sample denominators retain missing/unsure responses; not a per-date probability.
| Measure / group | Reported result | Population and actual period | Original source |
|---|---|---|---|
| Any online harassment, aggression or violence | 72.3% | Australian adults 18+ who had used dating apps/websites in the previous five years Eligible n=9,987. 2021-06-23 to 2021-08-09 fieldwork; previous five years of experience | Original source [S05] Report printed pp.10 and 17–18; overall narrative and Table 7 (n=9,987) |
| Any in-person harassment, aggression or violence | 34.0% | Australian adults 18+ who had used dating apps/websites in the previous five years Eligible n=9,987. 2021-06-23 to 2021-08-09 fieldwork; previous five years of experience | Original source [S05] Report printed pp.20–21 and 26–27; overall narrative/Table 13 |
F11 Source-defined category and selected component behaviors in a five-year recall period. Not restricted to first dates. Components overlap with their composite. N=9,987 includes non-disclosures; self-reports are not forensic or legal determinations.
| Measure / group | Reported result | Population and actual period | Original source |
|---|---|---|---|
| Any source-defined sexual assault/coercion | 27.3% | Australian adults 18+ who had used dating apps/websites in the previous five years Eligible n=9,987. 2021-06-23 to 2021-08-09 fieldwork; previous five years of experience | Original source [S05] Report printed p.22, Table 9, total column; physical PDF p.36 |
| Verbal pressure for unwanted sexual acts | 22.0% | Australian adults 18+ who had used dating apps/websites in the previous five years Eligible n=9,987. 2021-06-23 to 2021-08-09 fieldwork; previous five years of experience | Original source [S05] Report printed p.22, Table 9, total column; physical PDF p.36 |
| Attempted sexual act when respondent could not consent | 15.8% | Australian adults 18+ who had used dating apps/websites in the previous five years Eligible n=9,987. 2021-06-23 to 2021-08-09 fieldwork; previous five years of experience | Original source [S05] Report printed p.22, Table 9, total column; physical PDF p.36 |
| Used/threatened physical force for unwanted sexual acts | 13.0% | Australian adults 18+ who had used dating apps/websites in the previous five years Eligible n=9,987. 2021-06-23 to 2021-08-09 fieldwork; previous five years of experience | Original source [S05] Report printed p.22, Table 9, total column; physical PDF p.36 |
| Reported drink spiking to coerce a sexual act | 10.0% | Australian adults 18+ who had used dating apps/websites in the previous five years Eligible n=9,987. 2021-06-23 to 2021-08-09 fieldwork; previous five years of experience | Original source [S05] Report printed p.22, Table 9, total column; physical PDF p.36 |
F12 Selected online behaviors linked to someone met through a dating platform. Not confined to a first date. Same nonprobability sample as F10–F11; overlapping experiences with non-disclosures in the total denominator.
| Measure / group | Reported result | Population and actual period | Original source |
|---|---|---|---|
| Continued contact after declining a relationship | 47.3% | Australian adults 18+ who had used dating apps/websites in the previous five years Eligible n=9,987. 2021-06-23 to 2021-08-09 fieldwork; previous five years of experience | Original source [S05] Report printed p.12, Table 3, total column; physical PDF p.26 |
| Unwanted sexually explicit message | 47.2% | Australian adults 18+ who had used dating apps/websites in the previous five years Eligible n=9,987. 2021-06-23 to 2021-08-09 fieldwork; previous five years of experience | Original source [S05] Report printed p.12, Table 3, total column; physical PDF p.26 |
| Pressure to meet in person when unwilling | 34.5% | Australian adults 18+ who had used dating apps/websites in the previous five years Eligible n=9,987. 2021-06-23 to 2021-08-09 fieldwork; previous five years of experience | Original source [S05] Report printed p.12, Table 3, total column; physical PDF p.26 |
The in-person categories include overlapping behaviors and retain respondents who did not disclose an answer in their published denominators. The drink-spiking item is a source-specific self-report, rather than a toxicology-confirmed incidence measure. The study does not identify the relationship stage of every reported incident.
How safe did US adults consider an in-person online-dating meeting in 2026?
SSRS’s January 2026 survey provides a recent opinion snapshot. It asked how safe people thought it was to meet someone in person after first connecting through a dating site/app.
F16 Published SPOT15 combined safe/unsafe categories. Beliefs are not observed first-date safety outcomes. Preserve published combined values rather than adding separately rounded components.
| Measure / group | Reported result | Population and actual period | Original source |
|---|---|---|---|
| Very or somewhat safe | 57% | US adults 18+ asked about perceived safety of meeting an online-dating contact in person Eligible n=2,012. 2026-01-02 to 2026-01-04 and 2026-01-16 to 2026-01-20 | Original source [S07] Topline physical p.9, SPOT15, 2026 NET rows |
| Not too or not at all safe | 43% | US adults 18+ asked about perceived safety of meeting an online-dating contact in person Eligible n=2,012. 2026-01-02 to 2026-01-04 and 2026-01-16 to 2026-01-20 | Original source [S07] Topline physical p.9, SPOT15, 2026 NET rows |
F17 Share answering not too/not at all safe, within each gender group. Gender-specific bases and intervals unavailable; not an incident or assault probability.
| Measure / group | Reported result | Population and actual period | Original source |
|---|---|---|---|
| Women | 55% | US women ages 18+ Exact eligible item/subgroup n unavailable. 2026-01-02 to 2026-01-04 and 2026-01-16 to 2026-01-20 | Original source [S07] Original release: meeting-safety gender comparison |
| Men | 30% | US men ages 18+ Exact eligible item/subgroup n unavailable. 2026-01-02 to 2026-01-04 and 2026-01-16 to 2026-01-20 | Original source [S07] Original release: meeting-safety gender comparison |
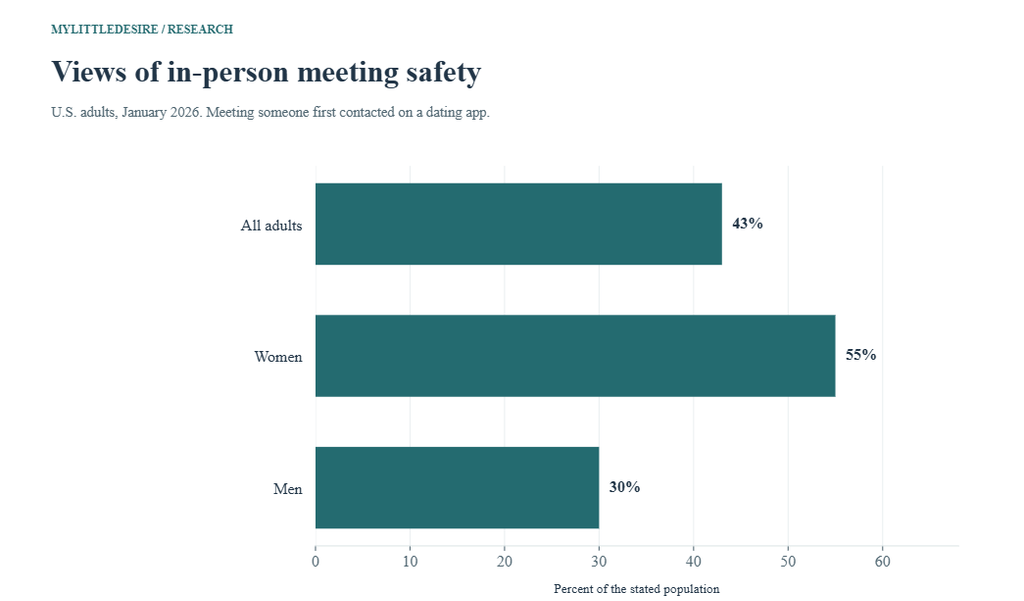
The published safe NET is retained as 57%. Its separately rounded safe categories sum to 58%, so reconstructing the combined figure would alter the published result. This opinion question does not identify the share of actual first meetings that ended safely.
What practical steps do specialist safety organizations suggest?
RAINN and the eSafety Commissioner recommend planning around privacy, public meeting places, trusted support and the ability to leave. Their guidance is separate from the survey statistics above.
- Choose a populated public place for an early meeting.
- Keep a way to travel home that you can use independently.
- Let a trusted person know the plan and arrange a check-in if useful.
- Protect your home address and other private details while trust develops.
- Use your own pace. Pressure to meet or do something sexual is a reason to pause or leave.
- Keep relevant profile/message evidence and use reporting tools when needed.
A profile badge, video call or background search cannot guarantee another person’s future behavior. If someone harms you, that responsibility belongs to them. See RAINN’s safer-dating guidance [G01] and the eSafety online-dating guide [G02] for the full advice.
Which comparisons can readers reproduce?
The differences below subtract percentages from compatible groups within one source. They use percentage points and add no new significance or causal tests. They do not estimate the effectiveness of a precaution.
| Comparison | First value | Second value | Difference | Qualification |
|---|---|---|---|---|
| NZ: always share plans, women minus men | 49% | 13% | +36 points | Descriptive difference in a self-selected sample; no significance or causal interpretation. |
| NZ: always have an exit plan, women minus men | 46% | 21% | +25 points | Descriptive difference in a self-selected sample; no significance or causal interpretation. |
| NZ: always share plans, under 30 minus 50+ | 49% | 26% | +23 points | Descriptive difference in a self-selected sample; no significance or causal interpretation. |
| NZ: have felt unsafe, under 30 minus 50+ | 29% | 12% | +17 points | Descriptive difference in a self-selected sample; no significance or causal interpretation. |
| NZ: have felt unsafe, lesbian/bisexual women minus straight women | 29% | 22% | +7 points | Descriptive difference in a self-selected sample; no significance or causal interpretation. |
| US Pew: unwanted sexual messages, LGB minus straight users | 56% | 34% | +22 points | Descriptive difference within the source; no new significance or causal test. |
| US Pew: continued unwanted contact, LGB minus straight users | 42% | 28% | +14 points | Descriptive difference within the source; no new significance or causal test. |
| US Pew: offensive names, LGB minus straight users | 33% | 22% | +11 points | Descriptive difference within the source; no new significance or causal test. |
| US SSRS: perceived unsafe meeting, women minus men | 55% | 30% | +25 points | Descriptive difference within the source; no new significance or causal test. |
Common questions about first-date safety statistics
What percentage of first dates are dangerous?
These sources do not establish a reliable universal percentage. Surveys of user experiences and operational records would need a compatible denominator of first dates to answer that question.
Does feeling unsafe mean someone was assaulted?
Feeling unsafe is an important experience in its own right. A survey of feelings measures something different from a report of a specific harmful act.
Can online harassment figures be described as first-date assault figures?
Online harassment can happen without any face-to-face meeting. Keep the platform, behavior and recall period attached to the original estimate.
Do safety preparations guarantee that a date will be safe?
No preparation can guarantee another person’s behavior. Plans can provide options and support, and responsibility for abuse remains with the person who commits it.
Why is 2027 in the title when some studies are older?
The year labels the editorial edition prepared in November 2026. Actual survey dates, historical case intervals and unavailable timing information are shown beside the findings.
Methodology, coverage and limitations
MyLittleDesire selected original questionnaires, research tables and first-party releases related to first-date attitudes, preparations, first meetings and broader dating-platform safety. It compiled published aggregates rather than collecting a new survey or reanalyzing respondent microdata. AI assisted retrieval, organization and drafting.
The 58 observations form 17 grouped findings from seven contributing research records. There are 24 first-date attitude/practice observations, five first-meeting case-review values, 25 broader app-experience values and four general meeting-safety opinion values. They include 57 percentages and one case count. Key cards, charts and nine derived differences repeat selected evidence and do not increase that count.
- Geography: evidence concerns the US, Great Britain, Australia, a self-selected New Zealand sample and UK operational records. No comparable Canadian first-date estimate was established.
- Sampling: probability-based panels, weighted online polls, a quota sample, a convenience sample and referred case records have different strengths and limits.
- Dates: 2021 fieldwork in a 2022 publication remains dated 2021. The NZ report does not supply precise fieldwork or first-date item recall dates.
- Missing information: unavailable subgroup bases and intervals remain unspecified. Whole-study totals are not substituted for item-specific bases.
- Interpretation: feelings, precautions, harassment, self-reported harmful acts and agency case records are never pooled into a single risk estimate.
Original sources and research notes
- S01. YouGov. US Omnibus Safety: KYS_Q1_12 first-date question. Publication: 2019-03-28 (article). Actual period: 2019-03-19 to 2019-03-20. Overall study/record n=1,206. Weighted online YouGov survey; all-adult published table for KYS_Q1_12, physical pp.12–13. Full survey included 551 men and 655 women, unweighted. An attitude-frequency question, not victimization. Not-applicable and don’t-know responses remain in the denominator. Rounded categories total 101%. Probability recruitment not established; no individual-date denominator. Supporting records: record 1.
- S02. YouGov. How comfortable would you be letting a first date know where you live?. Publication: 2022-12-20. Actual period: 2022-12-20. Overall study/record n=3,362. Original published YouGov Daily Question results, all-adult category shares. Comfort with disclosure is an attitude, not actual disclosure, crime incidence or a proven protective effect. Full study-specific recruitment/uncertainty details were not recovered.
- S03. Project Gender / Jennie Coker & Tania Domett. Aotearoa Online Dating & Sex Survey. Publication: 2022 report; exact PDF issue date unstated. Actual period: 2022 report; exact fieldwork dates and first-date item recall windows not supplied; eligibility required app activity in prior 12 months. Overall study/record n=823. Anonymous online survey promoted mainly through boosted Instagram posts/ads, with a prize draw. Original report’s First Dates section, physical p.7, and methods pp.2–3. Nonprobability convenience sample. Exact first-date item/subgroup bases, question text and recall windows are not provided. First-date percentages are source-reported subgroup findings, not representative New Zealand prevalence. Age/gender labels follow the report. Supporting records: record 1.
- S04. Pew Research Center. The experiences of U.S. online daters. Publication: 2023-02-02. Actual period: 2022-07-05 to 2022-07-17; lifetime-ever experiences on platforms. Overall study/record n=6,034. Weighted probability-based ATP/KnowledgePanel survey with LGB oversampling. Original article, topline and methods checked. Online experiences can happen before meeting or without ever meeting. Not first-date assault rates. Multiple behaviors overlap. Subgroup n and intervals not supplied beside selected findings; LGB refers to identity, not necessarily partner sex. Supporting records: record 1, record 2.
- S05. Australian Institute of Criminology / Wolbers, Boxall, Long & Gunnoo. Sexual harassment, aggression and violence victimisation among mobile dating app and website users in Australia. Publication: 2022-10-04. Actual period: 2021-06-23 to 2021-08-09 fieldwork; previous five years of experience. Overall study/record n=9,987. Roy Morgan Single Source, PureProfile and Dynata panels using adjusted proportional quotas. The original report explicitly describes nonprobability sampling. Selected values use published totals including missing/unsure responses. Not a probability sample or a per-first-date risk estimate. Events may occur in different relationship contexts. Behaviors/categories overlap. Self-reports are not police findings or toxicology confirmation. Some in-person items have about 1,500 non-disclosures retained in denominators. Supporting records: record 1.
- S06. National Crime Agency / Serious Crime Analysis Section. More under 20s sexually assaulted after meeting offenders on dating sites. Publication: 2022-02-24. Actual period: Cases occurring 2003-04-01 to 2021-03-21; reviewed for the 2022 release. Overall study/record n=671. Operational SCAS review of 671 cases referred to the NCA. Original release specifies first face-to-face meeting and referral coverage. No denominator of all first meetings or dates. Includes only records received and analyzed by SCAS, excluding unreported and unsubmitted cases. Case/victim-record profiles are not population risk or necessarily unique-person counts. Age-specific eligible record counts were not supplied in the release.
- S07. SSRS. The Public and Online Dating 2026. Publication: 2026-02-02. Actual period: 2026-01-02 to 2026-01-04 and 2026-01-16 to 2026-01-20. Overall study/record n=2,012. Probability-based SSRS Opinion Panel Omnibus, online/phone. SPOT15, original topline physical p.9 and release checked. Opinion, not measured chance of harm. Gender-specific bases/intervals unavailable. Preserve the published safe NET of 57%; separately rounded safe categories sum to 58%. Full-sample ±2.5-point margin does not apply to subgroups. Supporting records: record 1.
Practical guidance sources
- G01. RAINN: Tips for Safer Dating: Online & IRL. Reviewed November 2, 2026. Practical guidance, not a numeric observation source.
- G02. eSafety Commissioner: Online dating. Reviewed November 2, 2026. Practical privacy, reporting and first-meeting guidance.
How to cite this resource
MyLittleDesire. First Date Safety Statistics 2027. 2027 editorial edition; source review November 2, 2026. https://mylittledesire.com/first-date-safety-statistics/. When quoting a number, also identify its original source, population, measure and actual period.