Life changes can alter the people we rely on and the kind of help we need. This resource examines bereavement, early parenthood and retirement through original research. It separates personal support, professional access, workplace experiences and social participation, preserving the question behind each number.
There are 50 published observations in 15 groups from three studies, supported by four original charts and ten descriptive comparisons. Several observations are related categories or repeated-stage cells. They are not 50 independent studies, and they do not establish one overall rate of support during life changes.
72%
37%
of adult bereavement consultation respondents reported helpful support from a family member; n=1,119.Original source [S01]
in the selected bereavement-barrier group did not know what support was available or how to access it; n=281.Original source [S01]
23%
86.0%
of surveyed parents were reported as lacking a strong postnatal support network; exact item n unavailable.Original source [S02]
reported a lot of care/concern before pension start in a selected Taiwan cohort; not a global retirement rate.Original source [S03]
What counts as social support during a life change?
Support can mean someone who listens, help with practical tasks, understanding at work, or access to a professional service. Participation in groups can offer social contact, but it is not itself a measure of help received. Likewise, feeling lonely is different from lacking a support network. Keep these constructs separate when citing a finding.
| Transition / study | Coverage | Actual collection period | Full study unit |
|---|---|---|---|
| UK Commission on Bereavement [S01] | Adults who chose to respond to a consultation about a bereavement in the previous five years; selected employee and support-barrier subsets | Adult online consultation: September 2021–January 2022; adults bereaved in the preceding five years | 1,119 adult responses; separate child/organisational consultation strands are not used as adult observations. |
| NCT / Censuswide [S02] | Online survey of parents of children under five, including 500 pregnant respondents; selected postnatal questions do not have a printed exact item-valid base | September 5–16, 2025; retrospective early-postnatal questions among parents of children under five | 2,010 surveyed parents in demographic/methods section, including 500 currently pregnant; the report’s headline rounds this to 2,000. |
| Hsu, Huang & Hu / Frontiers in Psychology [S03] | Selected longitudinal participants age 50+ who first received a pension and completed all ten life-satisfaction items at three stages | Taiwan Longitudinal Study on Aging waves 1996–2015; pension-start cohorts 1999, 2003, 2007 and 2011 | 1,329 analytic participants; repeated stages are observations of a selected cohort, not three independent samples. |
This selection does not supply direct estimates for divorce, moving home, job loss, an illness diagnosis or the onset of caregiving. It should not be used as evidence for every kind of life transition. For broader personal networks, see our friendship statistics.
Also Read:-
Neighbor Relationships And Community Connection Statistics 2027
Online vs In Person Friendship Statistics 2027
Making Friends as an Adult Statistics 2027
Intergenerational Friendship Statistics 2027
Friendship After 50 Statistics 2027
Who provided support after a bereavement?
F01 Reported support that helped respondents cope, by selected personal source. Voluntary consultation, not national prevalence. Multiple support sources could be selected; do not add percentages.
| Measure / group | Published result | Population, period and reported base | Original source |
|---|---|---|---|
| Family member | 72% | Adults who chose to respond to a consultation about a bereavement in the previous five years; selected employee and support-barrier subsets Adult online consultation: September 2021–January 2022; adults bereaved in the preceding five years · Published selected-question/group base n=1,119 | Original source [S01] PDF page 29 (zero-based index 28), Sources of Support prose; base 1,119 |
| Friend | 53.3% | Adults who chose to respond to a consultation about a bereavement in the previous five years; selected employee and support-barrier subsets Adult online consultation: September 2021–January 2022; adults bereaved in the preceding five years · Published selected-question/group base n=1,119 | Original source [S01] PDF page 29 (zero-based index 28), Sources of Support prose; base 1,119 |
| Faith community | 11.3% | Adults who chose to respond to a consultation about a bereavement in the previous five years; selected employee and support-barrier subsets Adult online consultation: September 2021–January 2022; adults bereaved in the preceding five years · Published selected-question/group base n=1,119 | Original source [S01] PDF page 29 (zero-based index 28), Sources of Support prose; base 1,119 |
F02 Publisher-reported no-informal-support and no-family-support figures. Voluntary consultation, not national prevalence. Multiple support sources could be selected; do not add percentages. These are nested/different summaries, not additive. No informal support is not no help of any kind.
| Measure / group | Published result | Population, period and reported base | Original source |
|---|---|---|---|
| No support from any informal source | 17.8% | Adults who chose to respond to a consultation about a bereavement in the previous five years; selected employee and support-barrier subsets Adult online consultation: September 2021–January 2022; adults bereaved in the preceding five years · Published selected-question/group base n=1,119 | Original source [S01] PDF page 29, Sources of Support prose; base 1,119 |
| No support from family | 28% | Adults who chose to respond to a consultation about a bereavement in the previous five years; selected employee and support-barrier subsets Adult online consultation: September 2021–January 2022; adults bereaved in the preceding five years · Published selected-question/group base n=1,119 | Original source [S01] PDF page 29, Sources of Support prose; base 1,119 |
F03 Selected formal sources reported in the original adult consultation. Voluntary consultation, not national prevalence. Multiple support sources could be selected; do not add percentages.
| Measure / group | Published result | Population, period and reported base | Original source |
|---|---|---|---|
| Counsellor | 22% | Adults who chose to respond to a consultation about a bereavement in the previous five years; selected employee and support-barrier subsets Adult online consultation: September 2021–January 2022; adults bereaved in the preceding five years · Published selected-question/group base n=1,119 | Original source [S01] PDF page 125 (index 124), Access to formal emotional and psychological support prose; source question base on pages 29–30 |
| Bereavement charity | 20% | Adults who chose to respond to a consultation about a bereavement in the previous five years; selected employee and support-barrier subsets Adult online consultation: September 2021–January 2022; adults bereaved in the preceding five years · Published selected-question/group base n=1,119 | Original source [S01] PDF page 125 (index 124), Access to formal emotional and psychological support prose; source question base on pages 29–30 |
| GP/community healthcare professional | 13% | Adults who chose to respond to a consultation about a bereavement in the previous five years; selected employee and support-barrier subsets Adult online consultation: September 2021–January 2022; adults bereaved in the preceding five years · Published selected-question/group base n=1,119 | Original source [S01] PDF page 125 (index 124), Access to formal emotional and psychological support prose; source question base on pages 29–30 |
| Hospital/hospice healthcare professional | 12% | Adults who chose to respond to a consultation about a bereavement in the previous five years; selected employee and support-barrier subsets Adult online consultation: September 2021–January 2022; adults bereaved in the preceding five years · Published selected-question/group base n=1,119 | Original source [S01] PDF page 125 (index 124), Access to formal emotional and psychological support prose; source question base on pages 29–30 |
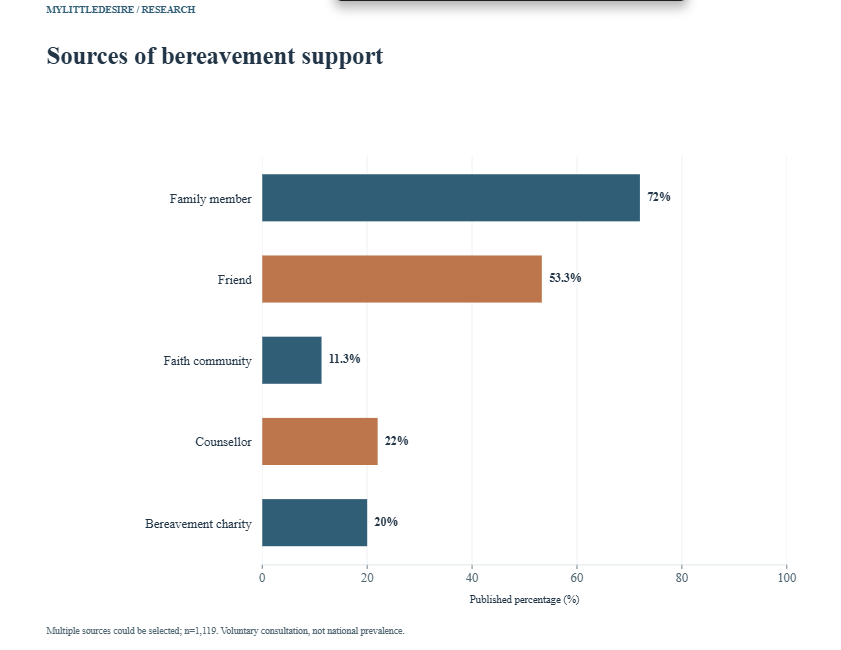
The bereavement figures come from people who chose to respond to a public consultation. They describe those responses, rather than the prevalence of support among all bereaved adults in the UK. A person could select several sources, including personal and professional help. A lack of informal support therefore does not imply a lack of support of every kind.
Only directly printed values are selected. The source also contains an ambiguously numbered donut and bars without precise labels. We do not name the numbered categories or infer exact percentages from bar lengths. The source’s no-friend-support prose also does not exactly complement its 53.3% friend-support figure; no revised percentage is invented.
How supported did bereaved employees feel?
F04 Four response categories on employer support during bereavement. Employee subset only, not all adult respondents or all UK employers. Original chart labels visually checked. Rounded categories total 100%.
| Measure / group | Published result | Population, period and reported base | Original source |
|---|---|---|---|
| Not at all supported | 16% | Adults who chose to respond to a consultation about a bereavement in the previous five years; selected employee and support-barrier subsets Adult online consultation: September 2021–January 2022; adults bereaved in the preceding five years · Published selected-question/group base n=697 | Original source [S01] PDF page 52 (index 51), Ratings of support from employers chart; n=697 |
| A little bit supported | 16% | Adults who chose to respond to a consultation about a bereavement in the previous five years; selected employee and support-barrier subsets Adult online consultation: September 2021–January 2022; adults bereaved in the preceding five years · Published selected-question/group base n=697 | Original source [S01] PDF page 52 (index 51), Ratings of support from employers chart; n=697 |
| Fairly well supported | 25% | Adults who chose to respond to a consultation about a bereavement in the previous five years; selected employee and support-barrier subsets Adult online consultation: September 2021–January 2022; adults bereaved in the preceding five years · Published selected-question/group base n=697 | Original source [S01] PDF page 52 (index 51), Ratings of support from employers chart; n=697 |
| Very well supported | 43% | Adults who chose to respond to a consultation about a bereavement in the previous five years; selected employee and support-barrier subsets Adult online consultation: September 2021–January 2022; adults bereaved in the preceding five years · Published selected-question/group base n=697 | Original source [S01] PDF page 52 (index 51), Ratings of support from employers chart; n=697 |
These employer ratings use a smaller base of 697 adults for whom the employee question was relevant. They are not ratings from the whole consultation sample or a survey of employers. The four named categories describe how respondents felt supported; they do not measure the effect of a particular bereavement-leave policy.
What prevented access to bereavement support?
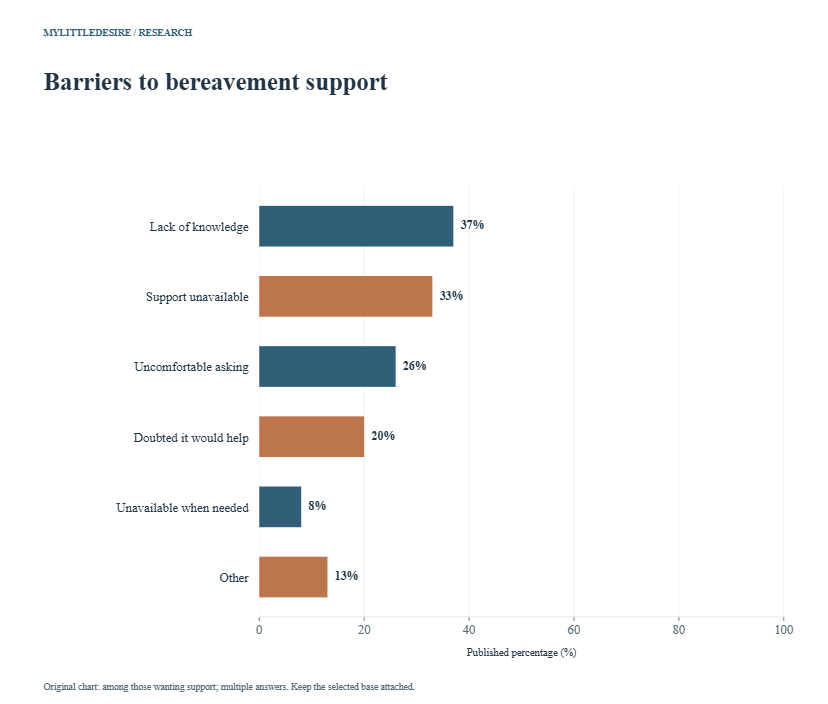
F05 Original chart: barriers among those who wanted support from bereavement services. Selected barrier-answering group n=281, not all 1,119 adults. Multiple answers; includes uncertainty about wanting help as described in surrounding prose. Bar labels read directly; do not sum.
| Measure / group | Published result | Population, period and reported base | Original source |
|---|---|---|---|
| Did not know what was available or how to access it | 37% | Adults who chose to respond to a consultation about a bereavement in the previous five years; selected employee and support-barrier subsets Adult online consultation: September 2021–January 2022; adults bereaved in the preceding five years · Published selected-question/group base n=281 | Original source [S01] PDF page 129 (index 128), Barriers to accessing support chart, printed n=281 |
| Needed support was unavailable | 33% | Adults who chose to respond to a consultation about a bereavement in the previous five years; selected employee and support-barrier subsets Adult online consultation: September 2021–January 2022; adults bereaved in the preceding five years · Published selected-question/group base n=281 | Original source [S01] PDF page 129 (index 128), Barriers to accessing support chart, printed n=281 |
| Uncomfortable asking for help | 26% | Adults who chose to respond to a consultation about a bereavement in the previous five years; selected employee and support-barrier subsets Adult online consultation: September 2021–January 2022; adults bereaved in the preceding five years · Published selected-question/group base n=281 | Original source [S01] PDF page 129 (index 128), Barriers to accessing support chart, printed n=281 |
| Did not believe support would help | 20% | Adults who chose to respond to a consultation about a bereavement in the previous five years; selected employee and support-barrier subsets Adult online consultation: September 2021–January 2022; adults bereaved in the preceding five years · Published selected-question/group base n=281 | Original source [S01] PDF page 129 (index 128), Barriers to accessing support chart, printed n=281 |
| Unavailable when needed | 8% | Adults who chose to respond to a consultation about a bereavement in the previous five years; selected employee and support-barrier subsets Adult online consultation: September 2021–January 2022; adults bereaved in the preceding five years · Published selected-question/group base n=281 | Original source [S01] PDF page 129 (index 128), Barriers to accessing support chart, printed n=281 |
| Other | 13% | Adults who chose to respond to a consultation about a bereavement in the previous five years; selected employee and support-barrier subsets Adult online consultation: September 2021–January 2022; adults bereaved in the preceding five years · Published selected-question/group base n=281 | Original source [S01] PDF page 129 (index 128), Barriers to accessing support chart, printed n=281 |
F06 Publisher’s unmet-support result for respondents who wanted formal support. Conditional percentage. Exact eligible n is not printed in this passage; the barrier-chart n=281 is not assigned. Not 42% of all bereaved UK adults.
| Measure / group | Published result | Population, period and reported base | Original source |
|---|---|---|---|
| Wanted formal support but did not receive it | 42% | Adults who chose to respond to a consultation about a bereavement in the previous five years; selected employee and support-barrier subsets Adult online consultation: September 2021–January 2022; adults bereaved in the preceding five years · Exact selected item/group n unavailable | Original source [S01] PDF page 129, opening prose, For those who wanted to access some form of formal support |
F07 Publisher-reported share experiencing more than one obstacle. Same selected barrier group n=281. Nested summary of obstacles, not an independent sample or additional obstacle category.
| Measure / group | Published result | Population, period and reported base | Original source |
|---|---|---|---|
| Experienced multiple obstacles | 31% | Adults who chose to respond to a consultation about a bereavement in the previous five years; selected employee and support-barrier subsets Adult online consultation: September 2021–January 2022; adults bereaved in the preceding five years · Published selected-question/group base n=281 | Original source [S01] PDF page 129, prose immediately below barrier chart; total n=281 |
Two denominators to keep separate. The barrier chart prints n=281. The separate statement that 42% of those wanting formal support did not receive it does not print an exact eligible base in the checked passage. We leave that base unknown rather than assigning the chart’s n=281.
Knowledge, availability, comfort asking, expected usefulness and timing are distinct barriers, and respondents could report more than one. Their percentages should not be added. The 31% multiple-obstacle summary is another view of the selected barrier group, not an additional independent sample.
What support gaps did parents report after birth?
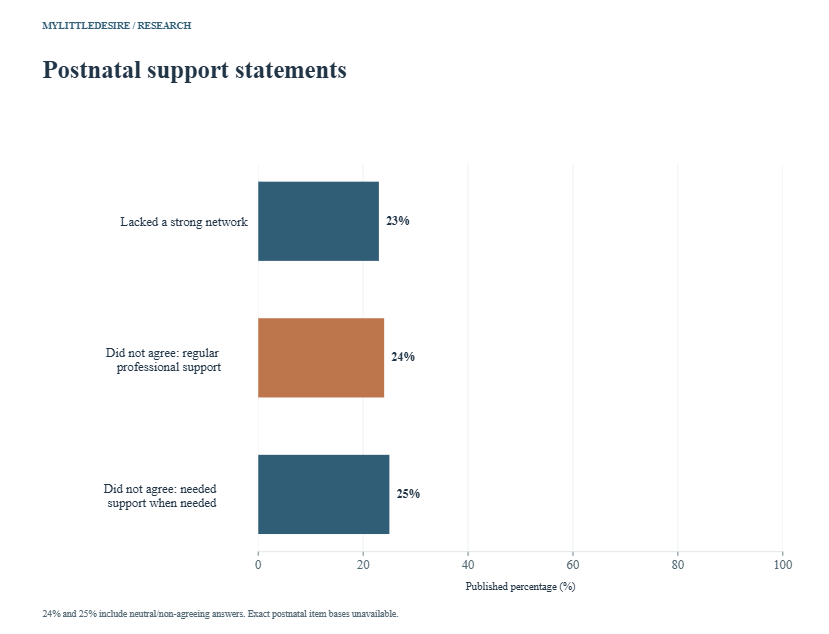
F08 Personal network and two separate professional-access statements. UK online parent survey; exact selected postnatal item n unavailable. Full study n=2,010 is not substituted. The 24% and 25% include everyone who did not strongly agree or agree, including neutral answers. Different constructs; do not add or rank as equivalent gaps.
| Measure / group | Published result | Population, period and reported base | Original source |
|---|---|---|---|
| Reported lacking a strong support network | 23% | Online survey of parents of children under five, including 500 pregnant respondents; selected postnatal questions do not have a printed exact item-valid base September 5–16, 2025; retrospective early-postnatal questions among parents of children under five · Exact selected item/group n unavailable | Original source [S02] PDF page 25, support-network and access prose; footnotes 43–44 on PDF page 34 |
| Did not agree they had regular professional support | 24% | Online survey of parents of children under five, including 500 pregnant respondents; selected postnatal questions do not have a printed exact item-valid base September 5–16, 2025; retrospective early-postnatal questions among parents of children under five · Exact selected item/group n unavailable | Original source [S02] PDF page 25, support-network and access prose; footnotes 43–44 on PDF page 34 |
| Did not agree they accessed needed support when needed | 25% | Online survey of parents of children under five, including 500 pregnant respondents; selected postnatal questions do not have a printed exact item-valid base September 5–16, 2025; retrospective early-postnatal questions among parents of children under five · Exact selected item/group n unavailable | Original source [S02] PDF page 25, support-network and access prose; footnotes 43–44 on PDF page 34 |
NCT’s methods section identifies 2,010 online respondents, including 500 who were pregnant at the time. The headline rounds the overall total to 2,000. Neither total is treated as the exact base for the selected postnatal questions. The report surveyed parents of children under five, so answers collected in 2025 can describe earlier births.
Read the access percentages precisely. Footnotes 43–44 define the 24% and 25% groups as respondents who did not strongly agree or agree with the statements. Neutral answers are included. Rewriting either figure as “disagreed,” “received no care” or “were denied support” would change the finding.
How did parents describe the first three months?
F09 Retrospective self-reported feelings during the first three months after the baby arrived. UK online parent survey; exact selected postnatal item n unavailable. Full study n=2,010 is not substituted. Sometimes/often/always NET contains always; never add these rows. These feelings are not clinical diagnoses or proof that support caused an outcome.
| Measure / group | Published result | Population, period and reported base | Original source |
|---|---|---|---|
| Sometimes, often or always | 62% | Online survey of parents of children under five, including 500 pregnant respondents; selected postnatal questions do not have a printed exact item-valid base September 5–16, 2025; retrospective early-postnatal questions among parents of children under five · Exact selected item/group n unavailable | Original source [S02] PDF page 25, first-three-months bullet list; NET definition in footnote 42 on PDF page 34 |
| Always | 12% | Online survey of parents of children under five, including 500 pregnant respondents; selected postnatal questions do not have a printed exact item-valid base September 5–16, 2025; retrospective early-postnatal questions among parents of children under five · Exact selected item/group n unavailable | Original source [S02] PDF page 25, first-three-months bullet list; NET definition in footnote 42 on PDF page 34 |
F10 Retrospective self-reported feelings during the first three months after the baby arrived. UK online parent survey; exact selected postnatal item n unavailable. Full study n=2,010 is not substituted. Sometimes/often/always NET contains always; never add these rows. These feelings are not clinical diagnoses or proof that support caused an outcome.
| Measure / group | Published result | Population, period and reported base | Original source |
|---|---|---|---|
| Sometimes, often or always | 87% | Online survey of parents of children under five, including 500 pregnant respondents; selected postnatal questions do not have a printed exact item-valid base September 5–16, 2025; retrospective early-postnatal questions among parents of children under five · Exact selected item/group n unavailable | Original source [S02] PDF page 25, first-three-months bullet list; NET definition in footnote 42 on PDF page 34 |
| Always | 22% | Online survey of parents of children under five, including 500 pregnant respondents; selected postnatal questions do not have a printed exact item-valid base September 5–16, 2025; retrospective early-postnatal questions among parents of children under five · Exact selected item/group n unavailable | Original source [S02] PDF page 25, first-three-months bullet list; NET definition in footnote 42 on PDF page 34 |
F11 Retrospective self-reported feelings during the first three months after the baby arrived. UK online parent survey; exact selected postnatal item n unavailable. Full study n=2,010 is not substituted. Sometimes/often/always NET contains always; never add these rows. These feelings are not clinical diagnoses or proof that support caused an outcome.
| Measure / group | Published result | Population, period and reported base | Original source |
|---|---|---|---|
| Sometimes, often or always | 69% | Online survey of parents of children under five, including 500 pregnant respondents; selected postnatal questions do not have a printed exact item-valid base September 5–16, 2025; retrospective early-postnatal questions among parents of children under five · Exact selected item/group n unavailable | Original source [S02] PDF page 25, first-three-months bullet list; NET definition in footnote 42 on PDF page 34 |
| Always | 11% | Online survey of parents of children under five, including 500 pregnant respondents; selected postnatal questions do not have a printed exact item-valid base September 5–16, 2025; retrospective early-postnatal questions among parents of children under five · Exact selected item/group n unavailable | Original source [S02] PDF page 25, first-three-months bullet list; NET definition in footnote 42 on PDF page 34 |
F12 Separate self-reported feelings in the first three months. UK online parent survey; exact selected postnatal item n unavailable. Full study n=2,010 is not substituted. Different feelings can overlap. No diagnosis, new combined rate or causal support effect.
| Measure / group | Published result | Population, period and reported base | Original source |
|---|---|---|---|
| Rarely or never felt confident | 16% | Online survey of parents of children under five, including 500 pregnant respondents; selected postnatal questions do not have a printed exact item-valid base September 5–16, 2025; retrospective early-postnatal questions among parents of children under five · Exact selected item/group n unavailable | Original source [S02] PDF page 25, first-three-months bullet list |
| Rarely or never felt calm | 17% | Online survey of parents of children under five, including 500 pregnant respondents; selected postnatal questions do not have a printed exact item-valid base September 5–16, 2025; retrospective early-postnatal questions among parents of children under five · Exact selected item/group n unavailable | Original source [S02] PDF page 25, first-three-months bullet list |
The first-three-months figures provide context for the parenthood transition. They are self-reported feelings, not diagnoses or estimates of the effect of social support. The sometimes/often/always summaries contain the always category, so the two rows should never be added together. Confidence and calm are separate feelings that can overlap.
Loneliness and support access should also remain separate. These aggregate figures do not show that the same respondents lacked networks and felt lonely, or that one caused the other. See our loneliness statistics for further distinctions between loneliness, contact and support.
What changed around the start of a pension?
F13 Publisher’s Family Support measure includes care and concern from family, relatives and friends. Selected Taiwan cohort, not all retirees or a global rate. Pension initiation defines the transition; work may continue. Exact item-valid n is not printed; full analytic n=1,329 stays separate. Stage categories and repeated observations are related. Original omnibus p=0.5; source does not report a statistically significant stage difference. No new pairwise significance test.
| Measure / group | Published result | Population, period and reported base | Original source |
|---|---|---|---|
| Pre-retirement — little/some | 14.0% | Selected longitudinal participants age 50+ who first received a pension and completed all ten life-satisfaction items at three stages; Pre-retirement Taiwan Longitudinal Study on Aging waves 1996–2015; pension-start cohorts 1999, 2003, 2007 and 2011 · Exact selected item/group n unavailable | Original source [S03] Original publisher Table 2, Family Support / Little/Some / Pre-retirement; published count (percentage) 181 (14.0) |
| Pension-start transition — little/some | 12.7% | Selected longitudinal participants age 50+ who first received a pension and completed all ten life-satisfaction items at three stages; Pension-start transition Taiwan Longitudinal Study on Aging waves 1996–2015; pension-start cohorts 1999, 2003, 2007 and 2011 · Exact selected item/group n unavailable | Original source [S03] Original publisher Table 2, Family Support / Little/Some / Transition; published count (percentage) 165 (12.7) |
| Post-transition — little/some | 12.4% | Selected longitudinal participants age 50+ who first received a pension and completed all ten life-satisfaction items at three stages; Post-transition Taiwan Longitudinal Study on Aging waves 1996–2015; pension-start cohorts 1999, 2003, 2007 and 2011 · Exact selected item/group n unavailable | Original source [S03] Original publisher Table 2, Family Support / Little/Some / Post-retirement; published count (percentage) 155 (12.4) |
| Pre-retirement — a lot | 86.0% | Selected longitudinal participants age 50+ who first received a pension and completed all ten life-satisfaction items at three stages; Pre-retirement Taiwan Longitudinal Study on Aging waves 1996–2015; pension-start cohorts 1999, 2003, 2007 and 2011 · Exact selected item/group n unavailable | Original source [S03] Original publisher Table 2, Family Support / A lot / Pre-retirement; published count (percentage) 1,116 (86.0) |
| Pension-start transition — a lot | 87.3% | Selected longitudinal participants age 50+ who first received a pension and completed all ten life-satisfaction items at three stages; Pension-start transition Taiwan Longitudinal Study on Aging waves 1996–2015; pension-start cohorts 1999, 2003, 2007 and 2011 · Exact selected item/group n unavailable | Original source [S03] Original publisher Table 2, Family Support / A lot / Transition; published count (percentage) 1,131 (87.3) |
| Post-transition — a lot | 87.6% | Selected longitudinal participants age 50+ who first received a pension and completed all ten life-satisfaction items at three stages; Post-transition Taiwan Longitudinal Study on Aging waves 1996–2015; pension-start cohorts 1999, 2003, 2007 and 2011 · Exact selected item/group n unavailable | Original source [S03] Original publisher Table 2, Family Support / A lot / Post-retirement; published count (percentage) 1,090 (87.6) |
F14 Participation in any listed community, religious, occupational, political, service, kinship, senior or study group. This is participation, not received help. Selected Taiwan cohort, not all retirees or a global rate. Pension initiation defines the transition; work may continue. Exact item-valid n is not printed; full analytic n=1,329 stays separate. Stage categories and repeated observations are related. Original omnibus p=0.3; source does not report a statistically significant stage difference. No new pairwise significance test.
| Measure / group | Published result | Population, period and reported base | Original source |
|---|---|---|---|
| Pre-retirement — no | 52.4% | Selected longitudinal participants age 50+ who first received a pension and completed all ten life-satisfaction items at three stages; Pre-retirement Taiwan Longitudinal Study on Aging waves 1996–2015; pension-start cohorts 1999, 2003, 2007 and 2011 · Exact selected item/group n unavailable | Original source [S03] Original publisher Table 2, Social activities / No / Pre-retirement; published count (percentage) 697 (52.4) |
| Pension-start transition — no | 49.7% | Selected longitudinal participants age 50+ who first received a pension and completed all ten life-satisfaction items at three stages; Pension-start transition Taiwan Longitudinal Study on Aging waves 1996–2015; pension-start cohorts 1999, 2003, 2007 and 2011 · Exact selected item/group n unavailable | Original source [S03] Original publisher Table 2, Social activities / No / Transition; published count (percentage) 661 (49.7) |
| Post-transition — no | 52.5% | Selected longitudinal participants age 50+ who first received a pension and completed all ten life-satisfaction items at three stages; Post-transition Taiwan Longitudinal Study on Aging waves 1996–2015; pension-start cohorts 1999, 2003, 2007 and 2011 · Exact selected item/group n unavailable | Original source [S03] Original publisher Table 2, Social activities / No / Post-retirement; published count (percentage) 698 (52.5) |
| Pre-retirement — yes | 47.6% | Selected longitudinal participants age 50+ who first received a pension and completed all ten life-satisfaction items at three stages; Pre-retirement Taiwan Longitudinal Study on Aging waves 1996–2015; pension-start cohorts 1999, 2003, 2007 and 2011 · Exact selected item/group n unavailable | Original source [S03] Original publisher Table 2, Social activities / Yes / Pre-retirement; published count (percentage) 632 (47.6) |
| Pension-start transition — yes | 50.3% | Selected longitudinal participants age 50+ who first received a pension and completed all ten life-satisfaction items at three stages; Pension-start transition Taiwan Longitudinal Study on Aging waves 1996–2015; pension-start cohorts 1999, 2003, 2007 and 2011 · Exact selected item/group n unavailable | Original source [S03] Original publisher Table 2, Social activities / Yes / Transition; published count (percentage) 668 (50.3) |
| Post-transition — yes | 47.5% | Selected longitudinal participants age 50+ who first received a pension and completed all ten life-satisfaction items at three stages; Post-transition Taiwan Longitudinal Study on Aging waves 1996–2015; pension-start cohorts 1999, 2003, 2007 and 2011 · Exact selected item/group n unavailable | Original source [S03] Original publisher Table 2, Social activities / Yes / Post-retirement; published count (percentage) 631 (47.5) |
F15 Participation in social services or voluntary activities. This is participation, not received help. Selected Taiwan cohort, not all retirees or a global rate. Pension initiation defines the transition; work may continue. Exact item-valid n is not printed; full analytic n=1,329 stays separate. Stage categories and repeated observations are related. Original omnibus p=0.11; source does not report a statistically significant stage difference. No new pairwise significance test.
| Measure / group | Published result | Population, period and reported base | Original source |
|---|---|---|---|
| Pre-retirement — no | 89.9% | Selected longitudinal participants age 50+ who first received a pension and completed all ten life-satisfaction items at three stages; Pre-retirement Taiwan Longitudinal Study on Aging waves 1996–2015; pension-start cohorts 1999, 2003, 2007 and 2011 · Exact selected item/group n unavailable | Original source [S03] Original publisher Table 2, Volunteering / No / Pre-retirement; published count (percentage) 1,187 (89.9) |
| Pension-start transition — no | 87.3% | Selected longitudinal participants age 50+ who first received a pension and completed all ten life-satisfaction items at three stages; Pension-start transition Taiwan Longitudinal Study on Aging waves 1996–2015; pension-start cohorts 1999, 2003, 2007 and 2011 · Exact selected item/group n unavailable | Original source [S03] Original publisher Table 2, Volunteering / No / Transition; published count (percentage) 1,160 (87.3) |
| Post-transition — no | 88.1% | Selected longitudinal participants age 50+ who first received a pension and completed all ten life-satisfaction items at three stages; Post-transition Taiwan Longitudinal Study on Aging waves 1996–2015; pension-start cohorts 1999, 2003, 2007 and 2011 · Exact selected item/group n unavailable | Original source [S03] Original publisher Table 2, Volunteering / No / Post-retirement; published count (percentage) 1,171 (88.1) |
| Pre-retirement — yes | 10.1% | Selected longitudinal participants age 50+ who first received a pension and completed all ten life-satisfaction items at three stages; Pre-retirement Taiwan Longitudinal Study on Aging waves 1996–2015; pension-start cohorts 1999, 2003, 2007 and 2011 · Exact selected item/group n unavailable | Original source [S03] Original publisher Table 2, Volunteering / Yes / Pre-retirement; published count (percentage) 134 (10.1) |
| Pension-start transition — yes | 12.7% | Selected longitudinal participants age 50+ who first received a pension and completed all ten life-satisfaction items at three stages; Pension-start transition Taiwan Longitudinal Study on Aging waves 1996–2015; pension-start cohorts 1999, 2003, 2007 and 2011 · Exact selected item/group n unavailable | Original source [S03] Original publisher Table 2, Volunteering / Yes / Transition; published count (percentage) 169 (12.7) |
| Post-transition — yes | 11.9% | Selected longitudinal participants age 50+ who first received a pension and completed all ten life-satisfaction items at three stages; Post-transition Taiwan Longitudinal Study on Aging waves 1996–2015; pension-start cohorts 1999, 2003, 2007 and 2011 · Exact selected item/group n unavailable | Original source [S03] Original publisher Table 2, Volunteering / Yes / Post-retirement; published count (percentage) 158 (11.9) |
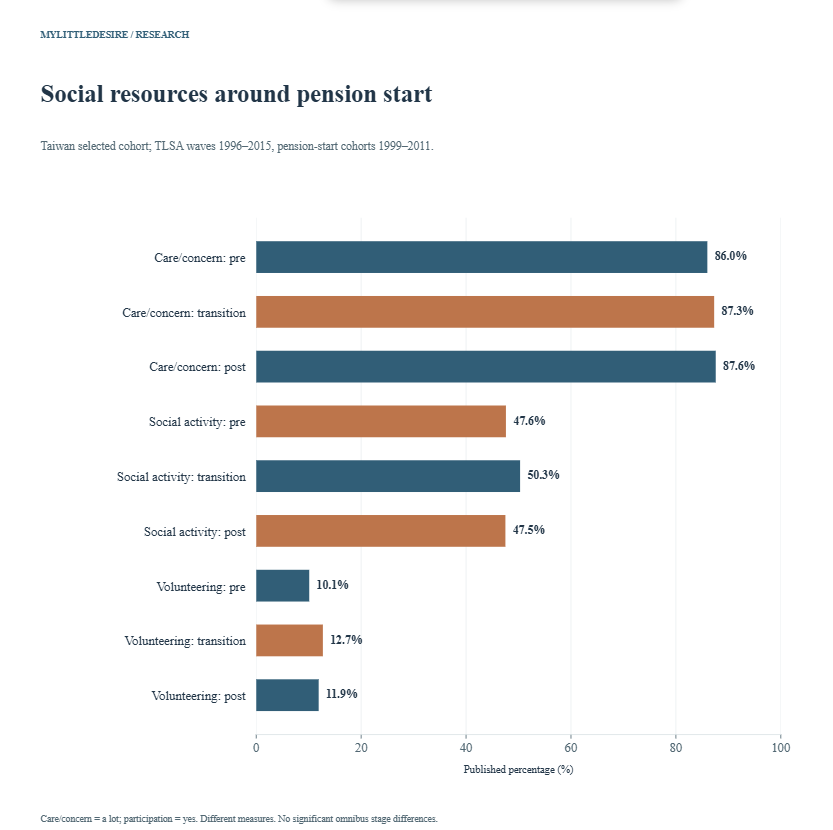
The Taiwan study follows a selected cohort through stages defined by starting to receive a pension. It is not a study in which everyone stopped working. The publisher’s Family Support measure includes care and concern from relatives and friends as well as family. Social-group participation and volunteering are separate measures of engagement.
Although the percentages vary across stages, the original omnibus tests did not find statistically significant stage differences for these three resources: p=0.5 for family support, p=0.3 for social activities and p=0.11 for volunteering. We retain those limits and perform no new pairwise tests. The descriptive gaps do not show that retirement increased support.
The analytic sample of 1,329 is distinct from valid-answer counts for resource items. Table 2 includes category counts that reveal missingness for some resources. Exact item denominators are not printed separately and are left unknown. The repeated stages are related observations from a selected cohort, not independent samples of all retirees.
Ten reproducible descriptive comparisons
Each calculation subtracts a second published percentage from a first and reports percentage points. Inputs stay within a study and compatible construct. The workbook uses stable observation IDs, unit checks and construct checks. A numerical difference is not a new significance test or evidence of causation.
| ID | Comparison | First | Second | Difference | Qualification |
|---|---|---|---|---|---|
| C01 | Bereavement source: family minus friend | 72% | 53.3% | +18.7 percentage points | Multiple-response personal sources, not exclusive categories. Rounded published inputs; no new significance test. |
| C02 | Formal source: counsellor minus bereavement charity | 22% | 20% | +2 percentage points | Multiple-response formal sources; not effectiveness. Rounded published inputs; no new significance test. |
| C03 | Employer support: very well minus not at all | 43% | 16% | +27 percentage points | Employee subset n=697, not all respondents. Rounded published inputs; no new significance test. |
| C04 | Employer support: fairly well minus a little bit | 25% | 16% | +9 percentage points | Separate employer rating categories. Rounded published inputs; no new significance test. |
| C05 | Barrier: lack of knowledge minus unavailable support | 37% | 33% | +4 percentage points | Barrier group n=281; multiple responses. Rounded published inputs; no new significance test. |
| C06 | Barrier: uncomfortable asking minus doubt support would help | 26% | 20% | +6 percentage points | Barrier group n=281; multiple responses. Rounded published inputs; no new significance test. |
| C07 | Postnatal loneliness: sometimes/often/always NET minus always | 62% | 12% | +50 percentage points | Always is contained within the NET. This is a nested-category difference, not independent evidence or a clinical outcome. Rounded published inputs; no new significance test. |
| C08 | Care/concern a lot: post-transition minus pre-retirement | 87.6% | 86.0% | +1.6 percentage points | Pension-defined stages; repeated selected cohort. Original omnibus p=0.5, not significant. Rounded published inputs; no new significance test. |
| C09 | Social activity yes: transition minus pre-retirement | 50.3% | 47.6% | +2.7 percentage points | Participation, not received support. Original omnibus p=0.3, not significant. Rounded published inputs; no new significance test. |
| C10 | Volunteering yes: post-transition minus pre-retirement | 11.9% | 10.1% | +1.8 percentage points | Participation, not received support. Original omnibus p=0.11, not significant. Rounded published inputs; no new significance test. |
Common questions
Is there one percentage for support during all life changes?
No. The selected studies cover different transitions, populations and support measures. No pooled rate is calculated.
Are the bereavement consultation figures national UK prevalence?
No. They describe voluntary consultation responses. The employee and barrier questions also use smaller selected groups.
Does the 42% unmet-support figure use the barrier chart’s base?
The checked passage does not confirm that denominator. Its exact eligible n remains unknown.
Do the parent support-access figures mean people received no care?
No. The 24% and 25% include everyone who did not strongly agree or agree, including neutral answers.
Are the postnatal feelings clinical diagnoses?
No. They are retrospective self-reports about frequency of feelings in the first three months.
Does the retirement study define retirement as stopping work?
No. It identifies transition through starting pension receipt. Some participants continued to work.
Did the study find significant increases in these retirement resources?
No. Original omnibus p-values for the three selected resource measures exceeded 0.05. No new pairwise tests are performed here.
Research method and limitations
Selection and concentration. There are 50 observations in 15 groups: 21 from the UK bereavement consultation, 11 from NCT’s parent survey and 18 from the Taiwan cohort article. That is three studies, not 50. Categories, nested summaries, repeated stages and chart/comparison inputs are related. MyLittleDesire conducted no survey.
Verification. Selected UKCB prose and named chart labels were checked in the original full PDF. NCT’s original linked PDF, survey demographics and qualifying footnotes were checked. Taiwan Table 2 was independently parsed from the original publisher XML, with definitions and selection checked in the article. This is an audit of published aggregates, not respondent records.
Bases and uncertainty. Twenty rows retain a published selected-question/group base. Thirty selected item bases remain unknown, including the conditional bereavement result, all selected NCT questions and all selected Taiwan resource cells. All 50 weighted-base counts and selected confidence intervals are unavailable. Unknown values remain null or blank. Full study samples stay separate; no new counts or intervals are reconstructed.
Comparability. Multiple-response sources and barriers overlap. Neutral/non-agreeing parent answers are not rewritten as disagreement. Nested feeling categories are not added. Pension initiation differs from work cessation; care/concern differs from participation. Actual fieldwork, retrospective windows and original nonsignificant tests remain visible. No world rate, country ranking, causal claim, clinical diagnosis or 2027 fieldwork is inferred.
Original sources
- UK Commission on Bereavement. Bereavement is everyone’s business [S01]
Published: October 6, 2022. Actual collection: Adult online consultation: September 2021–January 2022; adults bereaved in the preceding five years.
Population: Adults who chose to respond to a consultation about a bereavement in the previous five years; selected employee and support-barrier subsets.
Full sample: 1,119. 1,119 adult responses; separate child/organisational consultation strands are not used as adult observations.
Bases: Twenty selected rows retain a printed base: sources n=1,119, employer ratings n=697, barrier questions n=281. The separate 42% unmet-formal-support figure has no exact eligible n stated in the checked passage; it is not assigned 281 or 1,119.
Method: Voluntary online public consultation with descriptive analysis, alongside other evidence strands. Selected adult figures checked in the original full PDF, including visually reading chart labels. No probability-sample recruitment or population weighting established for these observations.
Limits: Consultation responses are not a rate for all bereaved UK adults. Sources and obstacles are multiple-response. Do not estimate bar heights. Do not interpret an unlabeled 1–4 donut as named support categories. Keep no informal support separate from no support of any kind. A prose friends-no-support figure does not complement 53.3% exactly and is withheld. Exact item base for unmet formal support is unavailable.
Supporting record 1 · Supporting record 2 - NCT / Censuswide. From expectation to reality: Parents’ experiences of pregnancy, birth, and life with a newborn [S02]
Published: 2026 report; launch January 19, 2026; linked PDF in February 2026 directory. Actual collection: September 5–16, 2025; retrospective early-postnatal questions among parents of children under five.
Population: Online survey of parents of children under five, including 500 pregnant respondents; selected postnatal questions do not have a printed exact item-valid base.
Full sample: 2,010. 2,010 surveyed parents in demographic/methods section, including 500 currently pregnant; the report’s headline rounds this to 2,000.
Bases: Exact selected postnatal item bases are not printed in the checked report. All eleven are left unknown; neither 2,010 nor 1,510 is substituted.
Method: Censuswide online UK survey commissioned by NCT. Demographics/methods and selected first-three-month and support questions checked in the original linked PDF. No published selected-item confidence intervals, weighted bases or representative quota/weighting claims adopted.
Limits: Retrospective experiences can concern earlier births, rather than births occurring in 2025. Negative support-access percentages include everyone who did not strongly agree or agree, including neutral answers; they are not necessarily disagreement or a complete absence of care. Sometimes/often/always NETs contain always. Self-reported feelings are not clinical diagnoses or effects caused by low support. Footnotes 43–44 qualify the professional-access figures.
Supporting record 1 · Supporting record 2 - Hsu, Huang & Hu / Frontiers in Psychology. Well-being trajectories and dynamic resource shifts in the transitions of retirement: a longitudinal study of Taiwanese older adults [S03]
Published: June 27, 2025. Actual collection: Taiwan Longitudinal Study on Aging waves 1996–2015; pension-start cohorts 1999, 2003, 2007 and 2011.
Population: Selected longitudinal participants age 50+ who first received a pension and completed all ten life-satisfaction items at three stages.
Full sample: 1,329. 1,329 analytic participants; repeated stages are observations of a selected cohort, not three independent samples.
Bases: Table 2 has an overall analytic heading n=1,329. Exact valid-answer denominators for the selected resource cells are not separately printed; all eighteen item bases remain unknown. Original category counts show resource missingness, so full analytic n is not substituted.
Method: Secondary longitudinal TLSA analysis. Retirement transition operationalised as beginning pension receipt, with prior non-pension status checked. Table 2 percentages and original count strings independently parsed from publisher XML; construct definitions and selection checked in the original article.
Limits: Pension initiation does not mean complete work cessation. Family Support includes care/concern from family, relatives and friends. Social activities and volunteering measure participation, not help received. Stage differences are descriptive and not causal retirement effects. Original omnibus p-values are 0.5 for family support, 0.3 for social activities and 0.11 for volunteering; these were not statistically significant. No pairwise significance tests or new intervals inferred.
Supporting record 1 · Supporting record 2
How to cite this resource
MyLittleDesire. Social Support During Life Changes Statistics 2027. https://mylittledesire.com/social-support-during-life-changes-statistics/.