
Grandparent–grandchild relationships include affection, everyday contact, practical help and, for some families, primary care. A useful statistic keeps those roles separate and makes clear whose experience was measured.
What do these grandparent statistics measure?
Check the relationship, age range, activity and unit before comparing two percentages.
| Term | Meaning | Related findings |
|---|---|---|
| Grandparent status | Whether the respondent reports a grandchild; treatment of step, adopted and great-grandchildren varies. | F01–F04, F16–F17, F49–F52 |
| Being in touch | Can combine in-person visits, phone calls and texts. | Pew contact measure, F05 |
| Seeing grandchildren | In-person seeing; Michigan’s multiple-grandchild prompt focuses on those seen most often. | F21 |
| Providing childcare | Looking after or babysitting grandchildren under the source’s age and frequency rules. | F10–F14, F18–F20, F29–F48 |
| Coresidence | Sharing the usual home; it does not itself establish custody or care responsibility. | F26, F52, F56 |
| Primary responsibility | A narrower care or parental-role definition, which differs across surveys and Census questions. | F27, F56 |
| Grandparent-headed home | Grandparent is the householder; many other coresident-grandparent homes have another householder. | F08–F09 |
| Multigenerational home | In the Canadian analysis, three or more generations of the same family live together. | F53–F55 |
Key grandparent–grandchild findings
70%
36%
Of US grandparents 65+ were in touch at least a few times a month.
Of US adults reporting a grandparent felt extremely or very close.
60%
18%
Of US respondents 50–94 reported a grandchild.
Saw under-18 grandchildren daily or almost daily.
8%
32%
Provided daily or near-daily care for under-18 grandchildren.
Provided financial support to under-18 grandchildren in the prior year.
52%
82%
Provided working-week childcare in the UK sample.
Enjoyed looking after grandchildren in the UK sample.
97%
19%
Enjoyed providing care in the Australian provider sample.
Of British adults believed grandparents have a duty to help with care.
6.7m
5%
US grandparents 30+ lived with an under-18 grandchild.
Of Canadian grandparents 45+ lived with a grandchild.
How common is grandparenthood, and how close are the relationships?
Pew’s 2026 analysis brings together several sources rather than one survey. Its contact findings concern grandparents 65+, while its closeness question asks adults who report having a grandparent. Contact frequency and emotional closeness answer different questions.
| ID | Finding and qualification | Population, actual period and base | Original source and locator |
|---|---|---|---|
| F01 | Grandparenthood was reported by 8% of adults 40–49, 27% at 50–59, 51% at 60–69, 68% at 70–79 and 74% at 80–90. Adults 30–39 were below 1%. Definition: Share within each age band under the SIPP question’s screening. Qualification: The screening requires reported biological parenthood; under-30 adults were not asked. These are cross-sectional ages, not an individual trajectory. | US adults in specified age groups United States 2024 SIPP reference year Exact eligible item/subgroup n is not printed beside these figures. An overall survey n is not automatically a routed item’s valid base. | Pew Research Center Published 2026-09-09 2026 analysis, age table and SIPP note. Study methods and limits |
| F02 | The average US grandparent was 68 years old in Pew’s SIPP analysis. Definition: Mean age, not the age when first becoming a grandparent. Qualification: This screened SIPP population differs from AARP or NPHA grandparent definitions. | Grandparents identified under the SIPP screening United States 2024 SIPP reference year Exact eligible item/subgroup n is not printed beside these figures. An overall survey n is not automatically a routed item’s valid base. | Pew Research Center Published 2026-09-09 2026 analysis, paragraph immediately before age chart. Study methods and limits |
| F03 | Grandparents averaged six grandchildren; 24% had one or two, 43% three to six, 19% seven to ten and 14% more than ten. Definition: Selected HRS grandparents with weights available by August 2026. Qualification: Primarily pre-2022 HRS participants born 1965 or earlier; some younger household partners can be included. Not all current grandparents of every age. | Selected HRS grandparent respondents United States March 2022–December 2023 HRS Exact eligible item/subgroup n is not printed beside these figures. An overall survey n is not automatically a routed item’s valid base. | Pew Research Center Published 2026-09-09 2026 analysis, HRS grandchild-count table and methods box. Study methods and limits |
| F04 | 21% reported that they or their spouse had provided at least 100 hours of grandchild or great-grandchild care over the previous two years; 79% reported less. Definition: Joint respondent/spouse retrospective two-year measure. Qualification: Caregivers missing an hour amount were excluded. Pandemic-period recall and joint care must not be turned into an average annual care amount for every grandparent. | HRS grandparents with a usable care-hour response United States March 2022–December 2023 interviews; preceding two years recalled Exact eligible item/subgroup n is not printed beside these figures. An overall survey n is not automatically a routed item’s valid base. | Pew Research Center Published 2026-09-09 2026 analysis, caregiving paragraphs after HRS count chart. Study methods and limits |
| F05 | Among grandparents 65+, 70% were in touch at least a few times a month, 41% at least a few times a week and 15% at least daily. The chart’s other categories were 27% a few times a week, 28% a few times a month, 10% once a month and 20% less often. Definition: Any in-person, phone or text contact; reported combined percentages retained. Qualification: Daily 15 plus a-few-times-weekly 27 rounds to 42, but Pew’s published weekly NET is 41. Keep the NET rather than replacing it. Exact grandparent valid n not printed. | US grandparents ages 65+; eligible n not supplied United States 2025-09-02 to 2025-09-08 Exact eligible item/subgroup n is not printed beside these figures. An overall survey n is not automatically a routed item’s valid base. | Pew Research Center Published 2026-09-09 2026 contact chart and published NET paragraph; 2025 topline p.12, FAMCONTACT. Study methods and limits |
| F06 | Among adults reporting a grandparent, 36% felt extremely or very close, 27% somewhat close and 38% not too or not at all close. Definition: Valid eligible respondents who did not say they had no grandparent; n=2,724. Qualification: Rounded groups total 101. Extremely plus very close also does not exactly reproduce the published NET. Not a contact-frequency or child-wellbeing measure. | US adult respondents reporting a grandparent; n=2,724 United States 2025-06-16 to 2025-06-29 Published input base(s): 2,724. An overall survey n is not automatically a routed item’s valid base. | Pew Research Center Published 2026-09-09 2026 analysis; June 2025 topline physical p.5, FAMCLSE_f. Study methods and limits |
| F07 | Extreme/very closeness to grandparents was 49% among Black adults, 36% Hispanic, 34% Asian and 32% White adults who reported a grandparent. Definition: Within each reported race/ethnicity group with a grandparent. Qualification: No causal explanation; subgroup valid n not supplied. The source reports no significant gender, age or income differences in this closeness measure. | US adults in specified race/ethnicity groups reporting a grandparent United States 2025-06-16 to 2025-06-29 Exact eligible item/subgroup n is not printed beside these figures. An overall survey n is not automatically a routed item’s valid base. | Pew Research Center Published 2026-09-09 2026 analysis, final demographic paragraph. Study methods and limits |
| F08 | 8% of children lived with a grandparent who was the household head. Definition: Grandparent-headed household definition, not every home containing a grandparent. Qualification: Do not label this all grandparent coresidence, primary care or custody. | US children in the ACS living-arrangement analysis United States 2024 ACS Exact eligible item/subgroup n is not printed beside these figures. An overall survey n is not automatically a routed item’s valid base. | Pew Research Center Published 2026-09-09 2026 analysis, ACS paragraph before contact chart. Study methods and limits |
| F09 | Within the grandparent-headed group, 48% lived with married grandparents, 43% with a grandmother without a spouse present and 9% with a grandfather without a spouse present. Definition: Household structure among children in grandparent-headed households. Qualification: These are shares within that child population, not the distribution of all grandparents. Other parents may be present. | Children living in grandparent-headed households United States 2024 ACS Exact eligible item/subgroup n is not printed beside these figures. An overall survey n is not automatically a routed item’s valid base. | Pew Research Center Published 2026-09-09 2026 analysis, same ACS household-structure paragraph. Study methods and limits |
ALSO READ:-
Singles And Singlehood Statistics 2027
Parent Adult Child Relationship Statistics 2027
Couples Money Management Statistics 2027
Cyberbullying And Online Social Relationships Statistics 2027
How does family proximity relate to grandchild care?
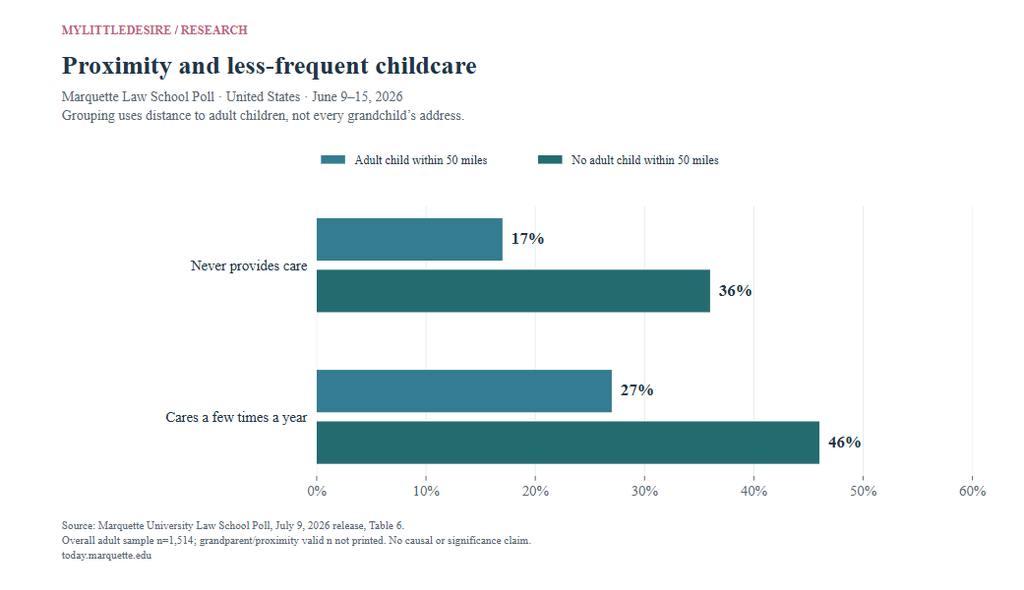
Grandparents with a nearby adult child were less likely to report never providing care. In Marquette’s June 2026 survey, the figures were 17% with an adult child within 50 miles and 36% with none nearby. This measures adult-child proximity and cannot identify a causal effect of distance.
| ID | Finding and qualification | Population, actual period and base | Original source and locator |
|---|---|---|---|
| F10 | Grandparents reported care at least monthly at 50%, a few times a year at 31% and never at 20%. Definition: Narrative’s at-least-monthly wording. Qualification: Rounded categories total 101. Tables 6/7 use “More than once a month”; that threshold difference is unresolved and disclosed. | US respondents with grandchildren; exact subset n unavailable United States 2026-06-09 to 2026-06-15 Exact eligible item/subgroup n is not printed beside these figures. An overall survey n is not automatically a routed item’s valid base. | Marquette University Law School Poll Published 2026-07-09 Original July release, grandchild-care overview before Table 5. Study methods and limits |
| F11 | Among the middle-generation parents asked about their own parents’ childcare, 38% reported at least monthly, 28% a few times a year and 34% never. Definition: Parent-report perspective, a different eligible group from grandparents reporting care. Qualification: Not linked grandparent–parent pairs. Do not subtract 38 from 50 as a measured reporting bias or unmet-care rate. | Middle-generation parents eligible for the grandparent-care item; exact valid n not printed United States 2026-06-09 to 2026-06-15 Exact eligible item/subgroup n is not printed beside these figures. An overall survey n is not automatically a routed item’s valid base. | Marquette University Law School Poll Published 2026-07-09 Original release, paragraph after grandparent-care overview. Study methods and limits |
| F12 | With an adult child within 50 miles, grandparents’ care-category percentages were 56% frequent, 27% a few times a year and 17% never; with no adult child within 50 miles they were 18%, 46% and 36%. Definition: Frequent is the table’s “More than once a month” category; distance is to adult children. Qualification: Narrative uses at least monthly; exact boundary unresolved. Proximity association is not causation, and this does not measure every grandchild’s address. | Grandparents with the specified adult-child proximity; subgroup n unavailable United States 2026-06-09 to 2026-06-15 Exact eligible item/subgroup n is not printed beside these figures. An overall survey n is not automatically a routed item’s valid base. | Marquette University Law School Poll Published 2026-07-09 Table 6, both distance rows. Study methods and limits |
| F13 | The frequent-care category was 47% at ages 40–49, 61% at 50–59, 56% at 60–69 and 41% at 70+. Definition: Source table category “More than once a month”. Qualification: Narrative uses at least monthly; retain table label. No within-person aging effect or significance test is inferred. | Grandparents by respondent age; valid age-group n not printed United States 2026-06-09 to 2026-06-15 Exact eligible item/subgroup n is not printed beside these figures. An overall survey n is not automatically a routed item’s valid base. | Marquette University Law School Poll Published 2026-07-09 Table 7, frequent-care column. Study methods and limits |
| F14 | Never providing grandchild care was reported by 24% of grandparents 40–49, 6% at 50–59, 16% at 60–69 and 28% at 70+. Definition: No reported care, not no contact with grandchildren. Qualification: Do not interpret no childcare as estrangement, unwillingness or lack of affection. | Grandparents by respondent age; valid age-group n not printed United States 2026-06-09 to 2026-06-15 Exact eligible item/subgroup n is not printed beside these figures. An overall survey n is not automatically a routed item’s valid base. | Marquette University Law School Poll Published 2026-07-09 Table 7, never-care column. Study methods and limits |
| F15 | 43% of parents had at least one grandchild. Definition: Denominator is parents, not all adults. Qualification: Includes parents too young to have grandchildren yet; not a population-wide grandparent prevalence estimate. | US adults who have children; exact valid n unavailable United States 2026-06-09 to 2026-06-15 Exact eligible item/subgroup n is not printed beside these figures. An overall survey n is not automatically a routed item’s valid base. | Marquette University Law School Poll Published 2026-07-09 Original release, introduction to Table 4. Study methods and limits |
What do grandparents do with and for their grandchildren?
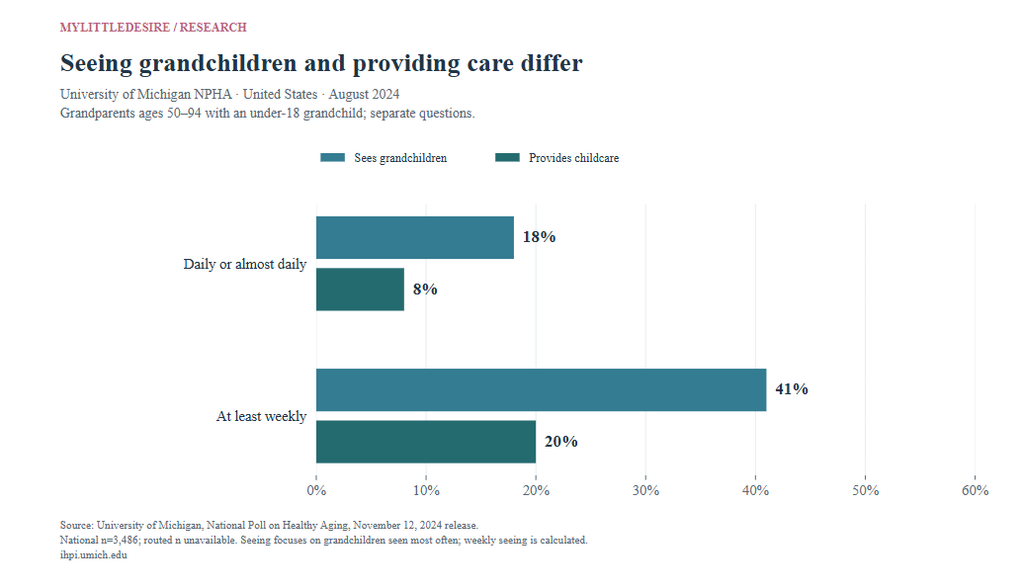
Seeing grandchildren happens more often than providing childcare at the displayed frequency thresholds. The University of Michigan’s August 2024 study also documents shared meals, financial help, shared homes and primary parental responsibility. Each uses its own eligible group.
| ID | Finding and qualification | Population, actual period and base | Original source and locator |
|---|---|---|---|
| F16 | 60% of adults 50–94 reported at least one grandchild, including step, adopted and great-grandchildren. Definition: Inclusive grandparent status among covered older adults. Qualification: Not comparable to a survey screened only through biological parenthood; not all US adult ages. | US adults ages 50–94, overall n=3,486 United States; only national estimates included 2024-08-05 to 2024-08-27 Published input base(s): 3,486. An overall survey n is not automatically a routed item’s valid base. | University of Michigan, National Poll on Healthy Aging Published 2024-11-12 University release, opening national-results paragraph. Study methods and limits |
| F17 | Grandparenthood was reported by 76% of respondents 65+ and 46% of those 50–64. Definition: Age-specific grandparent status; oldest surveyed age 94. Qualification: Cross-sectional cohorts; cannot infer that 30% of one group will become grandparents later. | US respondents ages 50–64 versus 65–94; valid subgroup n not printed United States; only national estimates included 2024-08-05 to 2024-08-27 Exact eligible item/subgroup n is not printed beside these figures. An overall survey n is not automatically a routed item’s valid base. | University of Michigan, National Poll on Healthy Aging Published 2024-11-12 Same national-results paragraph. Study methods and limits |
| F18 | 49% of grandparents with a grandchild under 18 provided care at least once every few months. Definition: Routed to grandparents with at least one under-18 grandchild. Qualification: Different from all grandparents, all adults or only regular childcare providers. | US grandparents 50–94 with grandchildren under 18 United States; only national estimates included 2024-08-05 to 2024-08-27 Exact eligible item/subgroup n is not printed beside these figures. An overall survey n is not automatically a routed item’s valid base. | University of Michigan, National Poll on Healthy Aging Published 2024-11-12 Caring for children section, first paragraph. Study methods and limits |
| F19 | 20% provided under-18 grandchild care at least weekly, including 8% daily or almost daily. Definition: Published weekly NET includes daily care. Qualification: Do not add 20 and 8. Care and seeing frequency are separate questions. | US grandparents 50–94 with grandchildren under 18 United States; only national estimates included 2024-08-05 to 2024-08-27 Exact eligible item/subgroup n is not printed beside these figures. An overall survey n is not automatically a routed item’s valid base. | University of Michigan, National Poll on Healthy Aging Published 2024-11-12 Caring for children section, second paragraph. Study methods and limits |
| F20 | Daily or near-daily care was 10% among grandparents 50–64 and 6% among those 65+. Definition: Under-18 care within each grandparent age group. Qualification: Reported association, not an effect of aging; subset n unavailable. | US grandparents with under-18 grandchildren, by grandparent age United States; only national estimates included 2024-08-05 to 2024-08-27 Exact eligible item/subgroup n is not printed beside these figures. An overall survey n is not automatically a routed item’s valid base. | University of Michigan, National Poll on Healthy Aging Published 2024-11-12 Caring for children section, age comparison. Study methods and limits |
| F21 | Seeing under-18 grandchildren was daily or almost daily for 18%, weekly for another 23%, once or twice monthly for 23%, and every few months or less for 36%. Definition: Published mutually exclusive seeing-frequency categories. Qualification: The extra 23% weekly excludes the daily group. Seeing is not the same measure as providing childcare. For multiple grandchildren, Q8 asks about those seen most often; the measure does not describe every grandchild equally. | US grandparents 50–94 with grandchildren under 18 United States; only national estimates included 2024-08-05 to 2024-08-27 Exact eligible item/subgroup n is not printed beside these figures. An overall survey n is not automatically a routed item’s valid base. | University of Michigan, National Poll on Healthy Aging Published 2024-11-12 Seeing grandchildren section, first paragraph. Study methods and limits |
| F22 | Hardly ever feeling isolated was reported by 78% of those seeing under-18 grandchildren daily or almost daily, versus 65% seeing them every few months or less. Definition: Self-reported isolation within seeing-frequency groups. Qualification: Cross-sectional association cannot establish that visits reduce loneliness. Health, distance and other factors may differ; most loneliness coverage belongs in the separate Loneliness Hub. | US grandparents 50–94 with under-18 grandchildren, by seeing frequency United States; only national estimates included 2024-08-05 to 2024-08-27 Exact eligible item/subgroup n is not printed beside these figures. An overall survey n is not automatically a routed item’s valid base. | University of Michigan, National Poll on Healthy Aging Published 2024-11-12 Seeing grandchildren section, isolation comparison. Study methods and limits |
| F23 | In the prior month, 61% shared a meal with grandchildren 1–17, 47% prepared food, 47% bought food and 36% cooked or baked with them. Definition: At least one activity in the prior month; grandchildren ages 1–17. Qualification: Activities overlap and do not measure diet quality, health improvement or weekly frequency. | US grandparents 50–94 with grandchildren ages 1–17 United States; only national estimates included 2024-08-05 to 2024-08-27 Exact eligible item/subgroup n is not printed beside these figures. An overall survey n is not automatically a routed item’s valid base. | University of Michigan, National Poll on Healthy Aging Published 2024-11-12 Eating with or cooking with grandchildren section. Study methods and limits |
| F24 | 32% helped support an under-18 grandchild financially in the prior year. Definition: Any financial support over the stated period. Qualification: Not an average dollar amount or a national total; no new economic extrapolation. | US grandparents 50–94 with grandchildren under 18 United States; only national estimates included 2024-08-05 to 2024-08-27 Exact eligible item/subgroup n is not printed beside these figures. An overall survey n is not automatically a routed item’s valid base. | University of Michigan, National Poll on Healthy Aging Published 2024-11-12 Paying for grandchildren’s expenses, first paragraph. Study methods and limits |
| F25 | 23% helped with day-to-day expenses, 10% education and 10% other major expenses such as camps, sports or daycare. Definition: Types of prior-year financial support; responses can overlap. Qualification: Do not sum categories to replace the published 32% any-support total. | US grandparents 50–94 with grandchildren under 18 United States; only national estimates included 2024-08-05 to 2024-08-27 Exact eligible item/subgroup n is not printed beside these figures. An overall survey n is not automatically a routed item’s valid base. | University of Michigan, National Poll on Healthy Aging Published 2024-11-12 Paying for grandchildren’s expenses, second paragraph. Study methods and limits |
| F26 | 6% of grandparents shared a home with a grandchild; the age-specific figures were 8% at 50–64 and 4% at 65+. Definition: Coresidence among all respondents with a grandchild. Qualification: Not limited to under-18 grandchildren; shared residence does not establish custody or primary care. | US grandparents ages 50–94; age groups as specified United States; only national estimates included 2024-08-05 to 2024-08-27 Exact eligible item/subgroup n is not printed beside these figures. An overall survey n is not automatically a routed item’s valid base. | University of Michigan, National Poll on Healthy Aging Published 2024-11-12 Living with grandchildren section, first paragraph. Study methods and limits |
| F27 | 3% had primary custody or parental responsibility for a grandchild 17 or younger; this was 6% at 50–64 and 1% at 65+. Definition: Primary custody or parental responsibility, not occasional babysitting. Qualification: Source does not establish the formal legal arrangement of every respondent or exact subgroup n. | All US grandparent respondents 50–94; age groups as specified United States; only national estimates included 2024-08-05 to 2024-08-27 Exact eligible item/subgroup n is not printed beside these figures. An overall survey n is not automatically a routed item’s valid base. | University of Michigan, National Poll on Healthy Aging Published 2024-11-12 Living with grandchildren section, second paragraph. |
| F28 | Daily or near-daily care of an under-18 grandchild was 15% among Hispanic grandparents, 9% non-Hispanic Black and 7% non-Hispanic White. Definition: Within each specified grandparent group with an under-18 grandchild. Qualification: National estimates; do not substitute the separate Michigan-only subgroup results. No causal cultural or ethnic explanation. | US grandparents 50–94 with under-18 grandchildren in specified race/ethnicity groups United States; only national estimates included 2024-08-05 to 2024-08-27 Exact eligible item/subgroup n is not printed beside these figures. An overall survey n is not automatically a routed item’s valid base. | University of Michigan, National Poll on Healthy Aging Published 2024-11-12 Caring for children section, national race/ethnicity paragraph. |
Can grandparents enjoy childcare and still feel pressure?
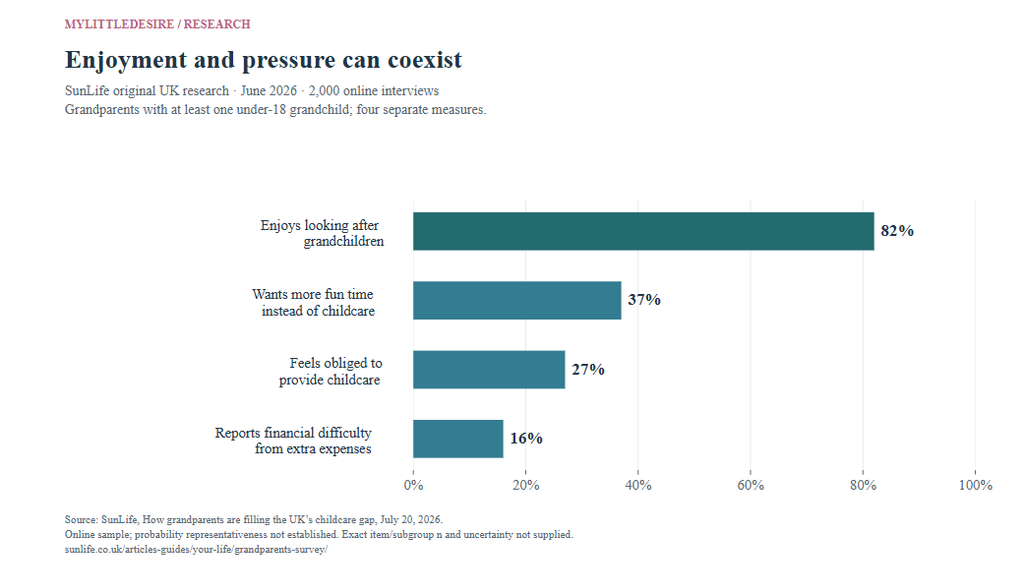
Yes, the measures can coexist. SunLife’s June 2026 UK respondents reported high enjoyment alongside wanting more fun time, feeling obliged and financial difficulty. The published margins do not identify the exact individuals who experienced both enjoyment and strain.
| ID | Finding and qualification | Population, actual period and base | Original source and locator |
|---|---|---|---|
| F29 | 52% provided childcare during the working week, rising to 66% among grandparents 35–44. Definition: UK online respondents with an under-18 grandchild; age subgroup versus full sample. Qualification: Nested group comparison, not two independent samples. Sampling/weighting details and subgroup n not supplied. | UK grandparents of under-18s; n=2,000 overall United Kingdom June 2026; clearly labeled 2024/2025 comparisons Published input base(s): 2,000. An overall survey n is not automatically a routed item’s valid base. | SunLife Published 2026-07-20 Working-week care section. |
| F30 | 56% helped during school holidays; 44% stepped back during that period. Definition: Holiday childcare, distinct from working-week childcare. Qualification: Do not combine with 52% weekday care to infer an overlap or year-round care population. | UK grandparents with at least one grandchild under 18 United Kingdom June 2026; clearly labeled 2024/2025 comparisons Exact eligible item/subgroup n is not printed beside these figures. An overall survey n is not automatically a routed item’s valid base. | SunLife Published 2026-07-20 Key findings and holiday-care paragraph. |
| F31 | 33% with preschool grandchildren provided more than ten weekly care hours, compared with 26% with secondary-school grandchildren. Overall, 5% provided more than 30 weekly hours. Definition: Weekly care-hour thresholds within stated groups. Qualification: Exact valid group bases and whether all grandparents or only providers enter each hour item are not fully specified; figures are retained as described, not reweighted. | Respondents in the stated grandchild-age/overall groups; exact item bases unavailable United Kingdom June 2026; clearly labeled 2024/2025 comparisons Exact eligible item/subgroup n is not printed beside these figures. An overall survey n is not automatically a routed item’s valid base. | SunLife Published 2026-07-20 Working-week care hours paragraphs. |
| F32 | The report put average annual childcare-related expenses at £1,659. Definition: Published annual expense average in nominal 2026 British pounds. Qualification: The exact contributing-item/eligible averaging base is not published. Do not extrapolate a national total, compare directly with US dollars or present financial advice. | SunLife’s eligible UK grandparent sample; averaging base not fully specified United Kingdom June 2026; clearly labeled 2024/2025 comparisons Exact eligible item/subgroup n is not printed beside these figures. An overall survey n is not automatically a routed item’s valid base. | SunLife Published 2026-07-20 Childcare expenses section, annual total. |
| F33 | 82% enjoyed looking after grandchildren, while 37% wished for more fun time instead of childcare; the latter was 17% in 2024. Definition: Separate attitudes that can coexist, with a labeled prior-wave comparison. Qualification: No individual overlap or satisfaction-minus-burden group is identified; earlier-wave field/design detail is limited. | Eligible UK grandparent respondents; subgroup/item n not supplied United Kingdom June 2026; clearly labeled 2024/2025 comparisons Exact eligible item/subgroup n is not printed beside these figures. An overall survey n is not automatically a routed item’s valid base. | SunLife Published 2026-07-20 Grandparents just want to have fun section. |
| F34 | 27% felt obliged to provide childcare, compared with 24% in 2025 and 9% in 2024. Definition: Self-reported obligation; not a legal obligation. Qualification: The source’s wording “up 3%” is treated as a three-percentage-point difference from 24 to 27, not a 3% relative rise. No new significance test. | Eligible UK grandparent respondents in the stated survey waves United Kingdom June 2026; clearly labeled 2024/2025 comparisons Exact eligible item/subgroup n is not printed beside these figures. An overall survey n is not automatically a routed item’s valid base. | SunLife Published 2026-07-20 Grandparents just want to have fun, obligation paragraph. |
| F35 | 16% reported financial difficulty associated with the extra expenses, versus 14% in 2025 and 11% in 2024. Definition: Self-reported difficulty attributed by respondents to grandchild expenses. Qualification: Not an experimentally identified financial effect or a poverty rate; wave comparability not fully documented. | Eligible UK grandparent respondents in the stated waves United Kingdom June 2026; clearly labeled 2024/2025 comparisons Exact eligible item/subgroup n is not printed beside these figures. An overall survey n is not automatically a routed item’s valid base. | SunLife Published 2026-07-20 Grandparents just want to have fun, financial-difficulty paragraph. |
| F36 | 33% changed their working pattern to provide childcare; among regular caregivers the figure was 43%. Definition: Broad reported working-pattern change; regular-care subset versus all eligible. Qualification: Nested groups; do not infer that the difference is the proportion forced out of work. | Eligible UK grandparents and the regular-care subset United Kingdom June 2026; clearly labeled 2024/2025 comparisons Exact eligible item/subgroup n is not printed beside these figures. An overall survey n is not automatically a routed item’s valid base. | SunLife Published 2026-07-20 Impact of childcare on working patterns section. |
| F37 | 23% felt children and grandchildren relied on them more than expected, versus 19% in 2025 and 13% in 2024. Definition: Perceived greater-than-expected reliance, not a count of dependent children. Qualification: Descriptive repeated-wave comparison; no tested increase or identical respondent panel is established. | Eligible UK grandparent respondents in stated waves United Kingdom June 2026; clearly labeled 2024/2025 comparisons Exact eligible item/subgroup n is not printed beside these figures. An overall survey n is not automatically a routed item’s valid base. | SunLife Published 2026-07-20 Grandparents just want to have fun, reliance paragraph. |
| F38 | 27% believed their children could not cope financially without their childcare help, versus 25% in 2025 and 18% in 2024. Definition: Grandparents’ belief about their children’s finances. Qualification: Not verified household insolvency or the share of all UK parents dependent on grandparent care. | Eligible UK grandparent respondents in stated waves United Kingdom June 2026; clearly labeled 2024/2025 comparisons Exact eligible item/subgroup n is not printed beside these figures. An overall survey n is not automatically a routed item’s valid base. | SunLife Published 2026-07-20 Grandparents just want to have fun, final paragraph. |
How do care purposes differ across grandchildren’s ages?
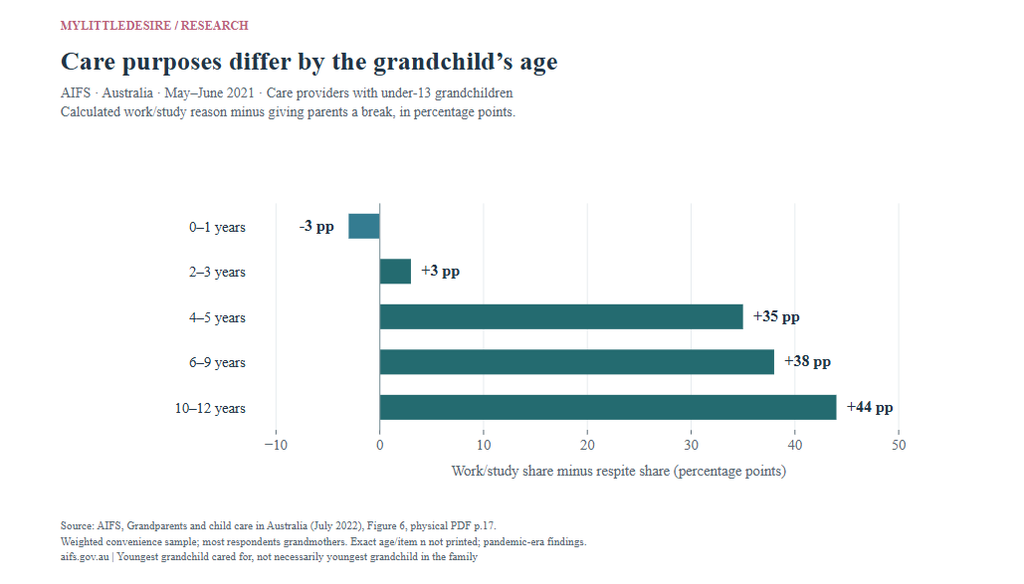
In the Australian study’s care-provider sample, support for parents’ work or study was selected more often than respite in every displayed group beyond the 0–1 age band. The calculated gaps below use matching age groups, retain the 2021 period and do not imply that the same family was followed as a child aged.
| ID | Finding and qualification | Population, actual period and base | Original source and locator |
|---|---|---|---|
| F39 | Among childcare providers, 62% provided occasional care, 39% regular care and 26% school-holiday care. Definition: Care types are multiple-response categories. Qualification: Percentages overlap. Not prevalence among all Australian grandparents or three mutually exclusive groups. | Australian convenience-sample grandparents providing care to an under-13 grandchild; item valid n not printed Australia 2021-05-19 to 2021-06-30 Exact eligible item/subgroup n is not printed beside these figures. An overall survey n is not automatically a routed item’s valid base. | Australian Institute of Family Studies Published July 2022; exact day not established Physical p.13, kinds of care. |
| F40 | Typical weekly care hours were up to five for 26%, five to nine for 20%, ten to nineteen for 24% and twenty or more for 21%; 9% reported zero or left the item incomplete. Definition: Published hour bands and combined zero/missing category. Qualification: Do not turn the combined 9% into a measured zero-care share or compute an exact mean from open/rounded bands. | Australian convenience-sample grandparents providing care to an under-13 grandchild; item valid n not printed Australia 2021-05-19 to 2021-06-30 Exact eligible item/subgroup n is not printed beside these figures. An overall survey n is not automatically a routed item’s valid base. | Australian Institute of Family Studies Published July 2022; exact day not established Physical p.13, care-hours paragraph. |
| F41 | Of providers caring for multiple grandchildren in a typical week, 72% cared for children from the same household and 28% from different households. Definition: Restricted to providers caring for more than one grandchild. Qualification: Not the proportion of all grandparents caring for several families. | Australian grandparent providers caring for multiple grandchildren in a typical week Australia 2021-05-19 to 2021-06-30 Exact eligible item/subgroup n is not printed beside these figures. An overall survey n is not automatically a routed item’s valid base. | Australian Institute of Family Studies Published July 2022; exact day not established Physical p.13, household-of-children paragraph. |
| F42 | Care supported parents’ work or study for 64%, other activities for 32%, respite for 45% and other reasons for 15%. Definition: Respondents could select more than one reason. Qualification: Not a partition of all care hours, and not evidence that caregiving increased employment. | Australian convenience-sample grandparents providing care to an under-13 grandchild; item valid n not printed Australia 2021-05-19 to 2021-06-30 Exact eligible item/subgroup n is not printed beside these figures. An overall survey n is not automatically a routed item’s valid base. | Australian Institute of Family Studies Published July 2022; exact day not established Physical p.16, reasons for providing care. |
| F43 | Work/study was a care reason for 57% with youngest cared-for grandchild 0–1, 56% at 2–3, 71% at 4–5, 71% at 6–9 and 75% at 10–12. Definition: Within each youngest-cared-for-grandchild age band. Qualification: Convenience sample; exact subgroup n not printed. Cross-sectional age groups, not the same family followed over time. | Australian convenience-sample grandparents providing care to an under-13 grandchild; item valid n not printed Australia 2021-05-19 to 2021-06-30 Exact eligible item/subgroup n is not printed beside these figures. An overall survey n is not automatically a routed item’s valid base. | Australian Institute of Family Studies Published July 2022; exact day not established Physical p.17, Figure 6; visual bar labels checked. |
| F44 | Giving parents a break was a care reason for 60% with youngest cared-for grandchild 0–1, 53% at 2–3, 36% at 4–5, 33% at 6–9 and 31% at 10–12. Definition: Same age-band definition as the work/study question. Qualification: Reasons overlap. Their difference describes marginal response shares, not mutually exclusive caregiver types. | Australian convenience-sample grandparents providing care to an under-13 grandchild; item valid n not printed Australia 2021-05-19 to 2021-06-30 Exact eligible item/subgroup n is not printed beside these figures. An overall survey n is not automatically a routed item’s valid base. | Australian Institute of Family Studies Published July 2022; exact day not established Physical p.17, Figure 6; visual bar labels checked. |
| F45 | 97% enjoyed providing care, 94% said it increased family connectedness and 86% said it added meaning to their lives. Definition: Agree or strongly agree among care providers. Qualification: Positive experiences can coexist with fatigue or pressure. Self-reported perceptions are not a causal wellbeing effect. | Australian convenience-sample grandparents providing care to an under-13 grandchild; item valid n not printed Australia 2021-05-19 to 2021-06-30 Exact eligible item/subgroup n is not printed beside these figures. An overall survey n is not automatically a routed item’s valid base. | Australian Institute of Family Studies Published July 2022; exact day not established Physical p.24, published combined agreement figures; Figure 10 on p.25. |
| F46 | 41% of non-providers wanted to care for grandchildren but could not; 28% of current providers wanted to care for other grandchildren but could not. Definition: Different eligible groups and partly different question wording. Qualification: Not the percentage of all grandparents denied contact or estranged; do not describe it as one universal unmet-care rate. | Australian grandparents with under-13 grandchildren, by current care status Australia 2021-05-19 to 2021-06-30 Exact eligible item/subgroup n is not printed beside these figures. An overall survey n is not automatically a routed item’s valid base. | Australian Institute of Family Studies Published July 2022; exact day not established Physical p.20, barriers introduction. |
| F47 | Within groups wanting some or additional care, relationship breakdown was a barrier for 30% of non-providers and 20% of providers. Definition: Selected subgroup already reporting a wish to provide care. Qualification: Not a population estrangement rate. Unreconciled distance-bar text in the same figure is withheld; these two relationship-breakdown bars match their text. | Australian grandparents wanting some/additional under-13 care Australia 2021-05-19 to 2021-06-30 Exact eligible item/subgroup n is not printed beside these figures. An overall survey n is not automatically a routed item’s valid base. | Australian Institute of Family Studies Published July 2022; exact day not established Physical p.21, Figure 9; both visual labels checked. |
| F48 | 22% found care difficult to manage alongside other responsibilities; 52% disagreed. For tiredness, 10% strongly agreed and 34% agreed; for being energized, 27% strongly agreed and 44% agreed. Definition: Agreement about the care provided; tiredness/energy are separate items. Qualification: Rounded categories and multiple experiences; no tired-and-energized overlap can be calculated. The calculated 44% tired/71% energized totals are not new clinical measures. | Australian convenience-sample grandparents providing care to an under-13 grandchild; item valid n not printed Australia 2021-05-19 to 2021-06-30 Exact eligible item/subgroup n is not printed beside these figures. An overall survey n is not automatically a routed item’s valid base. | Australian Institute of Family Studies Published July 2022; exact day not established Physical pp.24–26, Figure 10 and adjacent text. |
What do historical Canadian findings show about grandparenthood?
The 2017 Canadian findings show how grandparent numbers, ages, family size and shared homes can change in different ways. These observations remain useful as historical context; they are not current 2027 measurements.
| ID | Finding and qualification | Population, actual period and base | Original source and locator |
|---|---|---|---|
| F49 | Canada had 7.5 million grandparents 45+ in 2017, versus 7.0 million in 2011 and 5.4 million in 1995. Their share of people 45+ fell from 57% in 1995 to 47% in 2017. Definition: Counts and within-age population shares are distinct. Qualification: Historical survey waves; population counts can rise while the population share declines. Not a 2027 estimate. | Canadian grandparents/people 45+ in the GSS coverage Canada 2017 GSS on Family; explicitly historical 1995/2011 comparisons Exact eligible item/subgroup n is not printed beside these figures. An overall survey n is not automatically a routed item’s valid base. | Statistics Canada Published 2019-02-07 Original release, grandparent totals and population-share paragraphs. |
| F50 | Women first became grandparents at an average age of 51 and men at 54. Grandparents’ overall mean age was 68 in 2017, compared with 65 in 1995. Definition: First-grandparent age is a retrospective mean; current age is a separate measure. Qualification: Do not subtract current age from first-grandparent age as a matched duration or infer an individual effect. | Canadian grandparents 45+; first-grandparent age reported in 2017 Canada 2017 GSS on Family; explicitly historical 1995/2011 comparisons Exact eligible item/subgroup n is not printed beside these figures. An overall survey n is not automatically a routed item’s valid base. | Statistics Canada Published 2019-02-07 Average age and first-grandchild birth/adoption paragraphs. |
| F51 | Grandparents averaged four grandchildren in 2017, down from five in 1995. Definition: Mean grandchildren per grandparent 45+. Qualification: Different cohorts and historical waves; not a causal family-size prediction. | Canadian grandparents 45+ in stated GSS waves Canada 2017 GSS on Family; explicitly historical 1995/2011 comparisons Exact eligible item/subgroup n is not printed beside these figures. An overall survey n is not automatically a routed item’s valid base. | Statistics Canada Published 2019-02-07 Number of grandchildren paragraph. |
| F52 | 5% lived with a grandchild in 2017; the figures were 9% for foreign-born grandparents and 4% for Canadian-born grandparents. Definition: Within-grandparent coresidence, not the share of children in grandparent homes. Qualification: Not proof of caregiving, dependence, cultural preference or relationship quality. | Canadian grandparents 45+ in the covered population Canada 2017 GSS Exact eligible item/subgroup n is not printed beside these figures. An overall survey n is not automatically a routed item’s valid base. | Statistics Canada Published 2019-02-07 Shared-home and nativity paragraphs. |
How do grandparents fit into multigenerational homes in Canada?
Canada’s 2021 census analysis defines multigenerational households as three or more generations of the same family. This includes many grandparent–grandchild homes but excludes some skipped-generation arrangements with just two generations.
| ID | Finding and qualification | Population, actual period and base | Original source and locator |
|---|---|---|---|
| F53 | 2.4 million people lived in multigenerational households, representing 6.5% of private-household residents; there were 441,750 such households. Definition: Three or more generations of the same family in one home. Qualification: Not every grandparent household; skipped-generation homes may have only two generations. People and households are different units. | Canada private-household population/households Canada 2021 Census Exact eligible item/subgroup n is not printed beside these figures. An overall survey n is not automatically a routed item’s valid base. | Statistics Canada Published 2025-08-14 Highlights and introduction. |
| F54 | 12.2% of one-parent families lived in a multigenerational household; 79.3% of parents heading those multigenerational one-parent families were in the middle generation. Definition: First percentage uses all one-parent families; second a selected multigenerational subset. Qualification: Do not treat 79.3% as a share of all Canadian single parents or infer that grandparents supply care. | Canadian one-parent families and the specified multigenerational subset Canada 2021 Census Exact eligible item/subgroup n is not printed beside these figures. An overall survey n is not automatically a routed item’s valid base. | Statistics Canada Published 2025-08-14 Highlights and family-status section. |
| F55 | 29.3% of youngest-generation members in multigenerational homes spoke two or more languages at home, versus 17.9% of people in other household types. Definition: Youngest-generation versus all residents of other household types. Qualification: Youngest generation can include adults; the comparator is not age matched. Do not attribute the difference causally to grandparents. | Canadian private-household residents in stated generation/household groups Canada 2021 Census Exact eligible item/subgroup n is not printed beside these figures. An overall survey n is not automatically a routed item’s valid base. | Statistics Canada Published 2025-08-14 Language section, paragraph after Table 3. |
How does living with grandchildren differ from raising them?
Living together is broader than primary responsibility. The US Census report’s 2021 one-year estimate classified 31.3% of coresident grandparents as responsible for grandchildren’s basic needs. Its separate five-year map estimate must not be substituted as though it were the same observation.
| ID | Finding and qualification | Population, actual period and base | Original source and locator |
|---|---|---|---|
| F56 | 6.7 million adults 30+ lived with a grandchild under 18 in 2021, or 3.3% of adults 30+. Of those coresident grandparents, 31.3%—about 2.1 million—had primary responsibility. Definition: 2021 one-year ACS, people counts. Qualification: Do not substitute the report map’s 32.7% from the 2017–2021 five-year ACS. Responsible care is narrower than coresidence. | US adults 30+ living with own under-18 grandchildren United States 2021 ACS 1-year Exact eligible item/subgroup n is not printed beside these figures. An overall survey n is not automatically a routed item’s valid base. | US Census Bureau Published February 2024; exact report day not established Physical p.3, coresident-grandparents section and Table 1. |
| F57 | The share of coresident grandparents aged 60+ rose from 46.8% in 2012 to 60.1% in 2021. Definition: Age composition among grandparents sharing a home with an under-18 grandchild. Qualification: Not the percentage of all 60+ adults living with grandchildren, and not new 2027 aging data. | US coresident grandparents with under-18 grandchildren United States 2012 and 2021 ACS 1-year Exact eligible item/subgroup n is not printed beside these figures. An overall survey n is not automatically a routed item’s valid base. | US Census Bureau Published February 2024; exact report day not established Report highlights physical p.2 and age discussion physical p.12. |
| F58 | Among children under 18 living with grandparents, 16.2% were in poverty: 18.6% in grandparent-maintained homes versus 14.2% in parent-maintained homes. Definition: Poverty among children; maintainer is the householder category. Qualification: Not grandparents’ poverty or a causal effect of living with grandparents. Other household characteristics differ. | US children under 18 sharing a home with grandparents United States 2021 ACS 1-year Exact eligible item/subgroup n is not printed beside these figures. An overall survey n is not automatically a routed item’s valid base. | US Census Bureau Published February 2024; exact report day not established Report highlights physical p.2 and child-poverty discussion. |
Do adults think grandparents are obliged to provide care?
Most British adults in YouGov’s June 2026 survey viewed grandchild care as grandparents’ choice. This is a public attitude, separate from care behavior, family closeness or any legal rule.
| ID | Finding and qualification | Population, actual period and base | Original source and locator |
|---|---|---|---|
| F59 | 24% of Britons with a living grandparent said they had a particularly close relationship with at least one; 10% reported a bad relationship with a grandparent. Definition: Conditional on having the relative; two separate multiple-response relationship questions. Qualification: Exact conditional n unavailable. These are not complements and do not reproduce Pew’s extremely/very-close scale. Do not rank countries using those unmatched measures. | GB adults with a living grandparent; conditional valid n unavailable Great Britain, not the whole United Kingdom 2026-06-02 to 2026-06-03 Exact eligible item/subgroup n is not printed beside these figures. An overall survey n is not automatically a routed item’s valid base. | YouGov Published 2026-07-09 Original closeness summary, conditional family-member paragraphs; full PDF p.4 shows the differently based all-family item. |
| F60 | 19% said grandparents have an obligation to help care for grandchildren, 73% said it is up to them and 8% did not know. Men selected obligation at 22% and women at 15%. Definition: Attitudes among all sampled GB adults, not only grandparents. Qualification: Not a legal requirement or observed care behavior. Gender subgroup n refers to full male/female adult groups, not grandparent-only respondents. | GB adults 18+; n=1,939 Great Britain, not the whole United Kingdom 2026-06-02 to 2026-06-03 Published input base(s): 909, 1,030, 1,939. An overall survey n is not automatically a routed item’s valid base. | YouGov Published 2026-07-09 Physical p.15, grandparent-care obligation item; visual labels checked. |
25 comparisons with reproducible inputs
These are descriptive calculations. Percentage-point gaps retain the source’s denominator; they are not relative percentage growth or proof that one factor caused another. Read the caveat alongside each result.
| ID | Comparison | Arithmetic and unit | Original inputs and interpretation limit |
|---|---|---|---|
| C01 | Frequent care: nearby minus no nearby adult child | 56 − 18 = 38.0 percentage points | F12 / F12 Use Table 6’s more-than-monthly label; narrative threshold differs. Adult-child proximity association, not causation. |
| C02 | Never care: no nearby minus nearby adult child | 36 − 17 = 19.0 percentage points | F12 / F12 Never care is not no visits; no exact subgroup n or adjusted effect. |
| C03 | Few-times-yearly care: no nearby minus nearby adult child | 46 − 27 = 19.0 percentage points | F12 / F12 Descriptive within-source margin contrast. |
| C04 | Frequent care: grandparents 50–59 minus 70+ | 61 − 41 = 20.0 percentage points | F13 / F13 Source table threshold; cross-sectional cohorts, not the effect of aging. |
| C05 | Daily seeing minus daily childcare | 18 − 8 = 10.0 percentage points | F21 / F19 Same under-18 eligible definition, separate margins; not the exact share who visit without providing care. |
| C06 | At least weekly seeing: daily plus other-weekly categories | 18 + 23 = 41.0 percent (approximate rounded sum) | F21 / F21 Approximate sum of rounded mutually exclusive seeing categories. Not a published NET and not Pew’s contact measure. |
| C07 | Daily childcare: grandparents 50–64 minus 65–94 | 10 − 6 = 4.0 percentage points | F20 / F20 Within-source descriptive age-group comparison. |
| C08 | Primary custody/responsibility: grandparents 50–64 minus 65–94 | 6 − 1 = 5.0 percentage points | F27 / F27 Primary responsibility is distinct from occasional childcare. |
| C09 | Weekday childcare: ages 35–44 minus all eligible | 66 − 52 = 14.0 percentage points | F29 / F29 Nested subgroup versus overall; not independent samples, no new test. |
| C10 | More-than-ten-hour care: preschool minus secondary-school group | 33 − 26 = 7.0 percentage points | F31 / F31 Exact item/group n and hour-item eligibility not fully specified on the original page. |
| C11 | Wanting more fun time: 2026 minus 2024 | 37 − 17 = 20.0 percentage points | F33 / F33 Earlier-wave comparability less documented; no longitudinal person-level or significance claim. |
| C12 | Feeling obliged: 2026 minus 2024 | 27 − 9 = 18.0 percentage points | F34 / F34 Percentage points, not a relative percent increase; not a legal obligation. |
| C13 | Financial difficulty: 2026 minus 2024 | 16 − 11 = 5.0 percentage points | F35 / F35 Self-reported difficulty; not a causal or statistically tested effect. |
| C14 | Working-pattern change: regular caregivers minus all eligible | 43 − 33 = 10.0 percentage points | F36 / F36 Nested eligible groups; not an exact count who quit work. |
| C15 | Work/study reason: youngest grandchild 10–12 minus 0–1 | 75 − 57 = 18.0 percentage points | F43 / F43 Convenience-sample care providers; cross-sectional age groups. |
| C16 | Parental respite reason: youngest grandchild 0–1 minus 10–12 | 60 − 31 = 29.0 percentage points | F44 / F44 Multiple reasons can overlap; not a partition of care hours. |
| C17 | Wanting unavailable care: non-providers minus current providers | 41 − 28 = 13.0 percentage points | F46 / F46 Wording differs for current providers (other grandchildren); not a general unmet-care prevalence. |
| C18 | Relationship-breakdown barrier: non-providers minus providers | 30 − 20 = 10.0 percentage points | F47 / F47 Both groups first wanted some/additional care; not population estrangement. |
| C19 | Age at first grandparenthood: men minus women | 54 − 51 = 3.0 years | F50 / F50 Retrospective means in historical 2017 data, not a current forecast. |
| C20 | Child poverty: grandparent-maintained minus parent-maintained home | 18.6 − 14.2 = 4.4 percentage points | F58 / F58 Child denominator, differing household composition; not causation. |
| C21 | Work/study minus parental-respite reason, youngest cared-for grandchild 0–1 | 57 − 60 = -3.0 percentage points | F43 / F44 Difference between overlapping response margins, not a mutually exclusive type or care-hour balance; 2021 Australian convenience sample. |
| C22 | Work/study minus parental-respite reason, youngest cared-for grandchild 2–3 | 56 − 53 = 3.0 percentage points | F43 / F44 Difference between overlapping response margins, not a mutually exclusive type or care-hour balance; 2021 Australian convenience sample. |
| C23 | Work/study minus parental-respite reason, youngest cared-for grandchild 4–5 | 71 − 36 = 35.0 percentage points | F43 / F44 Difference between overlapping response margins, not a mutually exclusive type or care-hour balance; 2021 Australian convenience sample. |
| C24 | Work/study minus parental-respite reason, youngest cared-for grandchild 6–9 | 71 − 33 = 38.0 percentage points | F43 / F44 Difference between overlapping response margins, not a mutually exclusive type or care-hour balance; 2021 Australian convenience sample. |
| C25 | Work/study minus parental-respite reason, youngest cared-for grandchild 10–12 | 75 − 31 = 44.0 percentage points | F43 / F44 Difference between overlapping response margins, not a mutually exclusive type or care-hour balance; 2021 Australian convenience sample. |
Common questions about grandparent relationships
What percentage of older Americans are grandparents?
In the Michigan August 2024 sample, 60% of respondents 50–94 reported a grandchild, using a definition that includes step, adopted and great-grandchildren (F16). Other surveys use different age ranges and screening, so there is no interchangeable universal percentage. Original source.
How often do grandparents contact grandchildren?
Pew reported that 70% of US grandparents 65+ were in touch at least a few times a month in September 2025 (F05). That measure includes calls and texts; it should not be presented as an in-person visit rate. Original source.
Does more contact prove that grandchildren reduce loneliness?
No. The Michigan results show an association between seeing frequency and reported isolation (F22). They cannot show cause and effect. For prevalence and measurement of loneliness, see the separate Loneliness Hub. Original source.
Are grandparents expected to provide free childcare?
In YouGov’s June 2026 GB survey, 19% of adults thought grandparents had an obligation to help care, while 73% said it was their choice (F60). This is an attitude question, not a legal rule or proof that care is always unpaid. Original source.
Does living with a grandchild mean raising that child?
No. The 2021 one-year ACS figures show that 31.3% of grandparents living with an under-18 grandchild were responsible for the grandchild’s basic needs (F56). Coresidence is the wider category. Original source.
Can the UK and Australian enjoyment percentages be compared directly?
SunLife’s UK question and AIFS’s Australian care-provider question use different eligible groups, samples and periods (F33 and F45). They should be reported with those definitions rather than used to rank which country’s grandparents are happier. Original source.
Methodology and limitations
Selection and verification
We prioritized accessible original government tables, university surveys and original research summaries. Every finding retains a direct URL, locator, actual reference period, eligible population, definition and caveat. Visual labels were checked where PDF alternative text could mislead. Full original reports are linked rather than redistributed.
What 60 findings means
The article contains 60 grouped findings and 183 numeric source inputs from nine source records across eight publishing organizations. One Pew publication combines several datasets and surveys. Related questions, subgroups and categories often share respondents; these are not 60 independent studies. University of Michigan contributes 13 findings, SunLife 10 and AIFS 10.
Populations and geography
US, UK, Great Britain, Canadian and Australian sources cover different ages and relationship definitions. Grandparent-reported care, parent-reported care, children in grandparent-headed homes and all grandparents are distinct populations. Country percentages are not pooled or used as a like-for-like ranking.
Sampling and item bases
Source methods vary. The Michigan instrument describes a calibrated combination of probability and non-probability panels. SunLife reports 2,000 online interviews but does not publish complete sampling/weighting details on its page. AIFS uses a weighted convenience sample and was fielded during COVID restrictions. An overall sample n is not a valid base for every subgroup. Missing n, confidence intervals, standard errors and standard deviations remain blank in the data.
Source discrepancies and omissions
We retained published Pew combined NETs instead of replacing them with rounded sums. Marquette’s monthly-care threshold differs between narrative and table labels; the chart avoids that threshold. AIFS’s headline care rate conflicts with its frequency detail, and one distance bar conflicts with alternative text; those unresolved estimates are omitted. Other selected figures were verified separately.
What MyLittleDesire calculated
C01–C25 are reproducible descriptive comparisons with input IDs and explicit units. C06 is an approximate sum of rounded seeing-frequency categories. C21–C25 show work/study reason minus parental respite within matched age groups. Differences between separate margins do not identify individual overlaps, causal effects or care-hour balances. No new confidence intervals or significance tests were calculated.
Contribution and limits
MyLittleDesire organized the evidence, made the four charts and exposed the arithmetic for reuse. Some differences were already evident in the original studies. Convenient comparison and clear definitions are the contribution, not new fieldwork or 25 novel scientific discoveries. Historical observations are labeled, and earlier-wave comparability is qualified.
Edition and review date
2027 is the editorial edition. Sources were reviewed October 31, 2026; actual study periods range from historical census/survey comparisons to 2026 fieldwork. This is not a claim of 2027 measurements, a forecast or a future publication date. Dates should change only after real review or substantive updates.
Related family and social-connection research
For adult care responsibilities, see Family Caregiving and Relationships. For different questions about family distance, see Family Estrangement Statistics. Loneliness Statistics covers loneliness measurements; Friendship Statistics covers wider social ties. No childcare is not the same as no contact or estrangement.
Complete original-source bibliography
- S01 · Pew Research Center. 6 facts about grandparents in the U.S..
Published 2026-09-09. Actual data: 2024 SIPP/ACS; March 2022–December 2023 HRS; June 16–29 and September 2–8, 2025 Pew surveys.
Population: Varies by finding: adults by age; selected HRS grandparents; grandparents 65+; adults reporting a grandparent; children in grandparent-headed homes
Method: Original SIPP/HRS/ACS analyses plus original Pew survey findings, with the individual data period and eligible population retained. June survey general-public n=6,871; valid grandparent-closeness base n=2,724. September topline n=8,750 overall, adults 65+ n=2,582; eligible grandparent-contact n not printed in the selected chart. ATP primarily online with some live telephone interviews and weighting.
Limits: This is one publication combining multiple research designs, not one survey. SIPP grandparent question is screened through reported biological parenthood; adults under 30 not asked; oldest age 90. HRS analysis primarily uses pre-2022 entrants born 1965 or earlier with weights available August 2026; some younger household partners included. Joint respondent/spouse care and pandemic-era recall are not current individual care hours. Published NETs override rounded component sums.
Supporting document 1 · Supporting document 2 · Supporting document 3 - S02 · Marquette University Law School Poll. Family and intergenerational connections: July 9, 2026 release.
Published 2026-07-09. Actual data: 2026-06-09 to 2026-06-15.
Population: Adults 18+ overall n=1,514; grandparents and middle-generation parent subsets vary by question
Method: National probability-based SSRS Opinion Panel, online interviews. Overall margin of error ±2.7 percentage points; not a subgroup margin. Original release and Tables 4, 6 and 7 inspected.
Limits: Grandparent and age/proximity subgroup valid n not printed in the release. Tables 6/7 label the frequent-care category “More than once a month”; narrative calls it at least monthly. Retain the table label and disclose the threshold inconsistency; no interpolated exact once-monthly count. Proximity is to adult children, not a direct grandchild-distance measurement. Tables may total 101 because of rounding. Full detail site returned 503.
Reviewed October 31, 2026. - S03 · University of Michigan, National Poll on Healthy Aging. Grandparents help grandkids in many ways – but the reverse may be true too, poll suggests.
Published 2024-11-12. Actual data: 2024-08-05 to 2024-08-27.
Population: Adults 50–94 overall n=3,486; grandparent/under-18/ages 1–17 subsets vary
Method: NORC national TrueNorth survey combining AmeriSpeak probability-panel and non-probability-panel respondents, calibrated and weighted; primarily web with some telephone interviews. The August 5–27, 2024 instrument and original university release were inspected. National n=3,486; Michigan oversample n=1,174 is not used as a national item base. Seeing item Q8 asks respondents with multiple grandchildren to think about those seen most often; care Q9A is a separate item.
Limits: Grandparent definition includes step, adopted and great-grandchildren. Exact valid n and intervals for selected routed items are not printed alongside the release. Seeing and childcare are separate margins, not matched grandchild-level records. Cross-sectional isolation associations cannot show causation. No Michigan-only values are generalized nationally.
Supporting document 1 · Supporting document 2
Reviewed October 31, 2026. - S04 · SunLife. How grandparents are filling the UK’s childcare gap.
Published 2026-07-20. Actual data: June 2026; clearly labeled 2024/2025 comparisons.
Population: People with at least one grandchild under 18; 2,000 online interviews
Method: Original commissioned commercial research. Published field month and sample eligibility inspected; original narrative and expense tables available.
Limits: Recruitment, weighting, response rate, exact item/subgroup bases and uncertainty are not supplied on the report page. Do not call this a demonstrated nationally representative probability sample. Prior-wave comparability is less documented; year differences are descriptive only. Multiple attitudes can coexist. Some average-cost/hour denominators are not explicit; no new extrapolation or cross-country money comparison.
Reviewed October 31, 2026. - S05 · Australian Institute of Family Studies. Grandparents and child care in Australia.
Published July 2022; exact day not established. Actual data: 2021-05-19 to 2021-06-30.
Population: Survey n=5,985; grandparents 40+ n=2,383; under-13-grandchild question block n=1,985; provider/item subsets smaller
Method: Families in Australia Survey 3, online convenience sample with weighting to reduce some biases; most grandparent respondents were grandmothers (2,095). Mixed quantitative and free-text research, with 1,109 grandparents providing comments. Individual figures/tables and physical PDF pages inspected.
Limits: Not nationally representative. COVID restrictions differed across states during fieldwork. Overall care headline says two in five, while detailed frequency includes 40% never; overall care prevalence is withheld. Figure 9 non-provider distance bar reads 67% but alt text says 37%; both versions of that unresolved distance value are withheld. Other selected figures are separately verified. Care reasons/types allow multiple responses; exact routed item n not printed.
Supporting document 1
Reviewed October 31, 2026. - S06 · Statistics Canada. Family Matters: Grandparents in Canada.
Published 2019-02-07. Actual data: 2017 GSS on Family; explicitly historical 1995/2011 comparisons.
Population: Grandparents 45+; GSS non-institutionalized population in ten provinces
Method: Original General Social Survey on Family analysis. Survey estimates weighted to the covered population; selected grandparent analytic n and uncertainty not printed in the release.
Limits: Archived historical release, not a 2027 population count. Definitions/coverage differ from current US studies. First-grandparent age is retrospective reported age at first grandchild birth or adoption. Coresidence does not establish primary care, contact quality or a causal effect.
Reviewed October 31, 2026. - S07 · Statistics Canada. Unpacking Canada’s multigenerational households: A look at the people who call them home.
Published 2025-08-14. Actual data: 2021 Census of Population.
Population: People in private households; multigenerational means three or more generations of the same family
Method: Original Census analysis, with separate youngest/middle/oldest generations and family-status definitions. Private household universe excludes collective dwellings. Census disclosure control applies.
Limits: Multigenerational is not synonymous with every home containing a grandparent: skipped-generation homes can have two generations. People, families and households use different denominators. Grandchildren/children can be adults. Language comparison uses youngest generation versus all people in other household types, not an age-matched control. No causal language or grandparent-only effect is inferred.
Reviewed October 31, 2026. - S08 · US Census Bureau. Grandparents and Their Coresident Grandchildren: 2021 (P20-588).
Published February 2024; exact report day not established. Actual data: 2021 ACS 1-year estimates; labeled 2012 comparison.
Population: Grandparents 30+ living with own grandchildren under 18; children and household-maintainer groups as specified
Method: Original Current Population Report using ACS and other Census programs. Selected findings here use the 2021 one-year ACS, not the 2017–2021 five-year map estimates. Definitions and relevant table/summary passages inspected.
Limits: The report’s 31.3% responsible-care figure uses the 2021 one-year ACS; its map discussion’s 32.7% uses the 2017–2021 five-year ACS. Do not call this a time trend or silently substitute one. Coresidence does not equal caregiving/custody. Child-poverty rates use children, not grandparents. Exact analytic n/selected MOEs are not printed beside the summaries.
Reviewed October 31, 2026. - S09 · YouGov. Big Survey on Family: closeness and obligations.
Published 2026-07-09. Actual data: 2026-06-02 to 2026-06-03.
Population: GB adults 18+ n=1,939 overall; living-grandparent eligible base for conditional summary not supplied
Method: Original online-panel weighted crosstabs, 48 pages. Page 4 all-family closeness item uses unweighted n=1,929/weighted base 1,928. Conditional 24% close-to-grandparent figure is from original published summary; page 15 obligation item uses n=1,939.
Limits: Particularly close is not Pew’s extremely/very-close scale. Do not compare country percentages as one identical measure. Full-sample or all-family bases are not valid n for respondents with a living grandparent. Attitudes about obligation are not behavior or a legal rule.
Supporting document 1 · Supporting document 2
How to cite this resource
MyLittleDesire. Grandparent–Grandchild Relationship Statistics 2027 . https://mylittledesire.com/grandparent-grandchild-relationship-statistics/.