Kindness can be expressed through everyday consideration, practical help or financial generosity. Research measures these in different ways. This resource separates experiences of kindness, willingness to help, expectations of others and reported giving, keeping the original question attached to each number.
The reference contains 56 published observations in 14 groups from three studies, with four original charts and ten descriptive comparisons. Related response categories, combined summaries and regional cells are not independent studies. These findings do not establish one universal kindness percentage or identify the world’s kindest people.
65.9%
76%
of Kindness Test participants reported concern that kindness could be misinterpreted; self-selected sample.Original source [S01]
of U.S. adults said they were extremely or very likely to help with a neighbor’s mail or plants in March 2025.Original source [S02]
68%
61%
of U.S. adults reported donating money or items to a charity or cause in the preceding 12 months.Original source [S02]
reported monetary giving in CAF’s published global summary for 2025; not a complete kindness measure.Original source [S03]
What do kindness statistics measure?
A report of receiving kindness describes an experience. A likelihood response describes an intention or expectation. A donation question records self-reported behavior, but financial giving captures only one part of helping others. A person may show consideration without donating money, and survey averages do not define an individual’s character.
| Study | Eligible population | Actual collection | Full study context |
|---|---|---|---|
| University of Sussex / BBC Radio 4 [S01] | Adults age 18–99 who chose to complete the Kindness Test; workplace question has its own unspecified eligible group | August 31–October 4, 2021 | More than 60,000 participants reported; exact full n and selected item-valid n not printed in this announcement. |
| Pew Research Center [S02] | Noninstitutionalized U.S. adults age 18+ | March 10–16, 2025; donation item refers to preceding 12 months | 9,482 adult respondents; full ask-all base for selected questions, not confirmed item-complete n. |
| Charities Aid Foundation / Focaldata [S03] | Adults age 18+ in online country samples; publisher summaries of 2025 monetary giving | Online fieldwork January 5–February 18, 2026; questions refer to the whole of 2025 | 60,443 donor-survey respondents across 105 countries; not 60,443 donors, and not the separate charity-organisation survey. |
Personal helping can involve friends as well as neighbors. For broader relationship patterns, see our friendship statistics. The present selection does not estimate kindness toward every type of relationship or give a complete measure of compassion.
Also Read:-
Social Support During Life Changes Statistics 2027
Neighbor Relationships And Community Connection Statistics 2027
Online vs In Person Friendship Statistics 2027
Making Friends as an Adult Statistics 2027
Intergenerational Friendship Statistics 2027
What gets in the way of kindness?
F01 Selected barriers in the original Sussex results announcement. Self-selected 2021 Kindness Test respondents, not national or world prevalence. Exact item-valid n unavailable. Barriers may overlap. Reporting social media as a barrier does not prove social media caused unkind behavior.
| Measure / group | Published result | Population, period and base | Original source |
|---|---|---|---|
| Concern kindness would be misinterpreted | 65.9% | Adults age 18–99 who chose to complete the Kindness Test; workplace question has its own unspecified eligible group August 31–October 4, 2021 · Exact selected item/group n unavailable | Original source [S01] Summary of key results, barriers bullet |
| Not enough time | 57.5% | Adults age 18–99 who chose to complete the Kindness Test; workplace question has its own unspecified eligible group August 31–October 4, 2021 · Exact selected item/group n unavailable | Original source [S01] Summary of key results, barriers bullet |
| Use of social media | 52.3% | Adults age 18–99 who chose to complete the Kindness Test; workplace question has its own unspecified eligible group August 31–October 4, 2021 · Exact selected item/group n unavailable | Original source [S01] Summary of key results, barriers bullet |
| Lack of opportunity | 42.1% | Adults age 18–99 who chose to complete the Kindness Test; workplace question has its own unspecified eligible group August 31–October 4, 2021 · Exact selected item/group n unavailable | Original source [S01] Summary of key results, barriers bullet |
| Kindness seen as weakness | 27.6% | Adults age 18–99 who chose to complete the Kindness Test; workplace question has its own unspecified eligible group August 31–October 4, 2021 · Exact selected item/group n unavailable | Original source [S01] Summary of key results, barriers bullet |
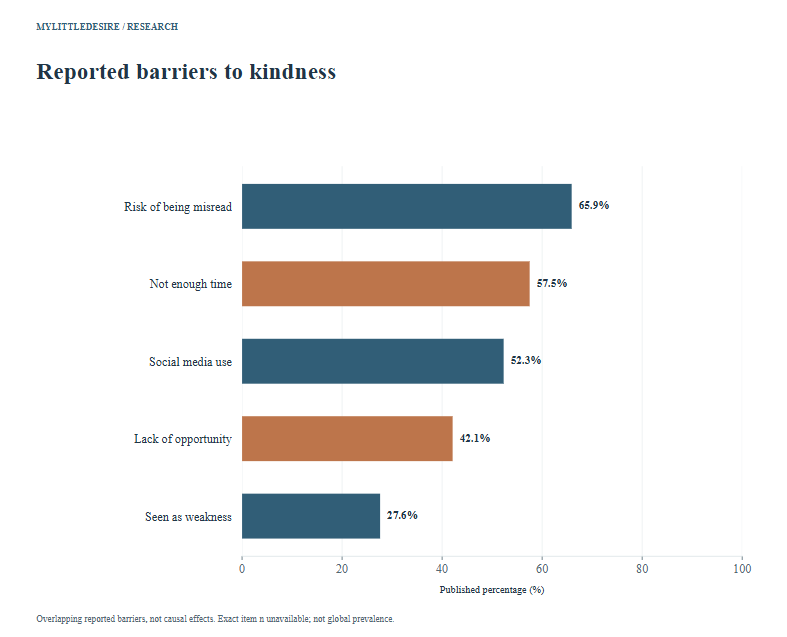
The Kindness Test invited people to choose to participate online. Its results describe those respondents. The barriers could overlap, so their percentages should not be added as exclusive categories. A respondent’s report that social media gets in the way also does not demonstrate that using social media causes unkind behavior.
How did participants describe receiving and valuing kindness?
F02 Selected perceptions of kindness over the respondent’s lifetime. Self-selected 2021 Kindness Test respondents, not national or world prevalence. Exact item-valid n unavailable. Opinions about change, not observed historical rates. Do not infer an unreported remainder or universal trend.
| Measure / group | Published result | Population, period and base | Original source |
|---|---|---|---|
| Stayed the same | 39% | Adults age 18–99 who chose to complete the Kindness Test; workplace question has its own unspecified eligible group August 31–October 4, 2021 · Exact selected item/group n unavailable | Original source [S01] Opening results paragraph and summary lifetime-change bullet |
| Declined | 36% | Adults age 18–99 who chose to complete the Kindness Test; workplace question has its own unspecified eligible group August 31–October 4, 2021 · Exact selected item/group n unavailable | Original source [S01] Opening results paragraph and summary lifetime-change bullet |
F03 Original announcement’s selected recency wording. Self-selected 2021 Kindness Test respondents, not national or world prevalence. Exact item-valid n unavailable. Publisher says 16% in the last hour and a further 43% in the last day. Exact response bands are not supplied here; no combined 24-hour rate is created.
| Measure / group | Published result | Population, period and base | Original source |
|---|---|---|---|
| Received kindness within the last hour | 16% | Adults age 18–99 who chose to complete the Kindness Test; workplace question has its own unspecified eligible group August 31–October 4, 2021 · Exact selected item/group n unavailable | Original source [S01] Summary of key results, received-kindness recency bullet |
| Further group: received kindness within the last day | 43% | Adults age 18–99 who chose to complete the Kindness Test; workplace question has its own unspecified eligible group August 31–October 4, 2021 · Exact selected item/group n unavailable | Original source [S01] Summary of key results, received-kindness recency bullet |
F04 Original Sussex researcher quote reports agreement that kindness is valued in the respondent’s workplace. Self-selected 2021 Kindness Test respondents, not national or world prevalence. Exact item-valid n unavailable. Workplace eligible base not printed. Keep the original 73%, rather than replacing it with 74% from other summaries. Not a representative survey of all workers.
| Measure / group | Published result | Population, period and base | Original source |
|---|---|---|---|
| Agreed kindness was valued in their workplace | 73% | Adults age 18–99 who chose to complete the Kindness Test; workplace question has its own unspecified eligible group August 31–October 4, 2021 · Exact selected item/group n unavailable | Original source [S01] Gillian Sandstrom quote immediately before Methodology |
Lifetime-change answers are perceptions rather than a repeated historical measure. The recency announcement reports 16% within an hour and a further 43% within a day, but does not supply the complete response-band definitions. We preserve that wording and do not manufacture a combined 24-hour result.
The original Sussex researcher quote reports 73% agreeing that kindness was valued at their workplace. Its exact eligible base is not provided. Some other summaries use 74%; that value is not substituted here. The announcement gives more than 60,000 participants overall, not an exact full sample or an item-valid denominator.
Would Americans help friends, neighbors and their community?
F05 Bringing in mail or watering plants for a neighbor who asks while away. Hypothetical likelihood/expectation, not help actually performed. Only extremely and very likely categories selected; these are not the full response scale. Full asked n=9,482 is not asserted item-valid n.
| Measure / group | Published result | Population, period and base | Original source |
|---|---|---|---|
| Own willingness — extremely likely | 44% | Noninstitutionalized U.S. adults age 18+ March 10–16, 2025; donation item refers to preceding 12 months · Published full asked base n=9,482; not asserted item-valid n | Original source [S02] Original topline PDF pages 3–4, YOU_BATT/OTH_BATT MAIL |
| Own willingness — very likely | 32% | Noninstitutionalized U.S. adults age 18+ March 10–16, 2025; donation item refers to preceding 12 months · Published full asked base n=9,482; not asserted item-valid n | Original source [S02] Original topline PDF pages 3–4, YOU_BATT/OTH_BATT MAIL |
| Expected from others — extremely likely | 24% | Noninstitutionalized U.S. adults age 18+ March 10–16, 2025; donation item refers to preceding 12 months · Published full asked base n=9,482; not asserted item-valid n | Original source [S02] Original topline PDF pages 3–4, YOU_BATT/OTH_BATT MAIL |
| Expected from others — very likely | 28% | Noninstitutionalized U.S. adults age 18+ March 10–16, 2025; donation item refers to preceding 12 months · Published full asked base n=9,482; not asserted item-valid n | Original source [S02] Original topline PDF pages 3–4, YOU_BATT/OTH_BATT MAIL |
F06 Meal scenario includes a sick friend or neighbor. Hypothetical likelihood/expectation, not help actually performed. Only extremely and very likely categories selected; these are not the full response scale. Full asked n=9,482 is not asserted item-valid n.
| Measure / group | Published result | Population, period and base | Original source |
|---|---|---|---|
| Own willingness — extremely likely | 35% | Noninstitutionalized U.S. adults age 18+ March 10–16, 2025; donation item refers to preceding 12 months · Published full asked base n=9,482; not asserted item-valid n | Original source [S02] Original topline PDF pages 3–4, YOU_BATT/OTH_BATT MEAL |
| Own willingness — very likely | 32% | Noninstitutionalized U.S. adults age 18+ March 10–16, 2025; donation item refers to preceding 12 months · Published full asked base n=9,482; not asserted item-valid n | Original source [S02] Original topline PDF pages 3–4, YOU_BATT/OTH_BATT MEAL |
| Expected from others — extremely likely | 18% | Noninstitutionalized U.S. adults age 18+ March 10–16, 2025; donation item refers to preceding 12 months · Published full asked base n=9,482; not asserted item-valid n | Original source [S02] Original topline PDF pages 3–4, YOU_BATT/OTH_BATT MEAL |
| Expected from others — very likely | 24% | Noninstitutionalized U.S. adults age 18+ March 10–16, 2025; donation item refers to preceding 12 months · Published full asked base n=9,482; not asserted item-valid n | Original source [S02] Original topline PDF pages 3–4, YOU_BATT/OTH_BATT MEAL |
F07 Loan scenario refers to a friend needing money quickly for an emergency. Hypothetical likelihood/expectation, not help actually performed. Only extremely and very likely categories selected; these are not the full response scale. Full asked n=9,482 is not asserted item-valid n.
| Measure / group | Published result | Population, period and base | Original source |
|---|---|---|---|
| Own willingness — extremely likely | 23% | Noninstitutionalized U.S. adults age 18+ March 10–16, 2025; donation item refers to preceding 12 months · Published full asked base n=9,482; not asserted item-valid n | Original source [S02] Original topline PDF pages 3–4, YOU_BATT/OTH_BATT LOAN |
| Own willingness — very likely | 28% | Noninstitutionalized U.S. adults age 18+ March 10–16, 2025; donation item refers to preceding 12 months · Published full asked base n=9,482; not asserted item-valid n | Original source [S02] Original topline PDF pages 3–4, YOU_BATT/OTH_BATT LOAN |
| Expected from others — extremely likely | 19% | Noninstitutionalized U.S. adults age 18+ March 10–16, 2025; donation item refers to preceding 12 months · Published full asked base n=9,482; not asserted item-valid n | Original source [S02] Original topline PDF pages 3–4, YOU_BATT/OTH_BATT LOAN |
| Expected from others — very likely | 26% | Noninstitutionalized U.S. adults age 18+ March 10–16, 2025; donation item refers to preceding 12 months · Published full asked base n=9,482; not asserted item-valid n | Original source [S02] Original topline PDF pages 3–4, YOU_BATT/OTH_BATT LOAN |
F08 Own conservation if public officials asked; expected cooperation from people where the respondent lives. Hypothetical likelihood/expectation, not help actually performed. Only extremely and very likely categories selected; these are not the full response scale. Full asked n=9,482 is not asserted item-valid n.
| Measure / group | Published result | Population, period and base | Original source |
|---|---|---|---|
| Own willingness — extremely likely | 36% | Noninstitutionalized U.S. adults age 18+ March 10–16, 2025; donation item refers to preceding 12 months · Published full asked base n=9,482; not asserted item-valid n | Original source [S02] Original topline PDF pages 3–4, YOU_BATT/OTH_BATT CONSERVE |
| Own willingness — very likely | 36% | Noninstitutionalized U.S. adults age 18+ March 10–16, 2025; donation item refers to preceding 12 months · Published full asked base n=9,482; not asserted item-valid n | Original source [S02] Original topline PDF pages 3–4, YOU_BATT/OTH_BATT CONSERVE |
| Expected from others — extremely likely | 11% | Noninstitutionalized U.S. adults age 18+ March 10–16, 2025; donation item refers to preceding 12 months · Published full asked base n=9,482; not asserted item-valid n | Original source [S02] Original topline PDF pages 3–4, YOU_BATT/OTH_BATT CONSERVE |
| Expected from others — very likely | 31% | Noninstitutionalized U.S. adults age 18+ March 10–16, 2025; donation item refers to preceding 12 months · Published full asked base n=9,482; not asserted item-valid n | Original source [S02] Original topline PDF pages 3–4, YOU_BATT/OTH_BATT CONSERVE |
Pew asks about four scenarios: helping a neighbor while they are away, taking a meal to a sick friend or neighbor, making an emergency loan to a friend, and conserving water or electricity after a public-official request. The questions distinguish what respondents say they would do from what they think other people would do. Neither direction directly counts completed help.
How does willingness compare with expected help?
F09 Publisher-reported combined NETs for four helping/cooperation scenarios. NETs contain the component categories above; do not add them. Original emergency-loan own NET 50 retained despite rounded 23+28=51. Intentions/expectations are not behavior.
| Measure / group | Published result | Population, period and base | Original source |
|---|---|---|---|
| Mail/plants for a neighbor — own willingness | 76% | Noninstitutionalized U.S. adults age 18+ March 10–16, 2025; donation item refers to preceding 12 months · Published full asked base n=9,482; not asserted item-valid n | Original source [S02] Original article, Would Americans help their neighbors, and vice versa? and original helping chart |
| Mail/plants for a neighbor — expected from others | 52% | Noninstitutionalized U.S. adults age 18+ March 10–16, 2025; donation item refers to preceding 12 months · Published full asked base n=9,482; not asserted item-valid n | Original source [S02] Original article, Would Americans help their neighbors, and vice versa? and original helping chart |
| Meal for sick friend or neighbor — own willingness | 67% | Noninstitutionalized U.S. adults age 18+ March 10–16, 2025; donation item refers to preceding 12 months · Published full asked base n=9,482; not asserted item-valid n | Original source [S02] Original article, Would Americans help their neighbors, and vice versa? and original helping chart |
| Meal for sick friend or neighbor — expected from others | 42% | Noninstitutionalized U.S. adults age 18+ March 10–16, 2025; donation item refers to preceding 12 months · Published full asked base n=9,482; not asserted item-valid n | Original source [S02] Original article, Would Americans help their neighbors, and vice versa? and original helping chart |
| Emergency loan to/from a friend — own willingness | 50% | Noninstitutionalized U.S. adults age 18+ March 10–16, 2025; donation item refers to preceding 12 months · Published full asked base n=9,482; not asserted item-valid n | Original source [S02] Original article, Would Americans help their neighbors, and vice versa? and original helping chart |
| Emergency loan to/from a friend — expected from others | 45% | Noninstitutionalized U.S. adults age 18+ March 10–16, 2025; donation item refers to preceding 12 months · Published full asked base n=9,482; not asserted item-valid n | Original source [S02] Original article, Would Americans help their neighbors, and vice versa? and original helping chart |
| Emergency water/electricity conservation — own willingness | 72% | Noninstitutionalized U.S. adults age 18+ March 10–16, 2025; donation item refers to preceding 12 months · Published full asked base n=9,482; not asserted item-valid n | Original source [S02] Original article, Would Americans help their neighbors, and vice versa? and original helping chart |
| Emergency water/electricity conservation — expected from others | 42% | Noninstitutionalized U.S. adults age 18+ March 10–16, 2025; donation item refers to preceding 12 months · Published full asked base n=9,482; not asserted item-valid n | Original source [S02] Original article, Would Americans help their neighbors, and vice versa? and original helping chart |
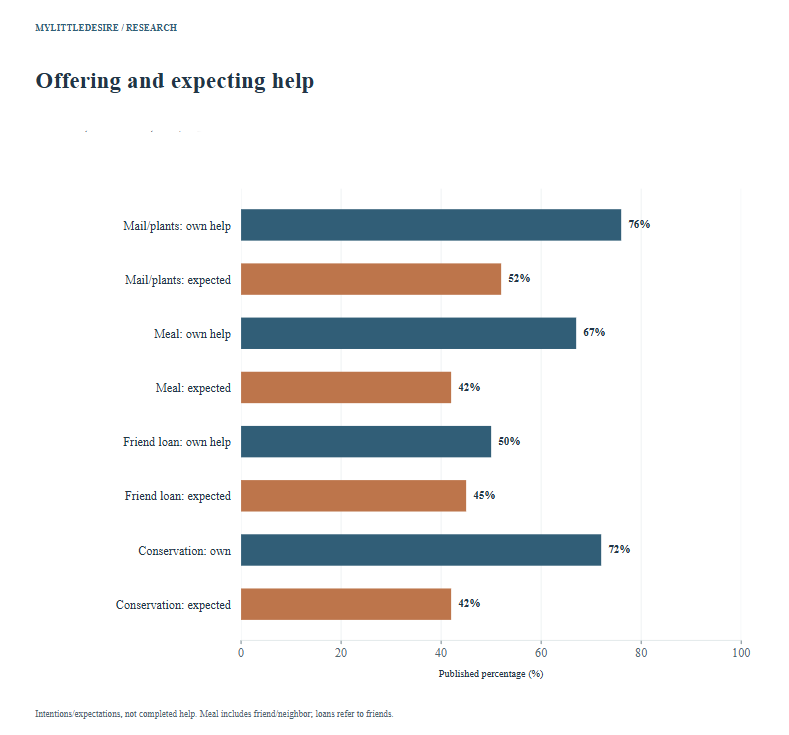
Differences between willingness and expected help describe reported expectations. They do not show that friends or neighbors actually refused assistance. The scenarios also differ in cost, relationship and circumstance; they should not be collapsed into a single personal-kindness score.
How many Americans reported giving to charity?
F10 Self-reported donation of money or items to a charity or cause in the preceding 12 months. Actual reported past behavior, not a helping intention. Includes money or items and a rolling 12-month window; differs from CAF money-only, calendar-2025 questions. Full asked n=9,482, not confirmed item-valid n.
| Measure / group | Published result | Population, period and base | Original source |
|---|---|---|---|
| Yes: money or items donated | 68% | Noninstitutionalized U.S. adults age 18+ March 10–16, 2025; donation item refers to preceding 12 months · Published full asked base n=9,482; not asserted item-valid n | Original source [S02] Original topline PDF page 5, PROSOCBATT DONATE row |
| No: money or items not donated | 32% | Noninstitutionalized U.S. adults age 18+ March 10–16, 2025; donation item refers to preceding 12 months · Published full asked base n=9,482; not asserted item-valid n | Original source [S02] Original topline PDF page 5, PROSOCBATT DONATE row |
This question concerns reported behavior in the prior 12 months, whereas the scenarios above concern likelihood. It includes money or items donated to a charity or cause. That wording matters when comparing it with monetary-only surveys, and the rolling reference period differs from a calendar-year question.
How common was monetary giving across CAF’s surveyed regions?
F11 Money given through at least one of three routes: charity, religious giving, or direct help to people/families in need. CAF/Focaldata online survey January–February 2026 asking about 2025. Original publisher regional/global summaries; exact selected item/region n and aggregate weighting detail unavailable. No new world average calculated. Donation routes overlap; not a kindness or moral-character score.
| Measure / group | Published result | Population, period and base | Original source |
|---|---|---|---|
| Africa | 67% | Adults in CAF surveyed countries; Africa publisher summary Online fieldwork January 5–February 18, 2026; questions refer to the whole of 2025 · Exact selected item/group n unavailable | Original source [S03] Official Donor Insights 2026 page, first public chart DATA records, participation |
| Asia | 68% | Adults in CAF surveyed countries; Asia publisher summary Online fieldwork January 5–February 18, 2026; questions refer to the whole of 2025 · Exact selected item/group n unavailable | Original source [S03] Official Donor Insights 2026 page, first public chart DATA records, participation |
| Global | 61% | Adults in CAF surveyed countries; Global publisher summary Online fieldwork January 5–February 18, 2026; questions refer to the whole of 2025 · Exact selected item/group n unavailable | Original source [S03] Official Donor Insights 2026 page, first public chart DATA records, participation |
| North America | 53% | Adults in CAF surveyed countries; North America publisher summary Online fieldwork January 5–February 18, 2026; questions refer to the whole of 2025 · Exact selected item/group n unavailable | Original source [S03] Official Donor Insights 2026 page, first public chart DATA records, participation |
| Oceania | 63% | Adults in CAF surveyed countries; Oceania publisher summary Online fieldwork January 5–February 18, 2026; questions refer to the whole of 2025 · Exact selected item/group n unavailable | Original source [S03] Official Donor Insights 2026 page, first public chart DATA records, participation |
| South America | 50% | Adults in CAF surveyed countries; South America publisher summary Online fieldwork January 5–February 18, 2026; questions refer to the whole of 2025 · Exact selected item/group n unavailable | Original source [S03] Official Donor Insights 2026 page, first public chart DATA records, participation |
| Europe | 57% | Adults in CAF surveyed countries; Europe publisher summary Online fieldwork January 5–February 18, 2026; questions refer to the whole of 2025 · Exact selected item/group n unavailable | Original source [S03] Official Donor Insights 2026 page, first public chart DATA records, participation |
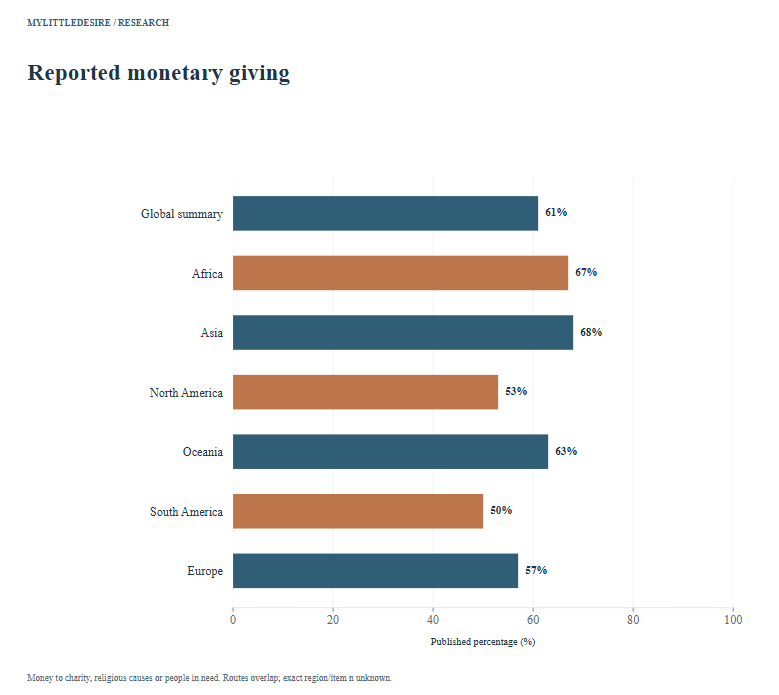
CAF’s 2026 donor research collected 60,443 responses across 105 countries between January 5 and February 18, 2026, asking about the whole of 2025. The global and continental figures here are the publisher’s original summaries. We do not recompute a world average from the six regional percentages.
The survey used online country samples with quotas and weighting. CAF acknowledges that some non-OECD online panels skew toward urban and more highly educated respondents. Recall and social-desirability errors remain possible. The results are indicators of monetary giving, not rankings of overall kindness.
What share of income was donated?
F12 Publisher-reported average percentage of income donated; this is a share of income, not a percentage of people. CAF/Focaldata online survey January–February 2026 asking about 2025. Original publisher regional/global summaries; exact selected item/region n and aggregate weighting detail unavailable. No new world average calculated. Average-income denominator not assumed to be donors only or all full-sample respondents. Monetary sacrifice and cost of living can differ.
| Measure / group | Published result | Population, period and base | Original source |
|---|---|---|---|
| Africa | 1.6% | Adults in CAF surveyed countries; Africa publisher summary Online fieldwork January 5–February 18, 2026; questions refer to the whole of 2025 · Exact selected item/group n unavailable | Original source [S03] Official Donor Insights 2026 page, first public chart DATA records, income |
| Asia | 1.2% | Adults in CAF surveyed countries; Asia publisher summary Online fieldwork January 5–February 18, 2026; questions refer to the whole of 2025 · Exact selected item/group n unavailable | Original source [S03] Official Donor Insights 2026 page, first public chart DATA records, income |
| Global | 1.0% | Adults in CAF surveyed countries; Global publisher summary Online fieldwork January 5–February 18, 2026; questions refer to the whole of 2025 · Exact selected item/group n unavailable | Original source [S03] Official Donor Insights 2026 page, first public chart DATA records, income |
| North America | 0.8% | Adults in CAF surveyed countries; North America publisher summary Online fieldwork January 5–February 18, 2026; questions refer to the whole of 2025 · Exact selected item/group n unavailable | Original source [S03] Official Donor Insights 2026 page, first public chart DATA records, income |
| Oceania | 0.8% | Adults in CAF surveyed countries; Oceania publisher summary Online fieldwork January 5–February 18, 2026; questions refer to the whole of 2025 · Exact selected item/group n unavailable | Original source [S03] Official Donor Insights 2026 page, first public chart DATA records, income |
| South America | 0.7% | Adults in CAF surveyed countries; South America publisher summary Online fieldwork January 5–February 18, 2026; questions refer to the whole of 2025 · Exact selected item/group n unavailable | Original source [S03] Official Donor Insights 2026 page, first public chart DATA records, income |
| Europe | 0.6% | Adults in CAF surveyed countries; Europe publisher summary Online fieldwork January 5–February 18, 2026; questions refer to the whole of 2025 · Exact selected item/group n unavailable | Original source [S03] Official Donor Insights 2026 page, first public chart DATA records, income |
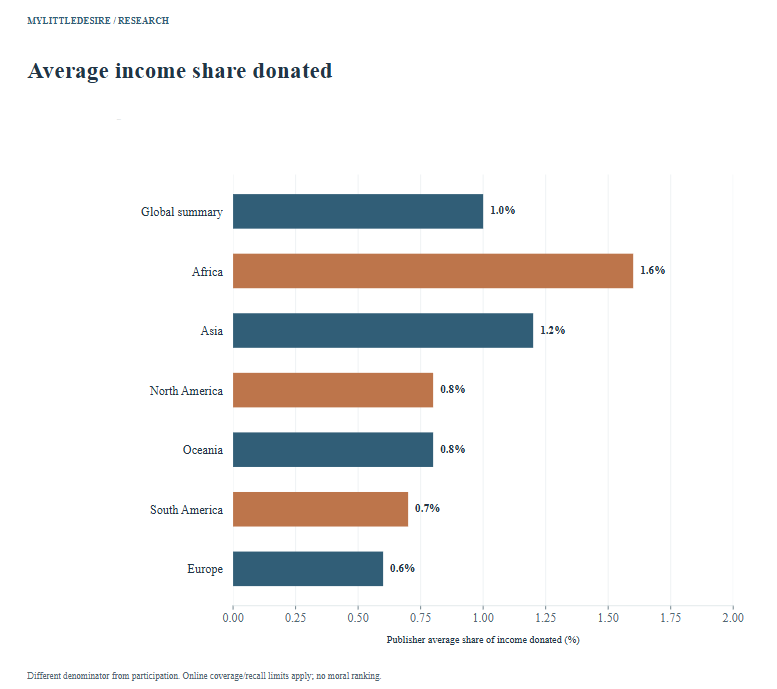
An average percentage of income donated has an income denominator; donation participation has a people denominator. They answer different questions. Exact income-valid item bases are unavailable here, and the full study sample is not assumed to be the denominator for each regional average or to represent donors only.
The income-share chart uses a 0–2% scale and labels the denominator explicitly. Economic circumstances, prices, tax systems and formal support provision differ across countries. A higher average share is not proof of greater personal sacrifice or better moral character.
How do giving routes and donation-value shares differ?
F13 Publisher global shares participating in each of three money-giving routes. CAF/Focaldata online survey January–February 2026 asking about 2025. Original publisher regional/global summaries; exact selected item/region n and aggregate weighting detail unavailable. No new world average calculated. Routes overlap. Direct giving excludes the respondent’s family and friends. These shares of people differ from shares of donation value.
| Measure / group | Published result | Population, period and base | Original source |
|---|---|---|---|
| Direct giving to people/families in need | 36% | Adults age 18+ in online country samples; publisher summaries of 2025 monetary giving Online fieldwork January 5–February 18, 2026; questions refer to the whole of 2025 · Exact selected item/group n unavailable | Original source [S03] Official Donor Insights 2026, Compare giving profiles prose; route definitions in 2026 methods page 3 |
| Giving money to charities | 34% | Adults age 18+ in online country samples; publisher summaries of 2025 monetary giving Online fieldwork January 5–February 18, 2026; questions refer to the whole of 2025 · Exact selected item/group n unavailable | Original source [S03] Official Donor Insights 2026, Compare giving profiles prose; route definitions in 2026 methods page 3 |
| Religious organisations or religious reasons | 23% | Adults age 18+ in online country samples; publisher summaries of 2025 monetary giving Online fieldwork January 5–February 18, 2026; questions refer to the whole of 2025 · Exact selected item/group n unavailable | Original source [S03] Official Donor Insights 2026, Compare giving profiles prose; route definitions in 2026 methods page 3 |
F14 Publisher-reported average allocation of donation value across three routes. CAF/Focaldata online survey January–February 2026 asking about 2025. Original publisher regional/global summaries; exact selected item/region n and aggregate weighting detail unavailable. No new world average calculated. These are average donation-allocation shares, not shares of people or a verified allocation of every donation dollar worldwide. Do not compare them directly with participation percentages.
| Measure / group | Published result | Population, period and base | Original source |
|---|---|---|---|
| Direct giving share of donation value | 41% | Adults age 18+ in online country samples; publisher summaries of 2025 monetary giving Online fieldwork January 5–February 18, 2026; questions refer to the whole of 2025 · Exact selected item/group n unavailable | Original source [S03] Official Donor Insights 2026, The share of donations made through each type of giving prose |
| Charity share of donation value | 38% | Adults age 18+ in online country samples; publisher summaries of 2025 monetary giving Online fieldwork January 5–February 18, 2026; questions refer to the whole of 2025 · Exact selected item/group n unavailable | Original source [S03] Official Donor Insights 2026, The share of donations made through each type of giving prose |
| Religious share of donation value | 21% | Adults age 18+ in online country samples; publisher summaries of 2025 monetary giving Online fieldwork January 5–February 18, 2026; questions refer to the whole of 2025 · Exact selected item/group n unavailable | Original source [S03] Official Donor Insights 2026, The share of donations made through each type of giving prose |
CAF separates monetary gifts to charities, religious organisations or causes, and people or families in need. The direct-giving route excludes the respondent’s family and friends. Someone can give through several routes, so participation rates overlap.
People and money are different denominators. The 36%, 34% and 23% route figures concern participation. The 41%, 38% and 21% figures describe the publisher’s average allocation of donation value. They are not interchangeable, and the latter are not presented as an audit of every donation dollar worldwide.
CAF’s current data and 2026 methods were checked directly. The download button inspected during review was labelled for the 2026 report but linked to a 2025 PDF. That older file is not used to substantiate these current figures. The linked method filename also says version 1, while the downloaded document identifies itself as Version 2; the document contents determine the version description.
Ten reproducible descriptive comparisons
Each comparison subtracts the second original percentage from the first and reports percentage points. Inputs stay within the same source and compatible construct. The income-share comparison is specifically points of income, not points of donation participation. No new significance test is performed.
| ID | Comparison | First | Second | Difference | Qualification |
|---|---|---|---|---|---|
| C01 | Kindness barrier: misinterpretation minus lack of time | 65.9% | 57.5% | +8.4 percentage points | Overlapping self-reported barriers in a self-selected sample. Rounded published inputs; no new significance test. |
| C02 | Lifetime perception: stayed same minus declined | 39% | 36% | +3 percentage points | Opinions about lifetime change, not measured historical prevalence. Rounded published inputs; no new significance test. |
| C03 | Mail/plants extremely likely: own willingness minus expected help | 44% | 24% | +20 percentage points | Different directions of the same hypothetical neighbor-help scenario. Rounded published inputs; no new significance test. |
| C04 | Meal extremely likely: own willingness minus expected help | 35% | 18% | +17 percentage points | Scenario includes friend or neighbor; no observed help exchange. Rounded published inputs; no new significance test. |
| C05 | Emergency loan very likely: own willingness minus expected help | 28% | 26% | +2 percentage points | Very-likely category only; friend scenario. Rounded published inputs; no new significance test. |
| C06 | Emergency conservation extremely likely: own minus expected cooperation | 36% | 11% | +25 percentage points | Public-official emergency request; intentions and expectations. Rounded published inputs; no new significance test. |
| C07 | Mail/plants original NET: own willingness minus expected help | 76% | 52% | +24 percentage points | Original extremely/very NETs, nested in their components. Rounded published inputs; no new significance test. |
| C08 | Global giving route: direct participation minus charity participation | 36% | 34% | +2 percentage points | Multiple routes can overlap. Shares of people, not donation value. Rounded published inputs; no new significance test. |
| C09 | Average share of income: Africa minus Europe | 1.6% | 0.6% | +1 percentage points | Percentage points of income, not points of donation participation. No causal or moral ranking. Rounded published inputs; no new significance test. |
| C10 | Monetary donation participation: Asia minus Europe | 68% | 57% | +11 percentage points | Publisher continental summaries, not a general kindness ranking. Rounded published inputs; no new significance test. |
Common questions
What percentage of people are kind?
These studies do not supply one universal answer. Experiences, reported behavior, intentions and financial giving are different measures.
Does the Kindness Test represent the whole world?
No. People from 144 countries chose to participate online. Country coverage does not make the sample representative.
Do the helping questions show what Americans actually did?
The scenarios ask about likelihood and expectations. The separate donation question asks about behavior in the preceding 12 months.
Why is the emergency-loan NET 50% when the components total 51%?
Rounding can make separately rounded components differ from a combined figure. The original publisher NET is preserved.
Can the U.S. 68% donation figure be compared as a trend with CAF’s 61%?
No. Geography, sampling, money-versus-items wording and reference periods differ.
Does 1% donated mean 1% of people donated?
No. That figure describes the publisher’s average share of income given; participation has a different denominator.
Is financial giving a complete kindness measure?
No. Everyday help and consideration can occur without monetary donations. These figures do not rank moral character.
Does kindness cause better mental health?
The selected observations do not establish a causal health effect. Experiences and correlations should not be turned into treatment claims.
Receiving help also differs from loneliness or the number of social contacts a person has. See our loneliness statistics for those separate measures.
Research method and limitations
Selection and concentration. There are 56 observations in 14 groups: Kindness Test 10, Pew 26 and CAF 20. These are three studies. Related categories, repeated regional summaries, NETs and reused chart/comparison inputs are not independent evidence. MyLittleDesire conducted no survey.
Source checking. Eighteen Pew topline cells, fourteen CAF public chart-input cells and twenty-four original first-party prose values were independently matched. Eight Pew combined values were also reviewed in the original chart. Relevant original questions and methods were checked; no respondent-record audit is claimed.
Bases and uncertainty. Twenty-six Pew rows retain the full ask-all base of 9,482, not a claim that every item has that many valid answers. Thirty selected bases remain unavailable. All 56 weighted-base counts and estimate-specific confidence intervals remain unknown. The exact full Kindness Test n is also unknown; more than 60,000 is kept as reported. Missing information stays null or blank. No new counts, intervals, NETs or significance tests are created.
Interpretation limits. Preserve self-selection, different reference periods, money-or-items wording, direct-giving exclusions, overlapping routes and average-value denominators. No pooled global kindness score, causal claim or moral ranking is inferred. CAF’s Gallup-era World Giving Index used a different survey and recall period; it is not treated as a directly comparable long-run trend.
Original sources
- University of Sussex / BBC Radio 4. The Kindness Test: original University of Sussex results announcement [S01]
Published: March 9, 2022. Actual collection: August 31–October 4, 2021.
Population: Adults age 18–99 who chose to complete the Kindness Test; workplace question has its own unspecified eligible group.
Full sample: Exact full n unavailable; More than 60,000 participants reported; exact full n and selected item-valid n not printed in this announcement.
Bases: All ten selected exact item bases unavailable. More than 60,000 is not converted into an exact sample size or assigned to every item.
Method: Anonymous online questionnaire developed/analysed by Sussex researchers in partnership with BBC Radio 4. Original first-party results and project page checked. Public announcement supplies selected percentages, rather than complete response tables or microdata.
Limits: Self-selection and online participation prevent treating these as population prevalence. Perceived lifetime changes are opinions, not an objective historical trend. Barriers can overlap; social-media answer is a reported barrier, not a causal effect of social media. Recency wording says 16% in the last hour and a further 43% in the last day; no new combined rate inferred. Original workplace quote reports 73%, not the 74% appearing in some other summaries. Associations with wellbeing do not establish causation.
Supporting record 1 - Pew Research Center. How connected do Americans feel to their neighbors? / American Trends Panel Wave 165 [S02]
Published: May 8, 2025. Actual collection: March 10–16, 2025; donation item refers to preceding 12 months.
Population: Noninstitutionalized U.S. adults age 18+.
Full sample: 9,482. 9,482 adult respondents; full ask-all base for selected questions, not confirmed item-complete n.
Bases: All twenty-six selected rows retain published full asked base 9,482. No exact item-valid n, weighted base counts or estimate-specific CIs asserted.
Method: Probability-recruited American Trends Panel, weighted to U.S. adults. SSRS conducted 9,231 web and 251 live-phone interviews in English/Spanish. Original article, chart, topline, questionnaire and relevant March 2025 methods checked. Survey-level response 90%, cumulative response 3%.
Limits: Extremely/very likely responses and published combined NETs are intentions/expectations, not observed help. NETs overlap their components. Original own emergency-loan NET 50% is retained despite rounded 23+28=51. Meals include friend or neighbor; loans refer to a friend; conservation refers to public-emergency cooperation. Donation includes money or items and differs from CAF money-only donation. Full sample margin is not used to construct selected estimate intervals.
Supporting record 1 · Supporting record 2 · Supporting record 3 · Supporting record 4 - Charities Aid Foundation / Focaldata. World Giving Report 2026 — Donor Insights: current official data page and method statement [S03]
Published: June 2026 Donor Insights; official press release June 3, 2026; current method document identifies Version 2, September 2026. Actual collection: Online fieldwork January 5–February 18, 2026; questions refer to the whole of 2025.
Population: Adults age 18+ in online country samples; publisher summaries of 2025 monetary giving.
Full sample: 60,443. 60,443 donor-survey respondents across 105 countries; not 60,443 donors, and not the separate charity-organisation survey.
Bases: All twenty selected item/region/amount-valid bases unknown. Full n=60,443 not substituted. Global headline retained as publisher’s summary; regional/global aggregation weights are not reconstructed.
Method: CAF commissioned Focaldata online polls with age, gender and regional quotas and weighting. Typical country sample about 250–1,000. Current original webpage prose and embedded chart DATA records checked, alongside original 2026 method statement. Methods acknowledge urban/higher-education skew in some non-OECD online panels, self-report, recall and coverage limits.
Limits: Giving is a behavior proxy, not a complete measure or country ranking of kindness. Donation participation, average share of income, and average donation allocation have different denominators. Direct giving excludes family/friends. Donation routes overlap. Allocation shares are publisher-reported averages, not a claimed audited share of all money donated worldwide. Income measurement/quality filters mean full study n is not an item-valid base. No inference of sacrifice or moral character from income share. Survey/period changed from Gallup-era World Giving Index; no direct long-run trend. Official getaccess page labels a 2026 report button that actually points to a 2025 PDF, so that older PDF is not used for these current values. Linked method filename says version 1, but downloaded contents identify Version 2.
Supporting record 1 · Supporting record 2 · Supporting record 3
How to cite this resource
MyLittleDesire. Kindness Statistics 2027. https://mylittledesire.com/kindness-statistics/.