
Social connection is associated with several physical-health outcomes, including survival, cardiovascular events, diabetes, frailty and kidney disease. The strength and interpretation vary with the measure, population, outcome and adjustment model.
What are the key social connection and physical-health estimates?
- OR 1.5 (95% CI 1.42–1.59) — overall survival-odds association for stronger relationships in the 2010 review; not 50% longer life. Definition, population, period and source.
- HR 1.35 (95% CI 1.27–1.43) — social isolation and all-cause mortality in the 2025 older-adult review. Definition, population, period and source.
- RR 1.29 (95% CI 1.04–1.59) — poor social relationships and incident CHD in the 2016 review. Definition, population, period and source.
- HR 1.07 (95% CI 0.99–1.16) — fully adjusted isolation–heart attack estimate in the 2018 UK cohort; its interval includes 1. Definition, population, period and source.
- HR 1.17 (95% CI 1.11–1.23) — most versus least isolated and incident diabetes in the UK Model 3. Definition, population, period and source.
- HR 1.21 (95% CI 1.07–1.36) — loneliness and incident diabetes in CHARLS Model 3. Definition, population, period and source.
- OR 2.484 (95% CI 1.773–3.48) — baseline loneliness and prospective frailty; odds, not risk. Definition, population, period and source.
- HR 1.09 (95% CI 1.04–1.13) — most versus least isolated and incident CKD in Model 3, smaller than Model 1. Definition, population, period and source.
How should readers interpret these statistics?
| Term | Interpretation |
|---|---|
| Loneliness | Subjective feeling of insufficient or unsatisfying connection. |
| Social isolation | Limited contact, participation or network connection, measured differently across studies. |
| Living alone | A household arrangement; it does not establish loneliness or poor support. |
| Odds ratio (OR) | A ratio of odds, not probabilities. Favorable survival coding is stated where used. |
| Hazard ratio (HR) | A ratio of modeled event hazards over follow-up, not an absolute event chance. |
| Relative risk (RR) | A ratio of risks over a source-defined period. |
| Pooled effect size (ES) | Source label retained for the 2023 review; no specific ratio class imputed here. |
| 95% confidence interval | Uncertainty around an estimate under the source model;1 is the no-association ratio. |
| Absolute risk | An event probability over a specified period, requiring baseline-risk information not supplied by a ratio alone. |
How are social relationships associated with survival?
The 2010 review coded stronger social relationships in the direction of higher survival odds. An odds ratio above 1 in this section therefore has a different interpretation from an adverse-outcome ratio above 1 elsewhere. Structural, functional and subtype analyses share underlying evidence.
How were stronger relationships associated with survival?
Observational synthesis with heterogeneous measures/adjustment. These are survival odds, not 50% longer life or absolute survival probabilities.
| Finding / design | Estimate and 95% CI | Exposure, direction and model | Period, population and base | Original source |
|---|---|---|---|---|
| F01 All social-relationship measures Meta-analysis | OR 1.5 (95% CI 1.42–1.59) CI excludes 1 | Stronger versus weaker social relationships Higher ratio means greater survival odds with stronger relationships; Random-effects overall and main measurement categories | Literature search January 1900–January 2007; underlying cohort dates vary Participants represented by the specified source analysis; Published analysis/model n=308,849; Published overall meta-analysis participant count; contributing studies=148 | S01 Results: Omnibus analysis; structural, functional and combined sections |
| F02 Structural measures only Meta-analysis | OR 1.57 (95% CI 1.46–1.7) CI excludes 1 | Greater structural connection Higher ratio means greater survival odds with stronger relationships; Random-effects overall and main measurement categories | Literature search January 1900–January 2007; underlying cohort dates vary Participants represented by the specified source analysis; Selected model/pooled n not established; contributing studies=63 | S01 Results: Omnibus analysis; structural, functional and combined sections |
| F03 Functional measures only Meta-analysis | OR 1.46 (95% CI 1.28–1.66) CI excludes 1 | Greater functional support Higher ratio means greater survival odds with stronger relationships; Random-effects overall and main measurement categories | Literature search January 1900–January 2007; underlying cohort dates vary Participants represented by the specified source analysis; Selected model/pooled n not established; contributing studies=24 | S01 Results: Omnibus analysis; structural, functional and combined sections |
| F04 Combined structural/functional measures Meta-analysis | OR 1.44 (95% CI 1.32–1.58) CI excludes 1 | Stronger combined relationship measures Higher ratio means greater survival odds with stronger relationships; Random-effects overall and main measurement categories | Literature search January 1900–January 2007; underlying cohort dates vary Participants represented by the specified source analysis; Selected model/pooled n not established; contributing studies=61 | S01 Results: Omnibus analysis; structural, functional and combined sections |
How did selected relationship measures differ?
Studies can contribute to several categories. Measurement differences do not show which type of relationship intervention works best. Received support and living-alone CIs include 1.
| Finding / design | Estimate and 95% CI | Exposure, direction and model | Period, population and base | Original source |
|---|---|---|---|---|
| F05 Received social support Meta-analysis | OR 1.22 (95% CI 0.91–1.63) CI includes 1 | More received support Higher ratio means greater survival odds with stronger relationships; Table 4 measurement-specific synthesis | Literature search January 1900–January 2007; underlying cohort dates vary Participants represented by the specified source analysis; Selected model/pooled n not established; contributing studies=9 | S01 Table 4; source footnote on shifted units of analysis |
| F06 Perceived availability of support Meta-analysis | OR 1.35 (95% CI 1.22–1.49) CI excludes 1 | More perceived support Higher ratio means greater survival odds with stronger relationships; Table 4 measurement-specific synthesis | Literature search January 1900–January 2007; underlying cohort dates vary Participants represented by the specified source analysis; Selected model/pooled n not established; contributing studies=73 | S01 Table 4; source footnote on shifted units of analysis |
| F07 Complex social integration measures Meta-analysis | OR 1.91 (95% CI 1.63–2.23) CI excludes 1 | Greater integration Higher ratio means greater survival odds with stronger relationships; Table 4 measurement-specific synthesis | Literature search January 1900–January 2007; underlying cohort dates vary Participants represented by the specified source analysis; Selected model/pooled n not established; contributing studies=30 | S01 Table 4; source footnote on shifted units of analysis |
| F08 Living arrangement, inverse coded Meta-analysis | OR 1.19 (95% CI 0.99–1.44) CI includes 1 | Not living alone versus living alone, source inverse coding Higher ratio means greater survival odds with stronger relationships; Table 4 measurement-specific synthesis | Literature search January 1900–January 2007; underlying cohort dates vary Participants represented by the specified source analysis; Selected model/pooled n not established; contributing studies=17 | S01 Table 4; source footnote on shifted units of analysis |
What do mortality reviews show about disconnection?
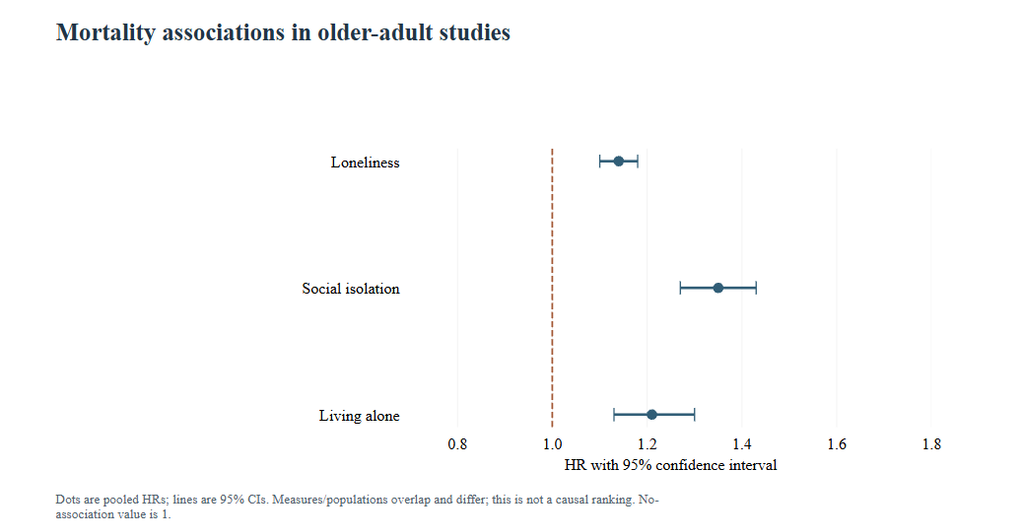
Loneliness, social isolation and living alone are related but distinct exposures. Reviews differ in ages, health conditions, measures and included cohorts. Cause-specific mortality is not disease incidence. The 2023 review retains its ES label; the 2025 older-adult review reports HRs, including uncertain cancer estimates.
What did the 90-cohort mortality review report?
ES is the source label; no specific HR/RR/OR class or risk-percentage conversion is imposed. Selected GRADE certainty low/very low. Analysis n values overlap across outcomes.
| Finding / design | Estimate and 95% CI | Exposure, direction and model | Period, population and base | Original source |
|---|---|---|---|---|
| F09 Isolation: all-cause mortality Meta-analysis | ES 1.32 (95% CI 1.26–1.39) CI excludes 1 | Social isolation Higher ratio means more adverse outcome in the exposed group; Source pooled effect size; cancer-isolation value is trim-and-fill adjusted | 2023 review; underlying cohort dates vary; exact search cutoff not established from inspected public materials Participants represented by the specified source analysis; Published analysis/model n=1,485,469; Published Supplementary Table 11 analysis participant count; overlapping outcomes are not additive; contributing studies=38 | S02 Original abstract; Supplementary Table 11, printed pp.64–65 |
| F10 Loneliness: all-cause mortality Meta-analysis | ES 1.14 (95% CI 1.08–1.2) CI excludes 1 | Loneliness Higher ratio means more adverse outcome in the exposed group; Source pooled effect size; cancer-isolation value is trim-and-fill adjusted | 2023 review; underlying cohort dates vary; exact search cutoff not established from inspected public materials Participants represented by the specified source analysis; Published analysis/model n=1,209,407; Published Supplementary Table 11 analysis participant count; overlapping outcomes are not additive; contributing studies=45 | S02 Original abstract; Supplementary Table 11, printed pp.64–65 |
| F11 Isolation: cancer mortality, bias-adjusted Meta-analysis | ES 1.24 (95% CI 1.19–1.28) CI excludes 1 | Social isolation Higher ratio means more adverse outcome in the exposed group; Supplementary Table 11 trim-and-fill-adjusted ES; raw pooled ES 1.22 | 2023 review; underlying cohort dates vary; exact search cutoff not established from inspected public materials Participants represented by the specified source analysis; Published analysis/model n=1,171,644; Published Supplementary Table 11 analysis participant count; overlapping outcomes are not additive; contributing studies=11 | S02 Original abstract; Supplementary Table 11, printed pp.64–65 |
| F12 Loneliness: cancer mortality Meta-analysis | ES 1.09 (95% CI 1.01–1.17) CI excludes 1 | Loneliness Higher ratio means more adverse outcome in the exposed group; Source pooled effect size; cancer-isolation value is trim-and-fill adjusted | 2023 review; underlying cohort dates vary; exact search cutoff not established from inspected public materials Participants represented by the specified source analysis; Published analysis/model n=476,404; Published Supplementary Table 11 analysis participant count; overlapping outcomes are not additive; contributing studies=3 | S02 Original abstract; Supplementary Table 11, printed pp.64–65 |
| F13 Isolation: cardiovascular mortality Meta-analysis | ES 1.34 (95% CI 1.25–1.44) CI excludes 1 | Social isolation Higher ratio means more adverse outcome in the exposed group; Source pooled effect size; cancer-isolation value is trim-and-fill adjusted | 2023 review; underlying cohort dates vary; exact search cutoff not established from inspected public materials Participants represented by the specified source analysis; Published analysis/model n=1,265,108; Published Supplementary Table 11 analysis participant count; overlapping outcomes are not additive; contributing studies=12 | S02 Original abstract; Supplementary Table 11, printed pp.64–65 |
What did that review report in clinical populations?
Disease-specific populations, not general-population incidence. Related cohort contributions are not independent replications or treatment trials.
| Finding / design | Estimate and 95% CI | Exposure, direction and model | Period, population and base | Original source |
|---|---|---|---|---|
| F14 Prior CVD: isolation and all-cause death Meta-analysis | ES 1.28 (95% CI 1.1–1.48) CI excludes 1 | Social isolation in people with CVD Higher ratio means more adverse outcome in the exposed group; Source pooled effect size, clinical-population strata | 2023 review; underlying cohort dates vary; exact search cutoff not established from inspected public materials Participants with cardiovascular disease; Published analysis/model n=487,722; Published Supplementary Table 11 analysis participant count; overlapping outcomes are not additive; contributing studies=8 | S02 Original abstract; Supplementary Table 11, printed pp.64–65 |
| F15 Breast cancer: isolation and all-cause death Meta-analysis | ES 1.51 (95% CI 1.34–1.7) CI excludes 1 | Social isolation in breast cancer Higher ratio means more adverse outcome in the exposed group; Source pooled effect size, clinical-population strata | 2023 review; underlying cohort dates vary; exact search cutoff not established from inspected public materials Participants with breast cancer; Published analysis/model n=18,955; Published Supplementary Table 11 analysis participant count; overlapping outcomes are not additive; contributing studies=4 | S02 Original abstract; Supplementary Table 11, printed pp.64–65 |
| F16 Breast cancer: isolation and cancer death Meta-analysis | ES 1.33 (95% CI 1.02–1.75) CI excludes 1 | Social isolation in breast cancer Higher ratio means more adverse outcome in the exposed group; Source pooled effect size, clinical-population strata | 2023 review; underlying cohort dates vary; exact search cutoff not established from inspected public materials Participants with breast cancer; Published analysis/model n=18,955; Published Supplementary Table 11 analysis participant count; overlapping outcomes are not additive; contributing studies=4 | S02 Original abstract; Supplementary Table 11, printed pp.64–65 |
How was loneliness associated with mortality in older adults?
Older-adult/clinical populations; heterogeneous measurement and adjustments. Outcomes and samples overlap. Single-study outcomes are explicitly marked; cancer CIs crossing 1 are not conclusive increases.
| Finding / design | Estimate and 95% CI | Exposure, direction and model | Period, population and base | Original source |
|---|---|---|---|---|
| F17 All-cause mortality Meta-analysis | HR 1.14 (95% CI 1.1–1.18) CI excludes 1 | Loneliness Higher ratio means more adverse outcome in the exposed group; Random-effects outcome synthesis; one-study rows retain that single estimate | Literature search through December 31, 2023; cohort dates and follow-up vary Older adults represented in the review, including selected clinical populations; Published analysis/model n=308,948; Published outcome-specific meta-analysis participant count; not additive across outcomes; contributing studies=52 | S03 Results: Loneliness primary/secondary mortality outcomes |
| F18 CVD mortality Meta-analysis | HR 1.3 (95% CI 1.09–1.54) CI excludes 1 | Loneliness Higher ratio means more adverse outcome in the exposed group; Random-effects outcome synthesis; one-study rows retain that single estimate | Literature search through December 31, 2023; cohort dates and follow-up vary Older adults represented in the review, including selected clinical populations; Published analysis/model n=37,104; Published outcome-specific meta-analysis participant count; not additive across outcomes; contributing studies=6 | S03 Results: Loneliness primary/secondary mortality outcomes |
| F19 Cancer mortality: one study Meta-analysis | HR 1.02 (95% CI 0.68–1.53) CI includes 1 | Loneliness Higher ratio means more adverse outcome in the exposed group; Random-effects outcome synthesis; one-study rows retain that single estimate | Literature search through December 31, 2023; cohort dates and follow-up vary Older adults represented in the review, including selected clinical populations; Published analysis/model n=6,915; Published outcome-specific meta-analysis participant count; not additive across outcomes; contributing studies=1 | S03 Results: Loneliness primary/secondary mortality outcomes |
How was social isolation associated with mortality in older adults?
Older-adult/clinical populations; heterogeneous measurement and adjustments. Outcomes and samples overlap. Single-study outcomes are explicitly marked; cancer CIs crossing 1 are not conclusive increases.
| Finding / design | Estimate and 95% CI | Exposure, direction and model | Period, population and base | Original source |
|---|---|---|---|---|
| F20 All-cause mortality Meta-analysis | HR 1.35 (95% CI 1.27–1.43) CI excludes 1 | Social isolation Higher ratio means more adverse outcome in the exposed group; Random-effects outcome synthesis; one-study rows retain that single estimate | Literature search through December 31, 2023; cohort dates and follow-up vary Older adults represented in the review, including selected clinical populations; Published analysis/model n=233,279; Published outcome-specific meta-analysis participant count; not additive across outcomes; contributing studies=37 | S03 Results: Social isolation primary/secondary mortality outcomes |
| F21 CVD mortality Meta-analysis | HR 1.37 (95% CI 1.19–1.56) CI excludes 1 | Social isolation Higher ratio means more adverse outcome in the exposed group; Random-effects outcome synthesis; one-study rows retain that single estimate | Literature search through December 31, 2023; cohort dates and follow-up vary Older adults represented in the review, including selected clinical populations; Published analysis/model n=63,434; Published outcome-specific meta-analysis participant count; not additive across outcomes; contributing studies=4 | S03 Results: Social isolation primary/secondary mortality outcomes |
| F22 Cancer mortality Meta-analysis | HR 1.13 (95% CI 0.98–1.29) CI includes 1 | Social isolation Higher ratio means more adverse outcome in the exposed group; Random-effects outcome synthesis; one-study rows retain that single estimate | Literature search through December 31, 2023; cohort dates and follow-up vary Older adults represented in the review, including selected clinical populations; Published analysis/model n=54,759; Published outcome-specific meta-analysis participant count; not additive across outcomes; contributing studies=5 | S03 Results: Social isolation primary/secondary mortality outcomes |
| F23 Other mortality: one study Meta-analysis | HR 1.24 (95% CI 1.03–1.49) CI excludes 1 | Social isolation Higher ratio means more adverse outcome in the exposed group; Random-effects outcome synthesis; one-study rows retain that single estimate | Literature search through December 31, 2023; cohort dates and follow-up vary Older adults represented in the review, including selected clinical populations; Published analysis/model n=30,430; Published outcome-specific meta-analysis participant count; not additive across outcomes; contributing studies=1 | S03 Results: Social isolation primary/secondary mortality outcomes |
How was living alone associated with mortality in older adults?
Older-adult/clinical populations; heterogeneous measurement and adjustments. Outcomes and samples overlap. Single-study outcomes are explicitly marked; cancer CIs crossing 1 are not conclusive increases.
| Finding / design | Estimate and 95% CI | Exposure, direction and model | Period, population and base | Original source |
|---|---|---|---|---|
| F24 All-cause mortality Meta-analysis | HR 1.21 (95% CI 1.13–1.3) CI excludes 1 | Living alone Higher ratio means more adverse outcome in the exposed group; Random-effects outcome synthesis; one-study rows retain that single estimate | Literature search through December 31, 2023; cohort dates and follow-up vary Older adults represented in the review, including selected clinical populations; Published analysis/model n=86,553; Published outcome-specific meta-analysis participant count; not additive across outcomes; contributing studies=17 | S03 Results: Living alone primary/secondary mortality outcomes |
| F25 CVD mortality Meta-analysis | HR 1.37 (95% CI 1.17–1.61) CI excludes 1 | Living alone Higher ratio means more adverse outcome in the exposed group; Random-effects outcome synthesis; one-study rows retain that single estimate | Literature search through December 31, 2023; cohort dates and follow-up vary Older adults represented in the review, including selected clinical populations; Published analysis/model n=4,868; Published outcome-specific meta-analysis participant count; not additive across outcomes; contributing studies=2 | S03 Results: Living alone primary/secondary mortality outcomes |
| F26 Cancer mortality: one study Meta-analysis | HR 1.36 (95% CI 0.98–1.89) CI includes 1 | Living alone Higher ratio means more adverse outcome in the exposed group; Random-effects outcome synthesis; one-study rows retain that single estimate | Literature search through December 31, 2023; cohort dates and follow-up vary Older adults represented in the review, including selected clinical populations; Published analysis/model n=1,522; Published outcome-specific meta-analysis participant count; not additive across outcomes; contributing studies=1 | S03 Results: Living alone primary/secondary mortality outcomes |
| F27 Other mortality: one study Meta-analysis | HR 1.76 (95% CI 1.29–2.4) CI excludes 1 | Living alone Higher ratio means more adverse outcome in the exposed group; Random-effects outcome synthesis; one-study rows retain that single estimate | Literature search through December 31, 2023; cohort dates and follow-up vary Older adults represented in the review, including selected clinical populations; Published analysis/model n=1,522; Published outcome-specific meta-analysis participant count; not additive across outcomes; contributing studies=1 | S03 Results: Living alone primary/secondary mortality outcomes |
What do studies find for heart disease and stroke?
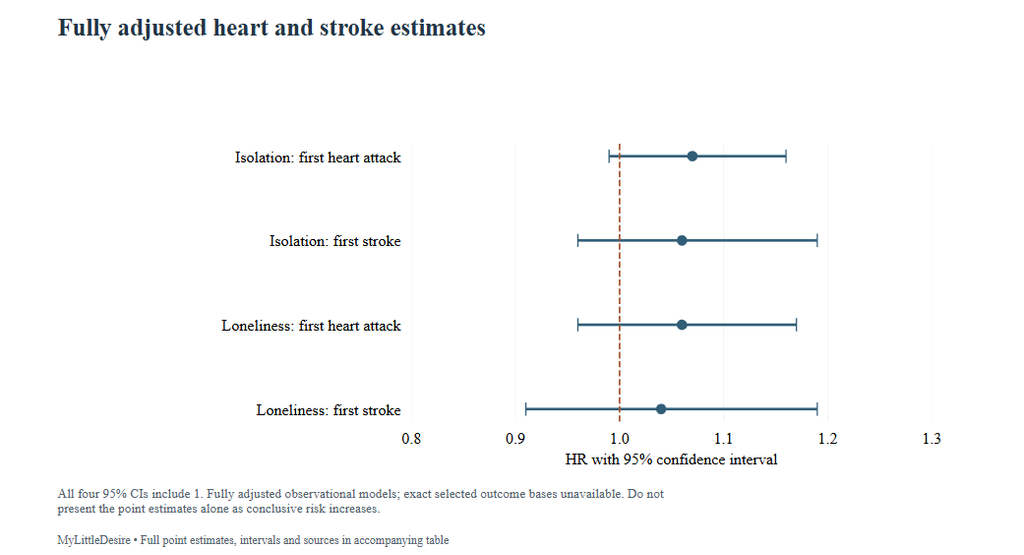
The 2016 pooled relative risks and the 2018 UK Biobank models answer different questions. In the UK cohort, broader adjustment substantially attenuated the incident-event associations. Keeping the fully adjusted confidence intervals visible prevents a point estimate from being mistaken for a conclusive increase.
What were the pooled CHD and stroke associations?
Poor social relationships combines loneliness/isolation measures. RR is relative risk, not absolute probability. These observational findings do not establish prevention by intervention.
| Finding / design | Estimate and 95% CI | Exposure, direction and model | Period, population and base | Original source |
|---|---|---|---|---|
| F28 Coronary heart disease incidence Meta-analysis | RR 1.29 (95% CI 1.04–1.59) CI excludes 1 | Poorer social relationships Higher ratio means more adverse outcome in the exposed group; Most adjusted estimates; random-effects pooling | Studies published through May 2015; follow-up 3–21 years Participants represented by the specified source analysis; Selected model/pooled n not established; contributing studies=11 | S04 Abstract; pooled results and source forest plots |
| F29 Stroke incidence Meta-analysis | RR 1.32 (95% CI 1.04–1.68) CI excludes 1 | Poorer social relationships Higher ratio means more adverse outcome in the exposed group; Most adjusted estimates; random-effects pooling | Studies published through May 2015; follow-up 3–21 years Participants represented by the specified source analysis; Selected model/pooled n not established; contributing studies=8 | S04 Abstract; pooled results and source forest plots |
What did demographic-only cardiovascular models show?
These estimates precede broader risk-factor adjustment and are related to the later models below. The isolation–AMI demographic estimate is omitted because of a CI typographical issue in the inspected abstract.
| Finding / design | Estimate and 95% CI | Exposure, direction and model | Period, population and base | Original source |
|---|---|---|---|---|
| F30 Isolation and first stroke: demographic model Cohort study | HR 1.39 (95% CI 1.25–1.54) CI excludes 1 | Social isolation Higher ratio means more adverse outcome in the exposed group; Demographic adjustment | UK Biobank baseline 2006–2010; reported follow-up 7.1 years; exact administrative cutoff not established from abstract Participants represented by the specified source analysis; Selected model/pooled n not established | S05 Original author abstract, demographic-adjusted results |
| F31 Loneliness and first heart attack: demographic model Cohort study | HR 1.49 (95% CI 1.36–1.64) CI excludes 1 | Loneliness Higher ratio means more adverse outcome in the exposed group; Demographic adjustment | UK Biobank baseline 2006–2010; reported follow-up 7.1 years; exact administrative cutoff not established from abstract Participants represented by the specified source analysis; Selected model/pooled n not established | S05 Original author abstract, demographic-adjusted results |
| F32 Loneliness and first stroke: demographic model Cohort study | HR 1.36 (95% CI 1.2–1.55) CI excludes 1 | Loneliness Higher ratio means more adverse outcome in the exposed group; Demographic adjustment | UK Biobank baseline 2006–2010; reported follow-up 7.1 years; exact administrative cutoff not established from abstract Participants represented by the specified source analysis; Selected model/pooled n not established | S05 Original author abstract, demographic-adjusted results |
What happened after broader cardiovascular adjustment?
All four 95% CIs include 1. This is important uncertainty, not proof that connection has no health relevance. Model attenuation does not establish what an intervention would do.
| Finding / design | Estimate and 95% CI | Exposure, direction and model | Period, population and base | Original source |
|---|---|---|---|---|
| F33 Isolation and first heart attack: fully adjusted Cohort study | HR 1.07 (95% CI 0.99–1.16) CI includes 1 | Social isolation Higher ratio means more adverse outcome in the exposed group; Fully adjusted as described by authors | UK Biobank baseline 2006–2010; reported follow-up 7.1 years; exact administrative cutoff not established from abstract Participants represented by the specified source analysis; Selected model/pooled n not established | S05 Original author abstract, fully adjusted results |
| F34 Isolation and first stroke: fully adjusted Cohort study | HR 1.06 (95% CI 0.96–1.19) CI includes 1 | Social isolation Higher ratio means more adverse outcome in the exposed group; Fully adjusted as described by authors | UK Biobank baseline 2006–2010; reported follow-up 7.1 years; exact administrative cutoff not established from abstract Participants represented by the specified source analysis; Selected model/pooled n not established | S05 Original author abstract, fully adjusted results |
| F35 Loneliness and first heart attack: fully adjusted Cohort study | HR 1.06 (95% CI 0.96–1.17) CI includes 1 | Loneliness Higher ratio means more adverse outcome in the exposed group; Fully adjusted as described by authors | UK Biobank baseline 2006–2010; reported follow-up 7.1 years; exact administrative cutoff not established from abstract Participants represented by the specified source analysis; Selected model/pooled n not established | S05 Original author abstract, fully adjusted results |
| F36 Loneliness and first stroke: fully adjusted Cohort study | HR 1.04 (95% CI 0.91–1.19) CI includes 1 | Loneliness Higher ratio means more adverse outcome in the exposed group; Fully adjusted as described by authors | UK Biobank baseline 2006–2010; reported follow-up 7.1 years; exact administrative cutoff not established from abstract Participants represented by the specified source analysis; Selected model/pooled n not established | S05 Original author abstract, fully adjusted results |
Was isolation associated with death after prior cardiovascular disease?
Mortality among participants with a prior event, not the chance of developing that event. Exact selected subgroup/model n unavailable.
| Finding / design | Estimate and 95% CI | Exposure, direction and model | Period, population and base | Original source |
|---|---|---|---|---|
| F37 Isolation after prior heart attack Cohort study | HR 1.25 (95% CI 1.03–1.51) CI excludes 1 | Social isolation with prior AMI Higher ratio means more adverse outcome in the exposed group; Fully adjusted; prior-disease subgroup | UK Biobank baseline 2006–2010; reported follow-up 7.1 years; exact administrative cutoff not established from abstract UK Biobank participants with prior AMI; Selected model/pooled n not established | S05 Original author abstract, prior AMI/stroke mortality |
| F38 Isolation after prior stroke Cohort study | HR 1.32 (95% CI 1.08–1.61) CI excludes 1 | Social isolation with prior stroke Higher ratio means more adverse outcome in the exposed group; Fully adjusted; prior-disease subgroup | UK Biobank baseline 2006–2010; reported follow-up 7.1 years; exact administrative cutoff not established from abstract UK Biobank participants with prior stroke; Selected model/pooled n not established | S05 Original author abstract, prior AMI/stroke mortality |
What do prospective diabetes studies show?
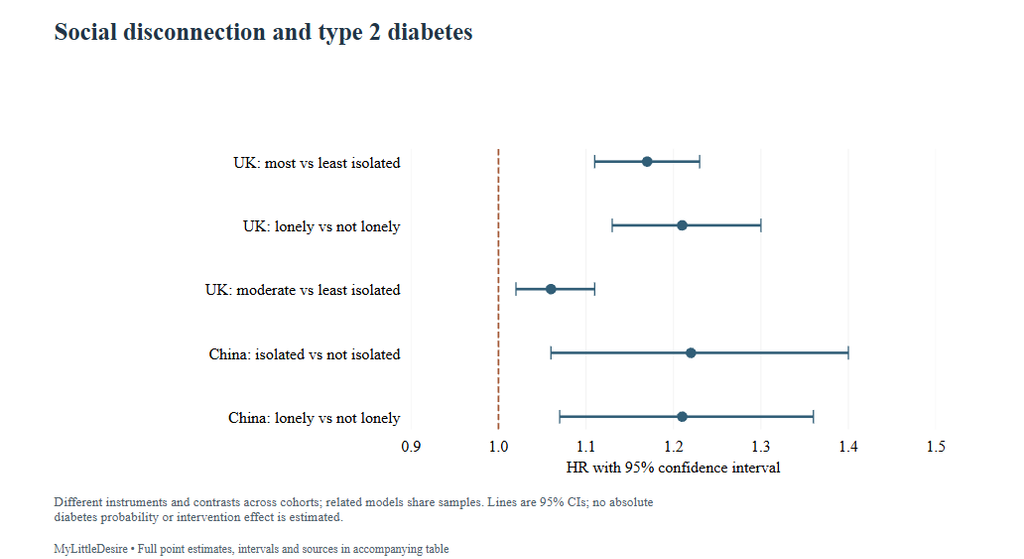
The 2023 paper studied UK Biobank and CHARLS separately. Their isolation definitions and health-data systems differ. The selected rows use each cohort’s Model 3, including clinical and lifestyle covariates. They are related contrasts, not five separate studies or evidence that any one person will develop diabetes.
What did the UK diabetes cohort show?
Different isolation contrasts. Published UK model cohort includes all levels, not only the exposed group. HRs are not absolute diabetes probabilities; adjustment cannot eliminate all confounding.
| Finding / design | Estimate and 95% CI | Exposure, direction and model | Period, population and base | Original source |
|---|---|---|---|---|
| F39 UK: most versus least isolated Cohort study | HR 1.17 (95% CI 1.11–1.23) CI excludes 1 | Most versus least isolated Higher ratio means more adverse outcome in the exposed group; Fully adjusted Model 3 | UK baseline 2006–2010, mean follow-up 13.5 years, records with varying cutoffs through 2022; CHARLS 2011–2018, mean follow-up 5.8 years UK Biobank analytic cohort without baseline diabetes; Published analysis/model n=423,503; Published UK cohort model base across exposure categories; covariate missingness handled per methods | S06 Table 2, separate effects, Model 3 |
| F40 UK: lonely versus not lonely Cohort study | HR 1.21 (95% CI 1.13–1.3) CI excludes 1 | Lonely versus not lonely Higher ratio means more adverse outcome in the exposed group; Fully adjusted Model 3 | UK baseline 2006–2010, mean follow-up 13.5 years, records with varying cutoffs through 2022; CHARLS 2011–2018, mean follow-up 5.8 years UK Biobank analytic cohort without baseline diabetes; Published analysis/model n=423,503; Published UK cohort model base across exposure categories; covariate missingness handled per methods | S06 Table 2, separate effects, Model 3 |
| F41 UK: moderately versus least isolated Cohort study | HR 1.06 (95% CI 1.02–1.11) CI excludes 1 | Moderately versus least isolated Higher ratio means more adverse outcome in the exposed group; Fully adjusted Model 3 | UK baseline 2006–2010, mean follow-up 13.5 years, records with varying cutoffs through 2022; CHARLS 2011–2018, mean follow-up 5.8 years UK Biobank analytic cohort without baseline diabetes; Published analysis/model n=423,503; Published UK cohort model base across exposure categories; covariate missingness handled per methods | S06 Table 2, separate effects, Model 3 |
What did the Chinese diabetes cohort show?
CHARLS exposure instruments differ from UK Biobank. Similar point estimates do not prove identical effects or independent evidence from other CHARLS publications.
| Finding / design | Estimate and 95% CI | Exposure, direction and model | Period, population and base | Original source |
|---|---|---|---|---|
| F42 CHARLS: isolated versus not isolated Cohort study | HR 1.22 (95% CI 1.06–1.4) CI excludes 1 | Isolated versus not isolated Higher ratio means more adverse outcome in the exposed group; Fully adjusted Model 3 | UK baseline 2006–2010, mean follow-up 13.5 years, records with varying cutoffs through 2022; CHARLS 2011–2018, mean follow-up 5.8 years Chinese CHARLS analytic cohort, adults 45+, without baseline diabetes; Published analysis/model n=13,800; Published CHARLS cohort model base across exposure categories; covariate missingness handled per methods | S06 Table 3, separate effects, Model 3 |
| F43 CHARLS: lonely versus not lonely Cohort study | HR 1.21 (95% CI 1.07–1.36) CI excludes 1 | Lonely versus not lonely Higher ratio means more adverse outcome in the exposed group; Fully adjusted Model 3 | UK baseline 2006–2010, mean follow-up 13.5 years, records with varying cutoffs through 2022; CHARLS 2011–2018, mean follow-up 5.8 years Chinese CHARLS analytic cohort, adults 45+, without baseline diabetes; Published analysis/model n=13,800; Published CHARLS cohort model base across exposure categories; covariate missingness handled per methods | S06 Table 3, separate effects, Model 3 |
How is social connection associated with frailty?
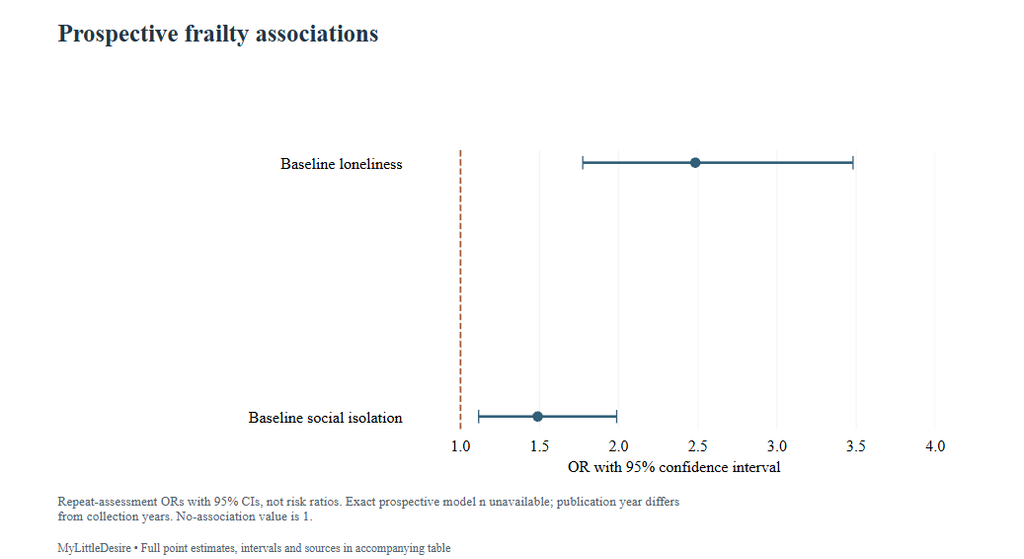
Frailty studies consider weakness, weight loss, exhaustion, activity and walking speed. The meta-analysis and cohort estimates are odds ratios. Cross-sectional associations at baseline differ from prospective estimates at repeat assessment. New publication dates can describe much older collection periods.
What did the 2026 frailty meta-analysis report?
Odds ratios, not relative risks. High heterogeneity, especially isolation I²95.1%; exposure-specific pooled counts unavailable in abstract. Estimates do not establish screening or treatment benefit.
| Finding / design | Estimate and 95% CI | Exposure, direction and model | Period, population and base | Original source |
|---|---|---|---|---|
| F44 Isolation and frailty: pooled cohorts Meta-analysis | OR 1.31 (95% CI 1.16–1.48) CI excludes 1 | Social isolation Higher ratio means more adverse outcome in the exposed group; Random-effects odds ratios | Included cohort publications 2018–2025; exact search date/underlying collection periods not established in abstract Participants represented by the specified source analysis; Selected model/pooled n not established | S07 Original author abstract, Results |
| F45 Loneliness and frailty: pooled cohorts Meta-analysis | OR 1.83 (95% CI 1.76–1.89) CI excludes 1 | Loneliness Higher ratio means more adverse outcome in the exposed group; Random-effects odds ratios | Included cohort publications 2018–2025; exact search date/underlying collection periods not established in abstract Participants represented by the specified source analysis; Selected model/pooled n not established | S07 Original author abstract, Results |
What were the baseline frailty associations?
Baseline associations cannot establish temporal direction. The reported baseline cohort 447322 is not automatically the exact selected model n.
| Finding / design | Estimate and 95% CI | Exposure, direction and model | Period, population and base | Original source |
|---|---|---|---|---|
| F46 Loneliness and frailty: cross-sectional Cohort study | OR 2.344 (95% CI 2.211–2.484) CI excludes 1 | Loneliness Higher ratio means more adverse outcome in the exposed group; Cross-sectional baseline analysis; adjustment details not fully established from abstract | Baseline 2006–2010; repeat assessment 2012–2013 Participants represented by the specified source analysis; Selected model/pooled n not established | S08 Original author abstract, baseline results |
| F47 Isolation and frailty: cross-sectional Cohort study | OR 2.02 (95% CI 1.926–2.117) CI excludes 1 | Social isolation Higher ratio means more adverse outcome in the exposed group; Cross-sectional baseline analysis; adjustment details not fully established from abstract | Baseline 2006–2010; repeat assessment 2012–2013 Participants represented by the specified source analysis; Selected model/pooled n not established | S08 Original author abstract, baseline results |
What were the prospective frailty associations?
Same underlying UK cohort as baseline and overlapping other UK Biobank papers. Data collected 2006–2013, although paper published 2026. Follow-up sample is not the full baseline sample.
| Finding / design | Estimate and 95% CI | Exposure, direction and model | Period, population and base | Original source |
|---|---|---|---|---|
| F48 Loneliness and frailty: prospective Cohort study | OR 2.484 (95% CI 1.773–3.48) CI excludes 1 | Baseline loneliness Higher ratio means more adverse outcome in the exposed group; Prospective repeat-assessment analysis; exact eligible model n unavailable | Baseline 2006–2010; repeat assessment 2012–2013 Participants represented by the specified source analysis; Selected model/pooled n not established | S08 Original author abstract, prospective results |
| F49 Isolation and frailty: prospective Cohort study | OR 1.488 (95% CI 1.115–1.987) CI excludes 1 | Baseline isolation Higher ratio means more adverse outcome in the exposed group; Prospective repeat-assessment analysis; exact eligible model n unavailable | Baseline 2006–2010; repeat assessment 2012–2013 Participants represented by the specified source analysis; Selected model/pooled n not established | S08 Original author abstract, prospective results |
What do the kidney-disease models show?
The kidney paper provides a useful example of why model choice matters. Its abstract incidence estimates correspond to Model 1. The fully adjusted Model 3 values are smaller. Mortality among participants with existing CKD is a separate outcome and population from new CKD among initially unaffected participants.
Which kidney-incidence estimates appear in the abstract?
These abstract figures are Model 1, not the fully adjusted estimates. They concern new CKD among those without baseline CKD. Table cohort n 406332; exact complete-case model count not separately established.
| Finding / design | Estimate and 95% CI | Exposure, direction and model | Period, population and base | Original source |
|---|---|---|---|---|
| F50 Isolation and incident CKD: Model 1 Cohort study | HR 1.21 (95% CI 1.17–1.26) CI excludes 1 | Most versus least isolated Higher ratio means more adverse outcome in the exposed group; Model 1: demographic/socioeconomic adjustment | UK Biobank baseline 2006–2010; median follow-up 13.5 years; exact cutoff not established in this compilation Participants represented by the specified source analysis; Selected model/pooled n not established | S09 Abstract; Table 2, Model 1 |
| F51 Loneliness and incident CKD: Model 1 Cohort study | HR 1.26 (95% CI 1.21–1.33) CI excludes 1 | Lonely versus not lonely Higher ratio means more adverse outcome in the exposed group; Model 1: demographic/socioeconomic adjustment | UK Biobank baseline 2006–2010; median follow-up 13.5 years; exact cutoff not established in this compilation Participants represented by the specified source analysis; Selected model/pooled n not established | S09 Abstract; Table 2, Model 1 |
What were the fully adjusted kidney-incidence estimates?
Same source cohort/model sequence, not an independent replication or intervention. Estimates attenuate after adjustment. Table cohort n 406332; complete-case model count not separately established.
| Finding / design | Estimate and 95% CI | Exposure, direction and model | Period, population and base | Original source |
|---|---|---|---|---|
| F52 Isolation and incident CKD: Model 3 Cohort study | HR 1.09 (95% CI 1.04–1.13) CI excludes 1 | Most versus least isolated Higher ratio means more adverse outcome in the exposed group; Model 3: broader lifestyle, clinical and genetic adjustment | UK Biobank baseline 2006–2010; median follow-up 13.5 years; exact cutoff not established in this compilation Participants represented by the specified source analysis; Selected model/pooled n not established | S09 Table 2, Model 3 and covariate footnotes |
| F53 Loneliness and incident CKD: Model 3 Cohort study | HR 1.12 (95% CI 1.08–1.19) CI excludes 1 | Lonely versus not lonely Higher ratio means more adverse outcome in the exposed group; Model 3: broader lifestyle, clinical and genetic adjustment | UK Biobank baseline 2006–2010; median follow-up 13.5 years; exact cutoff not established in this compilation Participants represented by the specified source analysis; Selected model/pooled n not established | S09 Table 2, Model 3 and covariate footnotes |
Also Read:-
Greeting Card Industry Statistics 2027
Social Connection After Relocation Statistics 2027
Grief And Support Network Statistics 2027
Social Anxiety And Making Friends Statistics 2027
Couples And Social Media Statistics 2027
What were the mortality associations among people with CKD?
Different population/outcome from CKD incidence. Table cohort n 60331; exact complete-case model counts not separately established. Mortality associations are not individual life-expectancy predictions.
| Finding / design | Estimate and 95% CI | Exposure, direction and model | Period, population and base | Original source |
|---|---|---|---|---|
| F54 Isolation and mortality with baseline CKD Cohort study | HR 1.33 (95% CI 1.26–1.4) CI excludes 1 | Most versus least isolated Higher ratio means more adverse outcome in the exposed group; Model 3 in participants with baseline CKD | UK Biobank baseline 2006–2010; median follow-up 13.5 years; exact cutoff not established in this compilation UK Biobank participants with CKD at baseline; table cohort 60331; Selected model/pooled n not established | S09 Table 3, Model 3 and covariate footnotes |
| F55 Loneliness and mortality with baseline CKD Cohort study | HR 1.1 (95% CI 1.03–1.17) CI excludes 1 | Lonely versus not lonely Higher ratio means more adverse outcome in the exposed group; Model 3 in participants with baseline CKD | UK Biobank baseline 2006–2010; median follow-up 13.5 years; exact cutoff not established in this compilation UK Biobank participants with CKD at baseline; table cohort 60331; Selected model/pooled n not established | S09 Table 3, Model 3 and covariate footnotes |
What does a ratio-minus-one calculation mean?
The workbook converts ten selected ratios and their interval bounds into relative contrasts using point estimate minus 1. For example, HR 1.17 corresponds to 17% higher modeled hazard, while OR 1.50 corresponds to 50% higher odds in its stated direction. These are neither percentage-point differences nor absolute probabilities.
| Finding | Metric-specific interpretation | Point contrast | Interval contrast |
|---|---|---|---|
| F01 | relative odds of survival | 50.0% | 42.0% to 59.0% |
| F17 | relative hazard | 14.0% | 10.0% to 18.0% |
| F20 | relative hazard | 35.0% | 27.0% to 43.0% |
| F28 | relative risk | 29.0% | 4.0% to 59.0% |
| F29 | relative risk | 32.0% | 4.0% to 68.0% |
| F33 | relative hazard | 7.0% | -1.0% to 16.0% |
| F39 | relative hazard | 17.0% | 11.0% to 23.0% |
| F48 | relative odds of the adverse outcome | 148.4% | 77.3% to 248.0% |
| F52 | relative hazard | 9.0% | 4.0% to 13.0% |
| F53 | relative hazard | 12.0% | 8.0% to 19.0% |
Methodology and limitations
This resource selects 55 point estimates, each with a 95% confidence interval, in 19 related groups from nine peer-reviewed papers. Five reviews contribute 31 estimates; four cohort papers contribute 24. There are 14 ORs,31 HRs, two RRs and eight pooled ES values retaining their source label. Repeated models, categories, outcomes and reviews are not independent studies.
2027 is the editorial edition, reviewed November 6, 2026. Publication years range from 2010 to 2026, while collection and review-search periods are stated separately. The 2026 frailty cohort paper uses baseline 2006–2010 and repeat 2012–2013 data. This is a selected research reference, not a prospectively registered exhaustive review or a pooled analysis conducted by MyLittleDesire.
Loneliness is a subjective feeling; isolation describes limited social connection/contact; living alone is a household arrangement. Stronger support, larger networks and household composition are not interchangeable. Exposures and reference groups retain their study definitions. Mortality, new disease and baseline frailty are separate endpoints.
OR, HR and RR are not interchangeable. An OR compares odds; an HR compares event hazards over follow-up under the model; an RR compares risks over a defined period. ES is retained for Wang et al. because its public tables use that pooled label across studies reporting different ratio measures. No specific class is imputed and those ES values are excluded from metric-specific percentage calculations. An association ratio cannot supply an individual absolute probability without the relevant baseline risk and time horizon.
Holt-Lunstad et al. coded values above 1 toward greater survival with stronger relationships. The OR 1.50 is therefore 50% higher survival odds, not 50 percentage points,50% longer life or a 50% reduction in death risk. Its Table 4 subtypes reuse studies and differ from the main measurement categories. Some study estimates used relatively limited adjustment. A received-support CI crossing 1 is retained.
Wang et al.’s public abstract and Supplementary Table 11 were inspected. The isolation–cancer estimate 1.24 is a trim-and-fill adjustment for possible publication bias; the raw pooled value is 1.22. These are not independent results. Other selected estimates retain their specified population/model. The source’s selected certainty ratings are low or very low, and publication-bias sensitivity changes some estimates. Its full overall 2,205,199 is not assigned to each row; table-specific analysis counts are retained and must not be summed.
Nakou et al. searched through December 2023 and included 86 studies. Some secondary outcomes use one study. Heterogeneity is substantial and all-cause prediction intervals include 1, so pooled confidence intervals do not describe the range of effects expected in every future setting. Outcome-specific participant counts overlap. Cancer estimates whose confidence intervals include 1 are not described as established associations. No unique worldwide sample size is created by adding reviews.
Hakulinen et al.’s demographic and fully adjusted UK models differ. All four selected fully adjusted incident-event intervals include 1. Broader adjustment may involve confounding and mediating factors; attenuation is not an experimentally measured treatment effect. The exact selected event/subgroup model sizes are unavailable in the inspected abstract. A demographic isolation–AMI CI contains an extraneous typographical dash, so that model is omitted instead of repaired without verification.
Song et al.’s full text and Tables 2–3 establish UK and CHARLS Model 3 estimates. Published cohort-model bases are 423,503 and 13,800, with covariate missingness handled through imputation or unknown categories. Model bases include reference and other exposure levels. MR estimates and population-attributable fractions are not counted here. Other papers using UK Biobank can overlap these participants.
Zhao et al.’s frailty review and Zhou et al.’s cohort estimates were checked in their original author abstracts; complete statistical details and selected model bases were not established from full reports. High isolation heterogeneity and the unknown smaller prospective UK sample remain visible. Cross-sectional associations do not establish temporal order, and frailty odds ratios should not be called equal-sized risk increases.
Guo et al.’s full Tables 2–3 distinguish Model 1 from Model 3. Abstract incidence values 1.21/1.26 are Model 1; Model 3 is 1.09/1.12. Mortality Model 3 among CKD patients is 1.33/1.10. Table cohorts are 406,332 without and 60,331 with CKD; exact complete-case model counts are not separately established here. All models share the source cohort and cannot be counted as replication.
Nine selected confidence intervals include 1. This is uncertainty compatible with the no-association value at the stated confidence level, not proof that the true effect is exactly zero. Confidence intervals and study covariate adjustment do not rule out residual confounding, reverse causation, measurement error or selection bias. These estimates do not establish how much a social intervention would change disease incidence or mortality, and they do not support treating social isolation as literally equivalent to smoking a fixed number of cigarettes.
Questions readers ask
Does a 50% survival-odds association mean living 50% longer?
No. The 2010 estimate is an odds ratio under the study’s survival coding. It does not measure lifespan extension, absolute survival improvement or a randomized treatment effect.
Does loneliness cause heart disease or diabetes?
These selected observational estimates do not establish a treatment effect or rule out confounding and reverse causation. Model definitions and adjustment choices matter.
Why include estimates whose intervals cross 1?
Omitting them would hide uncertainty. They are compatible with the no-association value under the source model and should not be presented as conclusive increases.
Can these papers tell me my personal disease risk?
A ratio alone cannot supply an individual probability. Baseline risk, follow-up time, clinical factors and the source population would be needed.
Are living alone, isolation and loneliness the same?
No. Someone can live alone with a strong network, or feel lonely despite frequent contact. The exposures should retain their original definitions.
Related social-connection research
Explore our loneliness statistics, friendship statistics, and social support during life changes statistics.
Original papers and methods
- Holt-Lunstad, Smith & Layton / PLOS Medicine [S01] — Social Relationships and Mortality Risk: A Meta-analytic Review
Published: July 27, 2010. Period: Literature search January 1900–January 2007; underlying cohort dates vary. Full source/starting analytic n=308,849, not automatically every model’s base. 148 contributing study/cohort collections in source. Random-effects synthesis of prospective observational studies; transformed odds ratios coded so higher values favor survival with stronger relationships. The overall OR 1.50 concerns survival odds, not 50% longer life,50 percentage points or an intervention effect. Main structural/functional/combined categories differ from Table 4 subtype analyses that reuse studies. Some source models used minimal adjustment. Table 4 selected participant counts not supplied; k is contributing studies, not people. Original companion/full-text source. - Wang et al. / Nature Human Behaviour [S02] — A systematic review and meta-analysis of 90 cohort studies of social isolation, loneliness and mortality
Published: June 19, 2023. Period: 2023 review; underlying cohort dates vary; exact search cutoff not established from inspected public materials. Full source/starting analytic n=2,205,199, not automatically every model’s base. 90 contributing study/cohort collections in source. Prospective-cohort meta-analysis; original abstract and public Supplementary Table 11 inspected; estimates retain the source label ES. Source tables combine literature reporting HR/RR and label pooled values ES; this compilation does not impute a specific HR/RR/OR class or convert ES to risk percentages. Isolation–cancer 1.24 is the trim-and-fill-adjusted estimate; raw pooled value 1.22 is not substituted. Source GRADE ratings are low/very low for selected outcomes. Cohorts and outcomes overlap; analysis participant counts are not additive. Original companion/full-text source. - Nakou et al. / Aging Clinical and Experimental Research [S03] — Loneliness, social isolation, and living alone: a comprehensive systematic review, meta-analysis, and meta-regression of mortality risks in older adults
Published: January 21, 2025. Period: Literature search through December 31, 2023; cohort dates and follow-up vary. No unique/full participant count assigned here; see source-specific bases. 86 contributing study/cohort collections in source. Random-effects HR synthesis of prospective/longitudinal older-adult studies, including some clinical populations. No unique overall participant count is assigned across overlapping exposures/outcomes. Outcome-specific published analysis counts retained. Some secondary outcomes rely on one study. Heterogeneity/publication bias affect interpretation; all-cause prediction intervals include 1. Cancer CIs crossing 1 are retained, not described as established increases. Original companion/full-text source. - Valtorta et al. / Heart [S04] — Loneliness and social isolation as risk factors for coronary heart disease and stroke: systematic review and meta-analysis of longitudinal observational studies
Published: Online April 18, 2016; journal issue July 2016. Period: Studies published through May 2015; follow-up 3–21 years. Full source/starting analytic n=181,006, not automatically every model’s base. 16 contributing study/cohort collections in source. Longitudinal observational review,23 papers from 16 studies; pooled relative risks from 11 CHD and 8 stroke studies using most adjusted models. Poor social relationships combines loneliness/isolation measures; it is not a single loneliness item. Outcome-specific participant totals not separately established here. Relative risk does not provide absolute event probability or prove that a connection intervention prevents disease. Original companion/full-text source. - Hakulinen et al. / Heart [S05] — Social isolation and loneliness as risk factors for myocardial infarction, stroke and mortality: UK Biobank cohort study of 479054 men and women
Published: 2018; Heart 104:1536–1542. Period: UK Biobank baseline 2006–2010; reported follow-up 7.1 years; exact administrative cutoff not established from abstract. Full source/starting analytic n=479,054, not automatically every model’s base. 1 contributing study/cohort collections in source. Prospective observational cohort; demographic and more extensively adjusted Cox models; selected estimates from original author abstract/cohort publication record. Full cohort count is not assigned to each incident-outcome or prior-disease model. Incident fully adjusted estimates all have CIs including 1. Changes between models are not effects of treatment or proof a mechanism is fully explained. The demographic isolation–AMI abstract CI contains a typographical dash; that model estimate is omitted rather than silently repaired. Original companion/full-text source. - Song et al. / eClinicalMedicine [S06] — Social isolation, loneliness, and incident type 2 diabetes mellitus: results from two large prospective cohorts in Europe and East Asia and Mendelian randomization
Published: September 21, 2023; October 2023 collection. Period: UK baseline 2006–2010, mean follow-up 13.5 years, records with varying cutoffs through 2022; CHARLS 2011–2018, mean follow-up 5.8 years. No unique/full participant count assigned here; see source-specific bases. 2 contributing study/cohort collections in source. Prospective UK Biobank and CHARLS Cox analyses; fully adjusted Model 3 estimates selected from Tables 2–3. UK cohort 423503, CHARLS 13800; missing covariates imputed or treated as unknown categories per methods. Published model cohort bases retained, not only the exposed subgroup. Exposure definitions differ between cohorts. MR and population-attributable fractions are not included in this dataset; observational HRs are not treatment effects. Original companion/full-text source. - Zhao et al. / Archives of Gerontology and Geriatrics [S07] — Social isolation, loneliness and the risk of Frailty status: a meta-analysis of observational studies
Published: Online March 17, 2026; July 2026 issue. Period: Included cohort publications 2018–2025; exact search date/underlying collection periods not established in abstract. Full source/starting analytic n=78,769, not automatically every model’s base. 8 contributing study/cohort collections in source. Random-effects odds-ratio synthesis of cohort studies; selected estimates and CIs verified in original author abstract. Exact exposure-specific pooled bases not supplied in inspected abstract. Isolation heterogeneity I²95.1%; loneliness I²43.4%. A larger odds ratio does not establish a stronger causal effect or that screening prevents frailty. Full report methods not inspected. Original companion/full-text source. - Zhou et al. / Aging & Mental Health [S08] — Loneliness, social isolation, and frailty: results from a prospective analysis of UK biobank participants
Published: Online June 7, 2026; cohort website posting August 30 is not the journal publication date. Period: Baseline 2006–2010; repeat assessment 2012–2013. Full source/starting analytic n=447,322, not automatically every model’s base. 1 contributing study/cohort collections in source. UK Biobank baseline and repeat-assessment analyses using mixed-effects models; original author abstract inspected. 447322 is the reported baseline analytic sample; the selected cross-sectional/prospective model bases are not separately confirmed. Prospective repeat-assessment sample is smaller/unknown here, not 502269 or 447322 by default. Cross-sectional and prospective ORs are related analyses of the same cohort. Publication 2026 does not mean recent collection. Original companion/full-text source. - Guo et al. / International Journal of Surgery [S09] — Association of social isolation and loneliness with the incidence and life expectancy of chronic kidney disease: a population-based cohort study
Published: Online September 23, 2025; January 2026 issue. Period: UK Biobank baseline 2006–2010; median follow-up 13.5 years; exact cutoff not established in this compilation. Full source/starting analytic n=466,663, not automatically every model’s base. 1 contributing study/cohort collections in source. Cox models in separate cohorts without CKD 406332 and with CKD 60331; Model 1 and Model 3 explicitly distinguished. Abstract incidence estimates 1.21/1.26 are Model 1, not fully adjusted. Table 2 Model 3 gives 1.09/1.12. Table 3 Model 3 gives 1.33/1.10 for mortality among CKD patients. Table cohort sizes are supplied in population notes; exact complete-case model counts are not separately established. Life-expectancy models not converted into individual predictions. Original companion/full-text source.
How to cite this resource
MyLittleDesire. Social Connection & Physical Health Statistics 2027. Proposed URL: https://mylittledesire.com/social-connection-physical-health-statistics/. Use after publication and add access date.